
Abstract
This article explores the meaning and context of intellectual capital (IC) numbers to help break free from the domination of IC “accountingisation” . Offering a personal and reflective narrative about IC numbers, I first discuss what numbers mean by exploring the way we think about the number 42. This discussion is followed by two empirical sections examining the meaning and context of a common IC measure, employee turnover rates. Measuring any IC element is problematic from an IC accounting perspective because of the unique context in which each organization operates. The comparability of a number from one organization and one period with another is nearly impossible. The article is original because it takes a thought-provoking narrative journey into the use and meaning of applying IC numbers. It is a personal reflection on the implications of considering the meaning of numbers for IC practice, IC education and research, and IC’s future. It is particularly topical in light of the inclusion of IC in the recent Integrated Reporting (<IR>) Guidelines.
Foreword
Writing a foreword for an academic article is not normal practice. However, this article does not fit neatly with what many academics expect of an academic article. It is different because it presents a personal reflective narrative about my experiences as an accounting practitioner, teacher, and researcher on the subject of IC. It attempts to overcome the problem faced by many academics, like my colleague, Helen Sword (2009), who laments, . . . week after week, I struggle to find up-to-date educational research articles that I can assign to my class without provoking a mutiny . . . My student-colleagues are hungry to learn, but they display an extremely low tolerance for the kind of impersonal, impenetrable prose that has become the dominant written discourse of the social sciences. They want stories, examples, ideas, solutions—not long parenthetical references, convoluted flowcharts and truckloads of . . . jargon. (p. 319)
Thus, my motivation for writing this article as a reflective narrative is to tell the story of my experiences so that accountants and non-accountants alike, especially students, can understand the problem of applying numbers to an accounting technology, such as IC. Hopefully, I have also written something that is enjoyable to read, both inside and outside the classroom.
I recognize that a reflexive narrative is not a common academic writing style. Most academics learn to write in an impersonal and scientific style, distancing themselves from their readers. However, management research is a social science and is amenable to narrative, telling “localized little stories” that go beyond the arguments of grand theories (Llewellyn, 1999, p. 221).
Introduction
What do numbers mean? Some of my students posed the question while I was teaching in Japan in 2012. To me, this is an important question because it delves into the heart of how we teach accounting and accounting-related subjects to our students, and hence how to apply accounting in practice. This article aims to address this question, specifically in relation to accounting for non-financial aspects of businesses, such as IC. Since beginning my research into IC, I have been critical of traditional accounting concepts such as the balance sheet and traditional forms of reporting. However, these traditional reports dominate accounting—and therefore IC—thinking, and thus IC practice, education, and research, resulting in what I term IC “accountingisation” whereby, . . . contemporary IC measurement frameworks are reifying IC in the same manner in which tangible assets are portrayed within accounting, which is akin to attempting to make the intangible tangible . . . This practice of the “accountingisation” of IC has at best brought attention to the concept of IC and not its praxis, thus the ability of contemporary IC frameworks to generate “understanding” is questioned. (Dumay, 2009, p. 205)
To help break free from the domination of accountingisation, this article offers a personal and reflective narrative about IC numbers. I chose to use narrative, not just because I like telling stories, but because narratives are powerful for communicating meaning and sense making (Browning & Boudès, 2005; Dumay, 2011; Weick & Browning, 1986). Hence, I agree with Llewellyn (1999) who argues that narratives are more powerful than calculating (numbers) in developing understanding: In everyday life narration is privileged over calculation. We understand our lives through narratives, narrating experiences first to ourselves—to convince others—and then to others-—to persuade them. However, within the research community, calculating dominates narrating for reasoning, learning and persuading. (p. 220)
Similarly, my most recent research on IC narratives outlines how “narrative furnishes rich accounts of IC,” which “allows us to view inside the organisation in ways that abstract IC indicators cannot, revealing context that is often lost when a phenomenon is abstracted into accounting numbers” (Dumay & Roslender, 2013, p. 265).
The article is also timely because IC is having a resurgence with its inclusion, along with five other capitals, as part of the latest hot topic in accounting, being Integrated Reporting (IIRC, 2013). However, IC’s champions may be disappointed if <IR> does not succeed. Similarly, there is a real danger that the accountants have already captured <IR> (Flower, 2014) and are going to enforce an accountingisation of <IR>, which might once again distance IC from practice and understanding how IC is used to create value. This could be detrimental for <IR>’s proponents because there is a danger if “the form of an accounting display [numbers and or a report] has no relationship with the economic ‘reality’ which the display purportedly represents” (Baker, 2006, p. 678). Therefore, <IR> is in the first stage of its existence, much where IC was in the late 1990s when Stewart (1997) defined IC as something “that can be put to use to create wealth” (p. x) rather than value.
From a theoretical perspective, narrative reflections of experience represent what Llewelyn (2003) refers to as “differentiation theories” (p. 667) of practice, which enable deeper understanding “by ‘cutting the pie’ of experience” (see also Dumay, 2012 for an application in the IC literature). This is opposite to the way positivists use numbers to develop “grand theories” that seek to explain the “impersonal, large scale and enduring aspects of social life” (Llewelyn, 2003, p. 667). In the IC literature, differentiation theories as enabled by narrative are referred to by Guthrie, Ricceri, and Dumay (2012) as third stage IC research “based on a critical and performative analysis of IC practices in action” (p. 69). In IC’s third stage (Guthrie et al., 2012), we aim to better understand how value is created because: value is no longer measured solely on the basis of financial outcomes; rather the value of activities that develop knowledge resources must also be considered. Doing so helps us understand how employees, customers and activities contribute to value creation, leading us to the challenge of how to identify, measure and report on the value of our knowledge resources. (p. 68)
We need ways of looking inside organizations to see how to manage IC to create value. I agree with Guthrie et al. (2012) that we need to develop more IC research that grapples “with the complexities of organisational and institutional worlds rather than repeatedly modelling them and conceiving from them abstract positivistic theory” (p. 89). Therefore, this article concentrates on a narrative story as it enables us to understand better how numbers can dominate in accounting and IC, and how we might look at numbers differently and within their practice contexts.
To do this, I have divided the article into three empirical parts as part of my personal IC journey. The first section, “The meaning of 42,” explores my motivation for writing this article, which is based on a discussion about numbers with my students, while teaching IC in Japan. In this conversation, my students and I explored what numbers mean by looking at how to use the number 42 to give meaning and context to something.
Building on the concepts of meaning and context, I then present reflections about a commonly used IC measure, employee turnover. Thus, the second part, “Employee turnover at Westpac Bank,” examines how an Australian bank has publicly disclosed its challenges with high employee turnover, the results of addressing the challenge, and how this changed into different measures as the context of its business changed. A third part, “Employee Turnover at Lands,” offers a different view because this organization traditionally had low levels of turnover and continued to do so while attempting to renew its workforce due to the impending retirement of older employees. To conclude the article, I present some reflections on what this means for IC and the implications for IC practice, education, and research.
The Meaning of 42
In August 2012, I was invited to teach a course called Intellectual Capital: Past, Present, and Future as part of the summer intensive program at Kobe University Graduate School of Business Administration. The purpose of the course was to utilize critical thinking and analytical skills to probe IC. During the course, we examined IC, why it is important, its history, and how to use IC in practice.
The students had all studied accounting as part of their undergraduate or postgraduate degrees. They were now enrolled in a Master’s or PhD research program, fully indoctrinated in the concept of accounting. During the first class, one student summed up his expectations declaring he, like most of his classmates, had come to “learn how to put IC on the balance sheet.” Right away, I knew I had my work cut out for me because these students appeared to be stuck in an “accountingisation” of IC that has plagued IC for so many years (Dumay, 2009; Habersam, Piber, & Skoog, 2013). The accountingisation of IC is problematic because it may misdirect “managerial attention towards more refinement” rather than connecting IC with management actions (Habersam et al., 2013, p. 322). My challenge was to get them out of this mode of thinking. But how?
On the third day, I could feel that the majority of students were still looking for the right IC numbers and were perplexed that I had not yet offered them a comprehensive list of IC measures that could be applied to all organizations. To help break them free from their accountingisation mind-set, I went to the whiteboard and emblazoned a large number 42. “What does that mean?” I asked them.
After a bit of pondering, one student politely suggested, “It is your age sir!”
“Sorry” I replied “it is not. However, the compliment will not go unnoticed, one extra mark for you,” resulting in some polite laughs from the class.
“Next,” I said, to keep the discussion going. A student in the back then explained from a Japanese perspective, 42 is an unlucky number: 42 is pronounced yon-ju-ni. The four is pronounced yon in ordinary Japanese. However, four can also be pronounced shi, meaning death. Therefore, just four is a bad number in Japan. So, Japanese people, especially the older generation, don’t like four. For example, traditional Japanese hotels do not have a room number four. Thus, 42 can also be read as shi-ni in Japanese, meaning to die. Therefore, in Japan, 42 is a bad number.
“Why did you pick 42?” asked another student. I explained that 42 is my favorite number because of its association with The Hitchhikers Guide to the Galaxy. In the guide, a giant super-computer, called Deep Thought, is built and takes 7.5 million years to come up with the answer “Of Life, the Universe and Everything . . . ” When asked by the characters Loonquawl and Phouchg to reveal the answer, the computer replies (Adams, 1979), “Forty-two,” said Deep Thought, with infinite majesty and calm. “Forty-two!” yelled Loonquawl. “Is that all you’ve got to show for seven and a half million years’ work?” “I checked it very thoroughly,” said the computer, “and that quite definitely is the answer. I think the problem, to be quite honest with you, is that you’ve never actually known what the question is.” “But it was the Great Question! The Ultimate Question of Life, the Universe and Everything!” howled Loonquawl. “Yes,” said Deep Thought with the air of one who suffers fools gladly, “but what actually is it?” A slow stupefied silence crept over the men as they stared at the computer and then at each other. “Well, you know, it’s just Everything . . . Everything . . . ” offered Phouchg weakly. “Exactly!” said Deep Thought. “So once you do know what the question actually is, you’ll know what the answer means.”
Unfortunately, the age group of my class was such that they did not know much about The Hitchhikers Guide to the Galaxy, or its relationship to the number 42, so my whole point about meaning and context was somewhat lost on them. So I promised to investigate the number 42 in more depth and get back to them about what 42 meant in different contexts.
The first and most intriguing discovery I made is the 3 × 3 × 3 magic cube, whereby the numbers from 1 through to 27 can all be used to form a cube whereby any three numbers in a line add up to the sum of 42, a bit like Sudoku on steroids (see Figure 1).

The 3 × 3 × 3 Magic Cube adding to 42.
In nature, 42 is the optimum angle for white light to refract through water to form a rainbow. As shown in Figure 2 below, when white light enters the raindrop, it is reflected off the back of the raindrop. The light is dispersed into the colors of the rainbow because red light refracts less than blue light. The optimum angle for this to occur is between 40.89° and 42°.

Light refracting within a raindrop to form a rainbow.
In sport, 42 was the number worn by Jackie Robinson, who in 1947 became the first Major League Baseball player since the 1880s to break the color barrier, which was instrumental in breaking down the race barrier in other American professional sports and contributed to the development of the civil rights movement in America. Robinson was also a star player and was inducted into the Baseball Hall of Fame in 1962. His jersey number 42 was officially retired from all Major League Baseball teams in 1967, the first time such an honor was bestowed on any professional sportsman (see Figure 3).

Jack (Jackie) Roosevelt Robinson (1919-1972).
In the computer world, in the ASCII character set, 1 42 is the number corresponding to the asterisk (*) that is commonly known as the wildcard character. The * is especially handy when searching databases when part of a search term is unknown as it will return the known part of the search term and then any character(s) in place of the asterisk. For example, if I wanted to search for everyone whose first name was John in a database, I would enter the search term “John *,” and the database would return everyone with the first name John, regardless of last name. Thus, 42 can be anything.
I reported the findings of my research to the class, and they were amazed that one number could mean so many different things.
“But, what does this have to do with intellectual capital?” asked one student.
“Well, to me, it is all about the meaning and context” I replied. Forty-two is a meaningful number in a range of contexts. I then quoted from my favorite article about accounting numbers by Robson (1992) where he explains how accounting numbers are abstractions and hides context when he discusses nine cars: That my cars may be of different make, engine capacity, colour, top speed, etc., and indeed that no cars are ever the same, is actively suppressed by the process of quantification … The objects constituted as concepts, numbered and subject, in this example, to aggregation are not merely “similar” by being counted; they are identical within the signifiers of mathematics in which they are now located. (p. 688)
The class conversation then turned to how managing IC relates to numbers as abstractions by examining a common key performance indicator (KPI), employee turnover rates. I use employee turnover as an example for my students and this article because employee turnover was a key KPI in two different research projects I have been involved in investigating IC management practice. The research organizations are Westpac Bank and the New South Wales Department of Lands (Lands). Each case was an independent research project with different objectives. I present them together in this article because of the ability to reflect on each case to develop insights into how a commonly used IC measurement can have different meanings in different contexts. In essence, the intertwined reflection about the use of an IC measure in these cases is a serendipitous outcome of my involvement in the projects, thus presenting an opportunity to develop an outcome that is potentially greater than the sum of its parts (Lewis & Grimes, 1999).
Employee turnover is important because most managers I know make a strong argument that their businesses consider high turnover rates to be bad and low turnover rates to be good (Siebert & Zubanov, 2009). Many see this as one way of developing their human capital and may even argue that it was one way of developing competitive advantage and even try to benchmark performance. If a company’s rate is the same or higher than its competition, the company might work hard at reducing the rate below the industry norms (see Westpac Banking Corporation [WBC], 2002).
Employee Turnover at Westpac Bank
The reflections in this section are based on the case study featured in an honors in accounting thesis project I supervised while working at the University of Sydney. In this, case material from Westpac’s publicly available disclosures from its annual and corporate social responsibility reports is used along with press releases and material from the news media. The student completed the thesis in 2010, and I have added additional material and insights from Westpac’s 2011 and 2012 reports.
The following extract from WBC’s (2002) Social Impact Report highlights employee turnover as one of its key human capital management challenges: One key to being an employer of choice is creating conditions where our employees feel fully engaged in our business and successful in their jobs and careers. This is essential if we are to build long-term relationships with our employees. With our employee turnover level currently at 19.5%, broadly in line with industry experience, we know we have more to do. (p. 13)
This was because in 2001, Westpac “openly announced that it was improving its management of HC (human capital) as a result of ongoing dissatisfaction among its internal and external stakeholders which culminated in its employees going on strike in 2001” (Dumay & Lu, 2010, p. 71). The strike was in response to a “disgraceful lack of support” employees had received from Westpac management while making significant profits (“Bank Staff March in Protest,” 2001).
However, Dumay and Lu (2010), when examining HC disclosures by Westpac Bank from 2001 to 2008, found that although turnover rates began to fall, reaching 16% by 2005, by 2008, they had risen to 20%, exceeding the unsatisfactory 2001 rate of 19.5%. In response, Westpac attempted to downplay the fact by using some positive spin on the result as found in its Stakeholder Impact Report (WBC, 2008): In 2008, although our turnover rate remains in line with the industry average we did see an increase from 17% to 20% in Australia. This is mainly due to increases in first year resignations in our retail bank, a trend we are seeking to address . . . In addition, there has been a reduction in back office roles to accommodate more front line positions. Pleasingly, many of these employees have moved into customer facing positions via our active Redeployment Program. Most notable has been an increase in induction training from one to four weeks, also designed to reduce turnover rates within the first year of employment. (p. 17)
I further examined Westpac’s employee turnover rate and found that the rate dropped to 15% in 2009 and then rose back to 17% in 2010 (WBC, 2010). However, I could not find any further disclosures for 2011 and 2012. When I examined the Annual Review and Sustainability Report for those years, it seems the employee turnover rate is replaced with new measures such as employee voluntary attrition, new starter retention, and high performer retention (WBC, 2011, 2012). These new measures seem to be designed to present Westpac in a more positive light as employee voluntary attrition comes in at 11.8% (2010), 11.5% (2011), and 9.9% (2012), far lower numbers than the old employee turnover rates of 17% or more. On the opposite side, new starter retention at 83.8% (2011) and 84.8% (2012), and high performer retention at 95.3% (2011) and 95.9% (2012) are all high numbers, as Westpac tries to signal that these are good numbers (WBC, 2012).
So what is Westpac trying to do by excluding the old employee turnover results from its reports? (I searched its 2011 and 2012 annual reports, and it was not included there either.) A pessimistic view argues that Westpac is attempting to downplay reductions in its workforce, especially since completing its merger with St. George Bank and Bank of South Australia (BankSA) in 2010, which saw total full-time equivalent staff numbers climb to 35,055 at the end of 2010. Since then, Westpac has continued to shed staff to 33,898 in 2011 and to 33,418 in 2012 (WBC, 2012) in line with an expected loss of about 2,000 jobs as foreshadowed when the merger was first proposed (Murdoch, 2008). Thus, the pessimist argues that 2010 Westpac has excess human capital, or human liabilities (not just human assets), that it needs to lose while retaining its human assets. Thus, higher employee turnover rates could now be desirable.
It is important to note that the evidence does not imply that all staff leaving Westpac are human liabilities. On the contrary, evidence from the Australian Financial Markets Association (AFMA; 2011) points to the fact that the majority of people in the financial sector in Australia are voluntarily leaving their jobs because of a lack of opportunities for career advancement or progression, as opposed to being let go because of unsuitability for the role. It is also interesting to note that since 11.5% of staff left Westpac voluntarily in 2011, this would mean more than 3,898 employees left Westpac, almost four times the 2011 reduction in full-time equivalent staff of 1,157, meaning it would need to hire and train another 2,741 new employees.
Therefore, a more optimistic argument is that Westpac found that the old employee turnover measure was not an appropriate measure within the context of what Westpac was trying to achieve. As Westpac indicates in 2008, a major cause of high turnover rates is the resignation of newly hired staff. As a result, Westpac changed not only the way it looked at how it is managing its human capital but also the way it measures human capital. Thus, the new measures are more appropriate to deal with the exodus of employees, which is far in excess of any desired reduction in staff numbers.
Employee Turnover at Lands
The following section presents my reflections of a research project at Lands that I participated in with other researchers, originally as a research assistant, and eventually as the chief investigator, from 2005 to 2010. In this research, we gathered data from observations, semi-structured interviews, internal documents, and annual reports. Lands was a government department in the state of New South Wales managing information about the ownership of land and property. 2 It is another interesting case through which to understand the impact of employee turnover as a measure because it had the opposite problem to Westpac. For many years, Lands experienced lower turnover rates than the public sector averages (Dumay & Rooney, 2011).
Lands, in particular, was subject to new public management reforms. This caused employment numbers in the public sector to shrink (English, Guthrie, & Parker, 2005). Contributing organizational factors include downsizing and employment freezes, preventing younger workers from entering the public sector workforce as they had done in the past (Australian Public Sector Commission, 2003; Kiyonaga, 2004). Thus, Lands was not renewing its employees, preventing the implementation of new technologies and business processes with the potential to contribute to increased efficiencies, as observed by an information technology (IT) manager in 2010: A lot of managers here will only use paper. They’ll only do things the way they’ve always done it. They’re retiring in two years, so they don’t want to hear about it. They don’t want to know about change. They’re not interested. They just want to sit until they retire.
This also highlights how Lands had a more serious problem than trying to manage employee turnover. In 2006, it recognized that more than 30% of its staff was predicted to retire by 2013, as detailed in Table 1. Lands’ management identified that the majority of staff planned to retire at or before 60 because of financial penalties commonly referred to as “the golden handcuffs” associated with their superannuation (retirement plans), whereby “the financial advantages of the schemes and the restraints they impose on employment decisions in order to maximise superannuation payouts,” the “members of these schemes generally retire within a predictable period relating to their age” (Douse, 2006, p. 19). Thus, if Lands did not implement a plan to manage retirements along with natural attrition, changes in demand for Lands services, and changes in technology, it would find itself without enough people with requisite skills to perform day-to-day tasks, as outlined by a divisional general manager (Douse, 2006): This whole process is about ensuring we have sufficient staff with the appropriate skills to provide our vital services to the public and the various industry groups who rely on [Lands]. If we do not embrace this process, we will find ourselves with too few appropriately skilled staff to maintain the viability of this business. (p. 7)
Land and Property Information (LPI) Retirement Forecast 2006-2013.

Source. Douse (2006).
Lands’ problem was not just about replacing the retirees; it also needed to ensure that new employees were trained by the retirees, and the retiree’s knowledge about core systems and processes was preserved. However, the dilemma here was identifying which forms of knowledge are at risk as a senior manager explained that some employees who: . . . have been with the organization for a long time are redundant knowledge and a drag on the business. They are sticking to the way we do things around here. The organization must introduce new knowledge and must shed old, useless knowledge.
However, as Lands implemented its plans to replace impending retirees and train new staff, its turnover rates remained low. For example, as outlined in Table 2, Lands employee turnover rates from 2005 to 2009 were between 5.1% and 7.5% compared with the New South Wales public sector rate of approximately 10% (Department of Premier and Cabinet, 2008). This appears to be the case for two reasons. First, the biggest waves of retirees had not yet retired because by 2010, fewer people had retired than was expected, at about ten as opposed to an expected 35 per year. Even the employees who did retire seemed to want to remain as a finance manager observed in 2010: But I’ve been watching and as fast as they go out the door they’re back in as a consultant, nobody’s left or hardly any.
Lands’ Changing Employee Demographics.
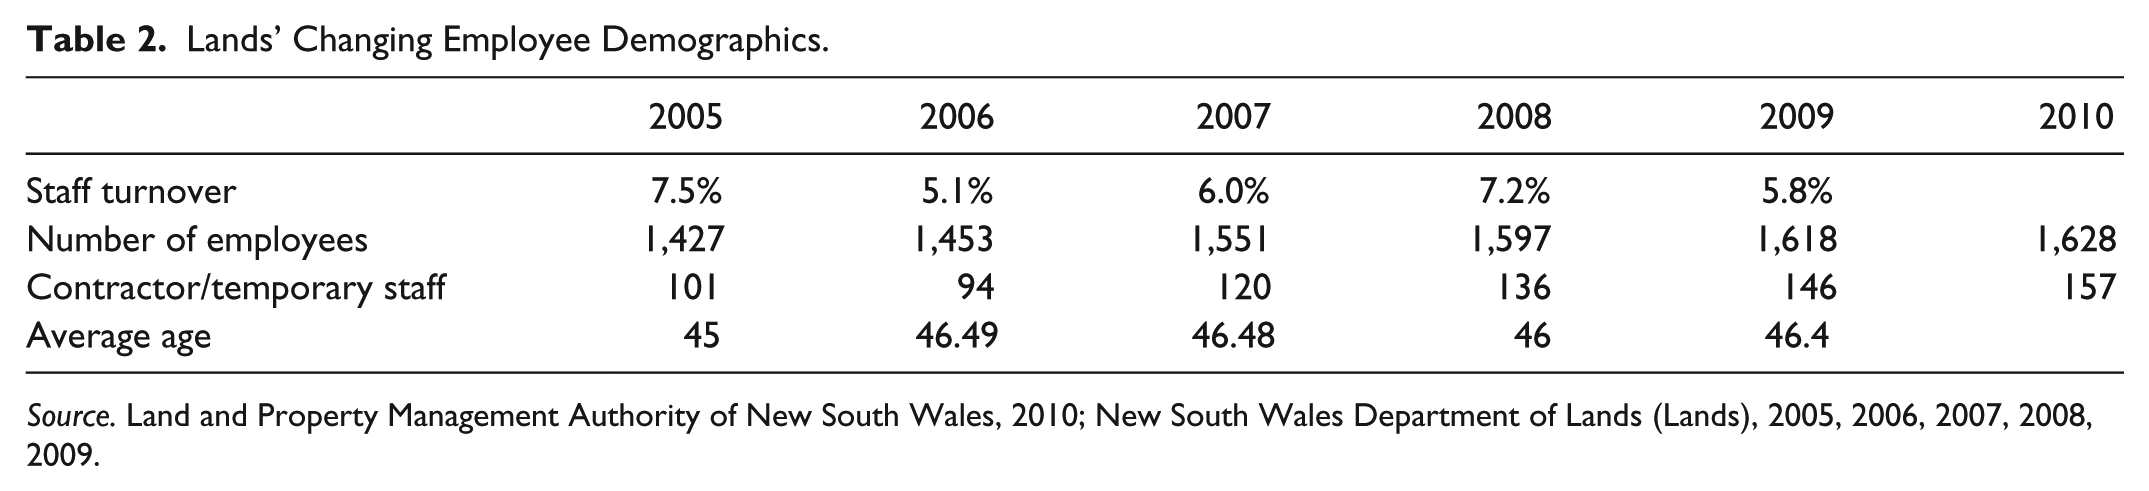
Thus, as shown in Table 2, it is not surprising that the number of employees increased as did the number of contractors and temporary staff whereas the average age of employees increased rather than decreased as would be expected if younger employees came on board as older employees left the organization.
Therefore, the employee turnover rates, although they may seem low, do not reveal the entire story, and it is questionable whether the rates are good, bad, or indifferent. According to one Lands manager, retaining the older retirees was necessary because although many younger employees had joined Lands and had been trained in the technical skills required for their new roles, their lack of experience was still a risk: And just taking that a little bit further, in 80% of the work that you have to do, they pick up so quickly and they can do it better than the originals that you were pointing to. But in those cases, the 20 percent, you really need years of understanding. I’ve made that mistake before. I’ve done this and the other, that’s the bit that some people confuse that they’re absolutely fully competent to do anything. Whereas, some of those more tricky ones, they’ll stumble and fall a little bit at some of those at the edges. As long as you’re wary and the supervisors are wary and understand that they just don’t know everything, not that anybody does, but without the experience of coming across so many tricky, complex bits and pieces, they think that they know it all because they’re younger folks, which is good and bad.
Thus, although it is possible to teach explicit knowledge of how to perform tasks, it is the transfer of tacit knowledge that is difficult and retirees therefore needed to be retained for longer. As a result, the context of employee turnover changed from a low number signifying little organizational renewal because of the inability to renew employees due to political and social pressures influencing a smaller public sector, to a lower number signifying that older workers were retained to help the renewal process.
At the time the research concluded in 2010, I also observed a new challenge facing Lands—how to retain the new, younger employees. Therefore, Lands faced a new employee turnover challenge beyond 2010, being a “crisis of retention” as retirees eventually leave and the new employees were more likely to leave sooner than those they replaced (see Dumay & Rooney, 2011, p. 193). Thus, Lands’ managers were faced with a new business environment context because most Australian employees change jobs on average every 4 years, and it is expected that 75% of employees remain with an employer for less than 5 years (Asquith, Sardo, & Begley, 2008).
Conclusion: Reflections and Implications
To conclude the article, I remind the reader that my motivation for writing this article as a reflective narrative is to tell the story of my experiences so that accountants and non-accountants alike, especially students, can understand the problem of applying numbers to an accounting technology such as IC. As such, I will now discuss how I achieve this from the perspectives of practice, education, and research, followed by a brief discussion about what this means for the future of IC.
IC Practice
From a practice perspective, as I have outlined in the cases of Westpac and Lands, it is possible to take a performance measure such as employee turnover rates and use it to measure something specific, in this case, the number of people leaving the organization every year. However, I argue the way in which employee turnover, and thus any IC element, is measured is problematic from an accounting perspective because each organization is unique and operates in a different context; thus, the comparability of the number from one organization to another, and from one period to another is nearly impossible. I base this conclusion on Robson’s (1992) argument that numbers are abstractions that hide context. Therefore, each time an employee turnover number is produced, it means something different according to its context.
Westpac’s example shows an organization seeking lower employee turnover. Westpac originally wanted to create “conditions where our employees feel fully engaged in our business and successful in their jobs and careers.” (WBC, 2002, p. 13). However, the strategic context of employee turnover constantly changes, as it did in the case of Westpac, which subsequently sought to reduce the overall number of employees after its merger with St George Bank and BankSA. In Westpac’s case, the context changed so much that employee turnover rates have become redundant, and Westpac replaces this KPI with potentially more strategically appropriate measures of voluntary attrition and new starter retention. In Lands’ case, low employee turnover rates up to 2006 prevented the acquisition of new employees and thus prevented the acquisition of new knowledge and skills. By 2010, low turnover rates helped enable the transfer of explicit and tacit knowledge from the impending retirees to newly hired employees.
Therefore, I argue, these examples show how developing balance sheets of intangibles and applying accounting principles to IC is fraught with danger, and managers must realize that a number is not “good,” “bad,” or comparable without considering its context. For example, an ongoing debate in the IC and human resources literature concerns the link between employee turnover and organizational performance with “human capital theory, predicting losses in performance as turnover erodes firm-specific human capital, with cost-benefit approaches predicting an optimal level of turnover maximising the difference between its benefits and costs” (Siebert & Zubanov, 2009, p. 294). Thus, extremely low employee turnover is not desirable because it prevents human capital renewal and prevents new skills and knowledge from entering, whereas high turnover is not desirable due to the cost of recruiting and training new employees. However, evidence from research shows that the “optimum” level of employee turnover is a contentious issue and is dependent on multiple contexts such as industry, skill level required, training and recruitment costs, and part-time versus full-time positions, to name just a few (Siebert & Zubanov, 2009).
IC Education
The above discussion also has implications for IC education as accounting students are first taught the principles of financial accounting prior to being taught how accounting can be used in different contexts, such as management accounting and accounting for IC. However, I am not arguing that we should not teach the rudimentary basics of accounting first as they are an essential precursor to teaching the latter. However, we must be aware as IC educators that IC is not just about valuing, measuring, and reporting IC. Unfortunately, this appears to be almost the default position taken by the creators of most IC frameworks in their attempts to establish an overall dollar value of IC, value IC components, or create IC scorecards (see Sveiby, 2010). However, as evidenced by my Japanese students, the “accountingisation” of IC is so entrenched that it is difficult for them (as well as practitioners) to look beyond accounting for IC to enable it in practice (see Dumay, 2013).
As Habersam et al. (2013) argue, we need to open “up a discussion on understanding [IC] value creation, extending the accounting-oriented agenda . . . towards narratives and visualisations” (p. 320). This is not a new argument as Mouritsen, Larsen, and Bukh (2001) argue that IC requires “narrating, visualising and numbering” (p. 735). However, IC is continually overshadowed by measurement and accountingisation (Dumay, 2009). I saw evidence of this when I recently reviewed a Master’s of Science program in Knowledge Management at another Asian university, which included an introductory course on IC titled Managing and Measuring Intellectual Capital. Within the syllabus, there is no mention of narratives or visualization (although reporting is mentioned) as key aspects of understanding IC.
I argue that we first need to instill in our students that IC is more than just accounting for IC because every time we examine any aspect of IC in an organization, there is a story of what it means and how it can be applied to a specific context to improve its relevance (Dumay & Roslender, 2013). Hence, what is needed is an “organisational narrative of ” IC whereby IC measures are embedded and “success was attributed to managing” IC by “talking IC” rather than measuring it (an elaboration of Power, 2004, p. 779). As evidenced by the two distinctly different narratives about employee turnover at Westpac and Lands, not only did the meaning and context differ between the two organizations, over time, the meaning and context changed within the organizations. Ensuring our students are equipped with an alternative view not based on the accountingisation of IC will hopefully help them leave university and go into their places of employment to apply IC in practice and make a difference (Guthrie et al., 2012; Tull & Dumay, 2007).
IC Research
As researchers, we must also take a step back to review where we are heading with our current IC research agenda because all too often, we get stuck in what Mouritsen (2006) refers to as the ostensive approach to IC, attempting to create all-encompassing IC frameworks. Fortunately, it seems the tide has turned as Guthrie et al. (2012) outline, “The trend to develop new ICA frameworks is waning . . . as more researchers use existing frameworks to frame their research” (p. 77). So rather than conducting research that continues to account for IC, so it can be compared with other past periods or benchmarked against other organizations, we should be developing research based on how IC is applied inside organizations, and what impact it has. To do so, researchers must ask the right questions, rather than just seek the answers.
What Does This Mean for the Future of IC?
Ultimately, reflection on the “accountingisation” of IC must include considering what it means for how we go forward in our thinking about IC. As outlined earlier, looking at how IC creates value inside organizations is the primary reason for managing IC. However, it is important to remember that value is not just financial. For example, people, the environment, and society are also valuable and we should also be looking at IC eco-systems of districts, cities, and nations, which is the fourth stage of IC research (Dumay, 2013; Edvinsson, 2013). This way forward does not rely on taking stock of IC by measuring, but rather tells the story of how IC is useful for society in its broader sense.
This is particularly relevant for the potential for IC to move forward as part of <IR> that takes IC back to the past, where IC once again becomes embroiled in the grand theory about how IC creates financial capital (wealth; Dumay, 2012). Therefore, if we continue to look at IC in organizations from an accountingisation perspective and only try to account for how IC creates wealth, then we will lose sight of how IC creates other forms of value for employees and their families, customers, suppliers, and other stakeholders (Dumay, Guthrie, & Farneti, 2010; Gray, 2006). If we have a too narrow focus on numbers, then we may miss Earth (our organization) being “demolished by the Galactic Hyperspace Planning Council as part of the plans for development of the outlying regions of the Galaxy” requiring “the building of a hyperspatial express route” through our solar system (Adams, 1979, p. 22). This is not a suitable outcome!
This brings me back to Deep Thought’s original answer to“Of Life, the Universe, and Everything” Although it is good to know the answer—in our case, the rate of employee turnover—“once you do know what the question actually is, you’ll know what the answer means” (Adams, 1979, p. 121). Hopefully, IC researchers might discover “The Ultimate Question” of IC numbers sooner than the “ten-million-years” predicted by Deep Thought (Adams, 1979, pp. 121-2) and find that the answer reveals more than just another number. Ultimately, we want to unlock value for us all, not just wealth for investors and companies.
Footnotes
Declaration of Conflicting Interests
The author(s) declared no potential conflicts of interest with respect to the research, authorship, and/or publication of this article.
Funding
The author(s) disclosed receipt of the following financial support for the research and/or authorship of this article: Funding for different elements of the research reported in this artile was provided by the Macquarie Graduate School of Management and the Discipline of Accounting, University of Sydney Business School.