
Abstract
This study is a multivariate analysis of commodities and stock investment in a newly established market scenario. Return distribution asymmetry is examined with higher order movements. Skewness in commodity future’s return is largely insignificant, whereas kurtosis is highly significant for both stock and commodity future contracts. Correlation analysis is done with Pearson’s and Kendall’s tau measures. Commodities provide significant diversification benefits when added in a portfolio of stocks. Compared with stocks, commodity future’s returns show stronger correlation with unexpected inflation. The volatility is measured through Glosten-Jagannathan-Runkle - Generalized Autoregressive Conditional Heteroskedasticity (GJR-GARCH) model and reflects that commodities have inverted asymmetric behavior, that is, more impact from the upward shocks compared with downward. Stocks have asymmetric volatility, that is, more impact from negative shocks compared with positive. Gold has highest inverted asymmetric volatility. Tail dependence, measured through Student’s t copula, shows no combined downside movement. In conclusion, commodity investments provide diversification and inflation protection.
Introduction
Investors’ decisions are based on the analysis of market opportunities that meet their risk–return optimization criteria. Considering this rational behavior of investors, foundations for the mean–variance optimization framework and portfolio diversification were laid in traditional finance theory that gave birth to a trend marked by the development of different risk management models, including Capital Asset Pricing Model (CAPM), Fama-French, and Poster Stemberg to facilitate investors’ decision making and to explore alternatives such as mutual fund, real estate, and commodities. Commodity investments greatly drew widespread attention in periods of high financial markets’ volatility during the 19th century by exhibiting their potential for portfolio diversification and inflation protection. Later, commodity futures contracts were introduced in 1922 when U.S. Congress enacted the Grain Future Act to regulate the pricing seasonality in commodity investments. There are several factors which differentiate price variations in commodities from stock investments such as state of economy, weather conditions, government policies, and facilities of transportation and storage. Commodity futures exchange of Pakistan which was established on May 11, 2007, is currently at an infancy stage with appreciable future growth prospects. Being a new investment avenue, commodity’s investments are perceived to have equity such as returns, diversification, and inflation hedging potential based on previous studies in developed economies. There is a discernible distinction between the dynamics of developed and developing economies (Elder & Jin, 2007; Satyanarayan & Varangis, 1996).
Traditional investments have witnessed many periods of financial turmoil, for example, global financial crisis of 2008, which motivated investors to take refuge in alternative investments including commodities. Since the past one decade, commodities have shown remarkable performance making investors’ preferences shift toward commodity’s investments. Commodities (metal, energy, and agriculture) have long-standing history from consumption and investment perspective as a store of value or to mitigate the risk. Commodities that fall in real assets’ domain have unique tangible features, intrinsic value (roll, convenience, and income yield), and can be used in the production process. However, real assets can be segregated into two broad categories: durable assets that are used in the wealth production process, for example, transport vehicles; and non-durable assets that are consumed in the wealth production process, for example, fuel for transport vehicle. Commodity prices depend on short-term supply and demand factors, for example, high demand for wheat to fulfill current demand of bread. Increasing prices of physical commodities are a source of inflation and thus show correlation with inflation (Bodie, 1983; Elder & Jin, 2007; Gorton, Hayashi, & Rouwenhorst, 2013; Kat & Oomen, 2006). The price of production process comprises wages of laborer, cost of capital and raw material. For a given price of production process, if short-term cost of labor is considered constant and cost of raw material increases, the cost of capital must decrease. Similarly, if the cost of capital increases, the cost of raw material must fall. Thus, commodity prices and capital asset prices are negatively correlated (Daskalaki & Skiadopoulos, 2011; Fuertes, Miffre, & Rallis, 2010; Jacobs, Müller, & Weber, 2010). However, the correlation between commodities and stocks is time-dependent and highly volatile (Creti, Joëts, & Mignon, 2013; Silvennoinen & Thorp, 2013).
Event risk profile of commodities is different not only from each other but also from stock and bonds. Financial assets are claims on real assets or cash flows derived from utilizing the real assets. Nature of these two asset classes (stocks and commodities) is different and the way these are affected by economic variables also varies across the categories (Fuertes et al., 2010). When the business cycle is at its peak, commodity prices tend to be high, reflecting higher demand for raw material. This booming business activity causes interest rates to be high and expectations for growth to slow down causing financial assets to perform poor. Commodities are affected by short-term economic fluctuations, whereas financial assets are affected by long-term growth expectations. Stocks and commodities being exposed to different factors and events also exhibit different return distributions (Kat & Oomen, 2006). Both investments are exposed to extreme shocks reflecting the outlier behavior in the tail where there are more chances of returns falling close to mean and also more chances for returns to be falling far from the mean. Both stocks and commodity investments have a non-linear pattern in returns distributions, which a standard correlation cannot properly account for, especially, when both these are tail-dependent. This tail dependence (Delatte & Lopez, 2013) can have dangerous effects from the portfolio perspective as there are chances that both these investments move parallel creating losses (Börger, Cartea, Kiesel, & Schindlmayr, 2009).
Owing to the complexities in risk–return profiles of stocks and commodities highlighted in above discussion, this study focuses on the asymmetric behavior of returns, strength of relationships, asymmetric volatility and tail dependence of stocks and commodities in a portfolio context. Rest of the study is organized as follows. Section “Data and Method” presents the data and methodological aspects. Section “Results and Analysis” discusses result and analysis, and Section “Conclusion” concludes the study.
Data and Method
Monthly price series of 25 stocks (source: http://www.kse.com.pk/), 3 commodities (in Pakistani rupee [PKR] and U.S. dollar) over a period of September 2004 to August 2012, and 10 commodity future contracts (source: http://www.pmex.com.pk/) from December 2009 to August 2012 are used as a sample for analysis. Details of secondary data with specification are shown in Appendix A. Return
1
is calculated as
With the premise that commodity prices often reflect high upward spike, one may start feeling that commodity spot and futures returns are positively skewed. However, stocks have also reported spike behavior and investors. The following three skewness (Kat & Oomen, 2006) measures are used in this study:


If return distribution tails become fatter, there is more likelihood of loss. Commodities are popular for having frequent and aggressive price roller coaster, therefore they may have high excess kurtosis (EK). EK reflects the probability of intense outcome (Daskalaki & Skiadopoulos, 2011; Roache & Rossi, 2009). Kurtosis I, II, and III (Kat & Oomen, 2006) applied for the analysis are as under:


where
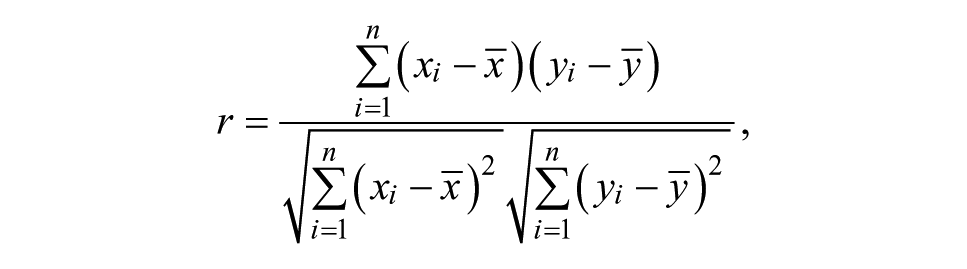
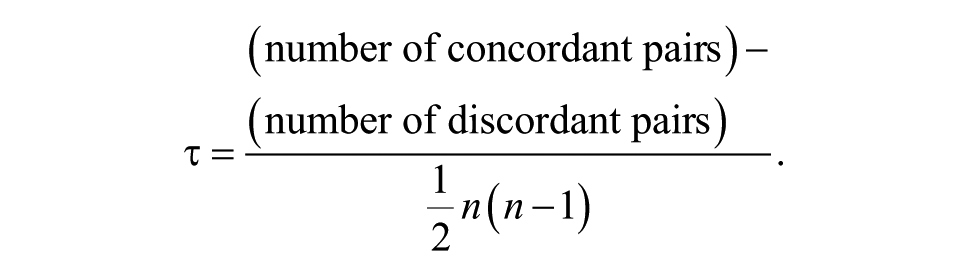
The association of commodities and stocks’ returns with each other and with unexpected inflation is measured with Pearson’s (r) and Kendall’s tau (τ) measures. Later, non-parametric measure is used keeping in view the asymmetric nature of return distribution. Following are the equations for both measures:
Volatility analysis of commodities return is done using minimum, maximum, 2.5 and 97.5 percentiles, annualized standard deviation (
The asymmetric volatility is a market phenomenon and indicates dependence of volatility on up and down market movements. This phenomenon may have been attributed by the volatility feedback, effects of leverage, and psychological attributes that are related with risk/return level in a particular market. It has been extensively examined and confirmed; however, drivers of this phenomenon lack consensus. The Generalized Autore-gressive Conditional Heteroskedasticity (GJR-GARCH) model by Glosten et al. (1993) is used to examine the asymmetric (different impact of good and bad news) volatility of all sample returns. The use of model is motivated by the notion that basic situation is to be studied first before moving into complexities. Asymmetry of volatility along with the above measures will help frame a better picture for investment in commodity spot and futures. The specification of the conditional variance equation is given by

where
Tail dependence of return data is analyzed using Student’s t copula. The Student’s t copula can be written as follows:
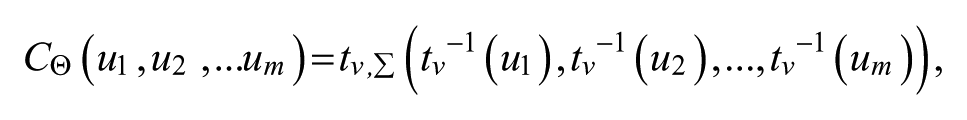
where
Results and Analysis
Skewness pattern for stocks and commodities requires special attention when adding in the portfolio. If mean and variance of portfolio are constant, adding an investment (commodity or stock) with positive skewness will shift median return below the mean. This clustering of returns on the negative side creates undesirable results for the investors when market conditions are stable. Portfolio with positively skewed return will underperform as compared with no or negative skewness. Whereas when market conditions remain volatile, returns of two portfolios will strike a balance. Intuitively, skewness measures whether there is an increased probability of a pleasant (positive skewness) or nasty (negative skewness) surprise. Of course, ceteris paribus, people will prefer positive over negative skewness (Kat & Oomen, 2006). Detailed comparison of skewness and kurtosis measures over long and short time horizon is provided in Table 1. Spot commodity’s returns have significant negative skewness. However, the skewness values are very low and range between 0.68 and −1.35. After adjusting outliers, the spot and future commodities returns are not skewed, consistent with the results of the other two skewness measures. The commodity future contracts show similar results where only one gold contract (Gold Kilo) has high positive Skewness III. Two gold contracts and a silver contract also have low positive Skewness III. Commodity futures results are similar to commodity spot. Given the frequent floods in Pakistan (2007, 2010, and 2011) and resulting increase in agricultural prices due to sharp supply cuts, one may expect high skewness values. However, commodity exposure to positive shocks does not generate positively skewed returns (Kat & Oomen, 2006).
Skewness I, II, III and Kurtosis I, II, III Comparison.

indicate significance at 1% and 5% levels, respectively.
Stocks have the tendency to portray negative skew returns (Bodie, 1983; Elder & Jin, 2007; Froot, 1995). Large cap value stocks have positive skewness where Pakistan Petroleum Ltd. (PPL) has the highest value. Large cap growth stocks report negative skewness. Karachi Electric Supply Corporation (KESC) has very high positive skewness, which is consistent with the conclusion of Shefrin and Statman (2000) and Miffre and Rallis (2006). All commodities-based firm stocks (indirect exposure) also show marginal positive skewness in both long and short time periods.
Kurtosis I, II, and III measures show that commodity futures contracts and stocks have above normal kurtosis. Commodity spot return’s EK is comparable with commodity futures. Gold future contracts seem more prone to severe outcomes. Crude oil future contracts have more chances of extreme events compared with spot oil returns. Stocks have EK but within the range of 0.5 to 4. Commodity futures results indicate higher EK compared with Karachi Stock Exchange (KSE) Index returns in contrast with the results of previous studies (Kat & Oomen, 2006) conducted in well-developed futures markets. Higher sensitivity of commodity futures returns to extreme events, in comparison with stocks and index, in a newly developed futures market indicates that investment attributes depend on the state of market development, storage infrastructure of commodities, and traders’ experience. EK of all stocks is comparable and maximum EK touches the value of 4 over a long period of time. Indirect commodity exposure also shows low EK values.
Commodity or stock investment may seem riskier from a stand-alone perspective, but when added to portfolio, it is the association which matters (Kat & Oomen, 2006). Results of Pearson’s correlation (see Table 2) between different commodities and stocks show weak correlation and even negative in few cases. In commodities, Gold spot shows correlation with silver spot and futures. There is also a very low correlation between crude oil, rice, and wheat.
Summary of Pearson’s Correlation Analysis.
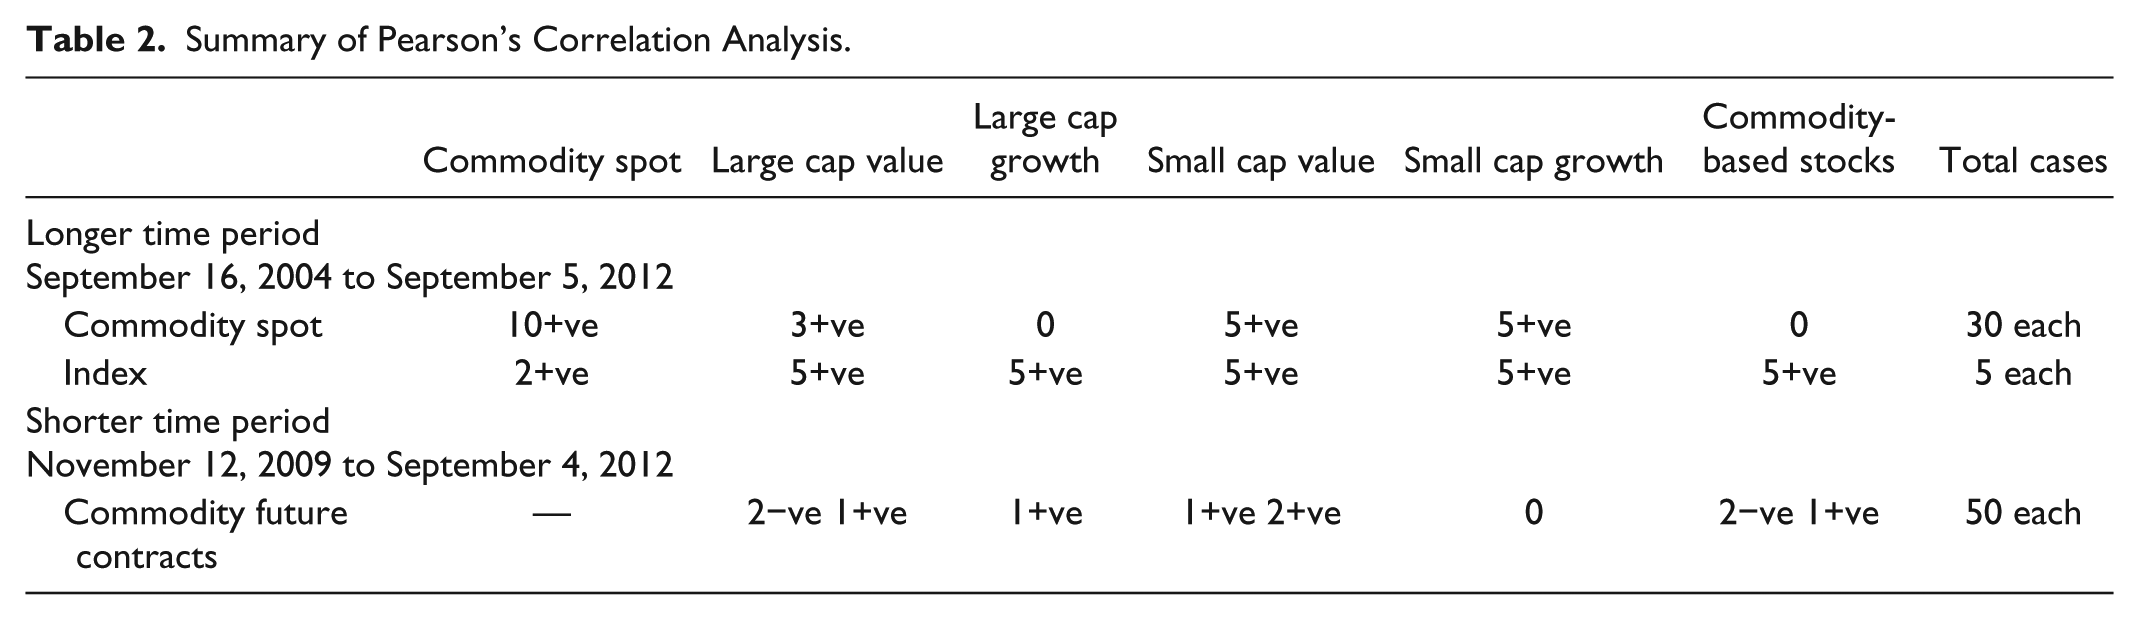
Gold and crude oil futures indicate lowest correlation when measured with Kendall’s τ. Adding stocks to gold and crude further reduces the portfolio’s correlation. Diversification benefits can be enhanced by adding small cap value stocks in a portfolio. Stocks have low correlation with commodity futures compared with commodity spot. Commodities and stocks have low or negative association over a longer period of time compared with short time horizon. Commodity spot and futures contracts show no sign of bondage or movement with KSE 100 index over both long and short time periods. It is also a signal that index investment along with commodities can be a good source of portfolio diversification.
Investment in commodities has the property to protect investors from ravages of inflation. Stocks and bonds have been criticized historically for purchasing power loss. Comparing the data (see Table 3) for long and short time periods reveals that stocks protect investor’s purchasing power over a longer period of time.
Correlation Analysis for Inflation Protection.

Note. Lower italic numbers show Kendall’s tau Correlation. CPI = consumer price index.
Correlation is significant at the .05 level (two-tailed).
Correlation is significant at the .01 level (two-tailed).
Stocks show no sign of inflation hedging for short period of time. All large cap growth stocks have low significant association with inflation over a longer period of time. For short time period, no significant association is witnessed. All stocks show similar results over a longer time period. Only commodity-based firms (NML, ATRL, NFoods, RMPL) have low significant association with inflation for both short and long time periods. Both commodity spot and future returns have high and significant association with unexpected inflation. Commodity futures have out surpassed both commodity spot and stocks inflation hedging property. Within group (metal class), gold has offered more inflation hedging property compared with silver and within gold class, TGold 100 and TGold 50 have strong association with inflation. TGold 50 has the highest Kendall’s τ association within and across commodity groups. Crude oil futures contract has the highest Kendall’s τ association value of .838. Agricultural commodity futures contracts also show medium-level association with inflation where Palmolien has more association compared with rice futures contracts. It shows that agricultural commodity future contracts have low inflation protection property. KSE 100 index and consumer price index (CPI) show weak association. Gold and crude oil futures have strongest Kendall’s τ correlation with inflation and negative association with stocks, which makes them strongest candidate for portfolio diversification and inflation hedging.
According to the theory of storage (Kaldor, 1940), volatility of commodity prices is inversely related to inventory levels. Infrequent price shocks can be balanced with the adequate storage facilities. Storage requirements also differ depending on the nature of commodities. For agricultural commodities, weather conditions play a vital role in supply variation. Floods (2007, 2010, and 2011) in Pakistan are of particular attention in this setting. The volatility analysis of commodity spots and futures is presented in Table 4. In commodity futures contracts, RICEIRRI-6, CRUIDE100, and PALMOLEIN have the highest volatility ratios. Commodity spots volatility ratio with index (
Volatility Analysis.

Note. Ratio all stocks is the ratio of the standard deviation of commodity and the average standard deviation of all 25 stocks selected for the study and ratio index is the ratio of commodity standard deviation and standard deviation of KSE 100 Index.
Asymmetric volatility (last column) in GJR-GARCH model is shown in Table 5. Negative coefficient values imply that downward (negative) surprises demonstrate a lesser force on the volatility than upward (positive) shocks. From another perspective, upward shock of asset classes enhances volatility of asset more than downward shocks. All stocks show asymmetric volatility. Gold and other commodities reflect inverted asymmetry. In the case of commodities, gold has highest volatility (also evident through volatility analysis) along with inverted asymmetry, implying that increase in gold prices has more volatility impact than decrease in price. Baur (2012) argues that this effect is related to the safe-heaven property of gold. The higher gold prices may be considered as an indication of future adverse conditions and uncertainty in other asset markets. This perceived uncertainty by the investors results in higher volatility in gold markets. The inverted volatility effect of gold can lower the aggregate risk of a portfolio for specific correlation levels (Baur, 2012). Traditional use of gold as ornament in Pakistan (inelastic demand) may have also contributed to higher prices during uncertain markets. All commodity spot and futures show similar results with varying magnitude of asymmetric volatility.
Asymmetric Volatility Analysis Through GJR-GARCH Model.

Significant at 1% level.
Tail dependence is examined through Student’s t copula in this study. Tail dependence, from a risk management and portfolio perspective, has captured increased attention of investors and portfolio managers. It helps determine the joint downside movement of two investments when downside risk is concerned. It captures the true behavior, especially when investment returns are not linearly related and their return distributions are not normal. Student’s t copula has a better ability to capture the joint downside, keeping the flexibility of center of the distribution. Commodity futures contracts (gold, crude oil, and rice) have negative tail dependence with each other, which shows no joint downside movement. Other futures contracts show no sign of significant tail dependency, good news from the investor’s risk management perspective. Commodity futures and stocks show no sign of tail dependency for both short and long time periods. Results are in contrast with those of Delatte and Lopez (2013). Comparing commodity spot tail dependence pattern, there are cases where tail dependence is witnessed over the long period. Silver spot and Gold spot show significant tail dependence but with low magnitude. Same is the case with silver and oil. Stocks of different styles reflect significant tail dependency when assessed within category. Large cap value and growth stocks show significant and above medium tail dependency with KSE 100 index, whereas small cap growth and value stocks show below medium tail dependency with KSE 100. Within large cap growth and value stocks, almost all stocks reflect significant tail dependency with each other, while across group tail dependency decreases for small cap and commodity-based firm stocks. Graphs of selected Student’s t copula are provided in Appendix C.
Conclusion
In a multivariate analysis of stocks and commodities, the results of this study indicate that stocks have marginally positive skewness. Stocks’ returns have significant and positive skewness over longer period of time but no or marginal negative skewness over a shorter time period. We may conclude that stocks do not provide better results when investment is made for a short time period. Commodity spot and futures reflect little or no positive skewness after accounting for outliers. Hence, the commodities are not exposed to positive shocks. These results make commodity investment a strong candidate during bad times (bearish market). Both commodities and stocks’ returns have significant fat tails (extreme events) over both short and longer time periods. Commodity futures’ returns have very high EK. Commodity futures EK is comparable with large cap stocks. Indirect commodities’ returns have low EK values and hence make them a strong candidate for risk-averse investors.
The analysis also highlights that the risk–return relation can be changed by adding commodities in a portfolio of stocks. Commodities and stock investments show no association with each other, indicating potential diversification benefits. However, all the commodity futures do not offer same diversification benefits, also highlighted by Faber (2007) and Walton (1991). Commodities spot and futures have strong protection against inflation, a property not found in stocks investments. Gold and crude oil futures show highest diversification and inflation hedging benefits. These results are in line with those of Bodie and Rosansky (1980), Fortenbery and Hauser (1990), Faber (2007), Walton (1991), Satyanarayan and Varangis (1996), Gorton et al. (2013). Stocks have low significant correlation with inflation over a longer period as compared with short time period, a bad sign for investors expecting short-term inflation protection.
Gold has highest inverted asymmetry, while stocks exhibit high asymmetric volatility. The inverted asymmetric volatility of gold and other commodities along with asymmetric volatility of stocks can benefit the investors by reducing overall portfolio risk. The volatility impact is not same for both commodities and stocks. Increased volatility of commodities becomes good news for the investors protecting their wealth in period of uncertainty in financial markets. In a portfolio of stocks and commodities, high volatility of commodities complements the advantageous negative correlation during economic turmoil. These findings are consistent with Baur and Mcdermott (2010), McCown and Zimmerman (2006), and Glosten et al. (1993).
Both commodities and stocks show no sign of tail dependency. Large cap value and growth stocks show significant and above medium tail dependency with KSE 100 index, whereas small cap growth and value stocks show below medium tail dependency with KSE 100. This pattern is appropriate as KSE 100 is capitalization value weighted index and therefore large cap stocks have high impact on the movement of the index than small cap stocks. Commodity future contracts and stocks can be added to portfolio as both these investments are not moving jointly on the downside. The reported results are of Student’s t copula, which may vary if another copula function is applied. Our analysis finds that investment in commodities can be a good diversifier for stocks portfolio and it also protects the purchasing power of investments. However, these findings are subject to change over time.
Footnotes
Appendix A
Details of Sample Selected for Study.
| Investment type | Criteria | Selected stocks and commodities | Stocks’ symbol | Time frame |
|---|---|---|---|---|
| Stocks | ||||
| LCG | Rules 1, 2, and 4 | Unilever Pakistan Ltd | UNILEVER | Long time period from 2004 to 2012 and short time period from 2009 to 2012. |
| Pakistan Telecommunication | PTC | |||
| Engro Corporation Ltd | ENGRO | |||
| Pakistan State Oil | PSO | |||
| Lucky Cement Ltd | LUCKY | |||
| LCV | Rules 1, 2, and 5 | Oil and Gas Development Corporation Ltd | OGDCL | |
| Pakistan Petroleum Ltd | PPL | |||
| MCB Bank Ltd | MCB | |||
| Fauji Fertilizer Corporation | FFC | |||
| Pakistan Oil Fields Ltd | POL | |||
| SCG | Rules 1, 3, and 4 | Karachi Electric Supply Corporation | KESC | |
| Jahangir Siddiqui Corporation Ltd | JSCL | |||
| Adamjee Insurance Corporation Ltd | AICL | |||
| BYCO Petroleum | BYCO | |||
| Fauji Cement Corporation Ltd | FCCL | |||
| SCV | Rules 1, 3, and 5 | Clariant Pakistan | CP | |
| Attock Cement Pakistan Ltd | ACPL | |||
| Askari Bank Ltd | AKBL | |||
| Pakistan Suzuki Motor Corporation | PSMC | |||
| Packages Ltd | PKGS | |||
| CBF | Indirect exposure to commodity prices | Nishat Mills Ltd | NML | |
| Attock Refinery Ltd | ATRL | |||
| Fauji Fertilizer Bin Qasim Ltd | FFBL | |||
| National Foods | NF | |||
| Rafhan Maize Products | RMPL | |||
| Index | Largest stock exchange for inflation hedge test | Karachi Stock Exchange-100 Index | KSE | |
| Inflation | Consumer Price Index | CPI | ||
| Commodity spot | ||||
| Gold | Commonly traded spot commodities. | Gold Prices in Pak. Rupee (PKR) | GOLD | |
| Silver | Silver Prices in PKR and U.S. Dollar (USD) | SILVER | ||
| Currency | Exchange rate direct quotation (PKR/USD) | EX.RATE | ||
| Commodity futures | ||||
| Gold futures | Commodities futures contracts traded on PMEX | 50 Tola Gold | TGOLD50 | Short time period from 2009 to 2012 as PMEX started formal trading in 2007. |
| 100 Tola Gold | TGOLD100 | |||
| 100 Ounces Gold (U.S. dollar) | GO100OZ | |||
| Gold (10 ounces; U.S. dollar) | GO1OZ | |||
| Kilo (1.03264 kg) Gold | GOLDKILO | |||
| Gold (10 g) | MINIGOLD | |||
| Silver futures | Silver (500 ounces; U.S. dollar) | SL500OZ | ||
| Crude oil futures | Crude Oil (100 barrels) | CRUDE100 | ||
| Palm Olien futures | PALM OLEIN (25 metric tonne) | PALMOLEIN | ||
| Rice futures | IRRI-6 Rice (25 metric tonne) | RICEIRRI-6 | ||

Note. Rule 1: Stock has never been delisted; Rule 2: Highest market capitalization; Rule 3: Lowest market capitalization; Rule 4: Low dividend yield, high earning growth rate, and high Price/Earnings (P/E) ratio; Rule 5: High dividend yield, low earning growth, and low P/E ratio. LCG = Large Capitalization Growth Stocks; LCV = Large Capitalization Value Stocks; SCG = Small Capitalization Growth Stocks; SCV = Small Capitalization Value Stocks; CBF = Commodity-Based Firms Stocks; PMEX = Pakistan Mercantile Exchange of Pakistan.
Appendix B
Student’s t copula function to get Graphs in matlab.
Appendix C
Declaration of Conflicting Interests
The author(s) declared no potential conflicts of interest with respect to the research, authorship, and/or publication of this article.
Funding
The author(s) received no financial support for the research and/or authorship of this article.