
Abstract
We employ the SV-TVP-SVAR model to explore the asymmetric spillover effects between Shanghai-Hong Kong Stock Connect capital flows and stock market volatility, as well as the role of investor sentiment. Our findings reveal significant asymmetric spillover effects between Shanghai-Hong Kong Stock Connect capital flows and mainland China stock market volatility, with mainland investors’ sentiment playing a moderating role. Additionally, the first legal case of cross-border manipulation of the Shanghai-Hong Kong Stock Connect has caused mainland investors to distrust the mechanism, subsequently leading to a decline in the mainland stock market index. The increase in the daily limit of Shanghai-Hong Kong Stock Connect has not alleviated mainland investors’ concerns about cross-border capital flow risks, but instead, has led to a negative impulse response of the mainland stock market index to the net capital inflows through Shanghai-Hong Kong Stock Connect.
Plain language summary
We use a model to study how capital flows between Shanghai and Hong Kong affect stock market volatility and the role of investor sentiment. Our research shows that these capital flows have an uneven impact on stock market volatility in mainland China, with investor sentiment playing a key role in influencing these effects. One key finding is that a legal case involving cross-border manipulation of the Shanghai-Hong Kong Stock Connect led mainland investors to lose trust in the system, which caused a drop in the mainland stock market. Additionally, even though the daily limit for capital flows through the Shanghai-Hong Kong Stock Connect was increased, it didn’t ease mainland investors’ concerns about potential risks. In fact, this change led to a negative effect on the mainland stock market in response to capital inflows.
Keywords
Introduction
In April 2014, in order to promote the common development of the stock markets in mainland China and Hong Kong, the China Securities Regulatory Commission and the Hong Kong Securities and Futures Commission issued a joint announcement and decided to approve the Shanghai-Hong Kong Stock Connect (the Stock Connect for short), which was launched by Shanghai Stock Exchange, Hong Kong Stock Exchange, China Securities Depository and Clearing Corporation Limited, Hong Kong Securities Clearing Company Limited. The launch of Stock Connect not only facilitates a higher degree of two-way allocation of domestic and overseas funds in a closed-loop form but also promotes the bi-directional opening and integrated development of stock markets in both regions, enhancing the internationalization of China’s capital markets.
Since the official launch of Stock Connect, the Shanghai Stock Exchange has made several adjustments to the stocks eligible under the Stock Connect, based on the specific circumstances of transactions and new stock listings. According to official data from Hong Kong Exchanges and Clearing Limited (HKEX), As of the first quarter of 2024, the number of target stocks under Stock Connect has increased to 1,443, accounting for 62.49% of the total stocks in the Shanghai Stock Exchange for the same period. As time progresses, trading through Stock Connect has become increasingly active, with its transaction volume showing a significant rising trend as a proportion of the total daily transaction volume in the Shanghai Stock Exchange, and it exhibits quite distinct time-varying characteristics. As of March 31, 2024, the net capital inflows of Stock Connect reached 1.4 trillion yuan, far exceeding the total investment quota initially set by regulatory authorities during the pilot phase. As of October 31, 2023, the average daily trading volume of Stock Connect reached $4.44 billion, accounting for 11.79% of the average daily trading volume of the Shanghai stock market during the same period.
At present, the Stock Connect has become an important force affecting China’s stock market. The mainland stock market volatility is also a key factor affecting the capital flow of Stock Connect. However, the mainland stock market is dominated by retail investors, whose buying and selling decisions are largely based on closely monitoring various market news and movements of different types of funds. The trends of foreign investment have always been a key indicator closely watched by these retail investors. The two-way flow of the Stock Connect amplifies the volatility of the A-share market. The short-term rapid inflows and outflows of foreign capital can easily trigger herd behavior among retail investors, thereby exacerbating market fluctuations. Once international capital suddenly withdraws, it may trigger liquidity risks, leading to flash crashes of individual stocks. Therefore, the resonance between cross-border capital anomalies and retail investor behavior, which may trigger systemic risks, has attracted the attention of the academic community (Fan & Wang, 2017; Hui & Chan, 2018; Gu & Yao, 2022).
However, the existing literature focuses on the linkage and integration effect of Stock Connect on the stock markets in both regions and the possible accompanying financial risks. The mechanisms of the interplay among the Stock Connect, investor sentiment, and stock market volatility have not yet been systematically studied, particularly the asymmetric spillover effects between Stock Connect capital flows and the mainland stock market volatility. Secondly, existing investor sentiment measurements rarely directly analyze investors’ stock reviews and transaction records from the perspective of individual investors, and are separated from China’s large number of small and medium-sized investor groups. There is currently no widely recognized Chinese financial sentiment dictionary, which greatly restricts investor sentiment measurement based on Chinese financial sentiment analysis. Finally, the existing literature does not consider the dynamic correlation among the net capital inflows of Stock Connect, investor sentiment index, and SSE 50 Index, nor does it use a model with stochastic volatility, from the perspective of investor sentiment, to examine the mutual spillovers between Stock Connect capital flows and stock market volatility at different times and during various events, also their intertemporal time-varying characteristics.
Based on the analysis above, we combine investor sentiment to explore the asymmetric spillover effects of Stock Connect capital flows and stock market volatility. Firstly, we constructed a Chinese Colloquial Financial Sentiment Dictionary based on stock forum comment texts through manual screening and the word2vec algorithm expansion and calculated the investor sentiment index. Afterward, we used the stochastic volatility time-varying parameter structure vector autoregressive model (SV-TVP-SVAR model) to empirically test the dynamic correlation between the net capital inflows through Stock Connect, the investor sentiment index, and the SSE 50 index. Finally, we provide specific policy recommendations for improving China’s cross-border capital flow management.
Our marginal contributions include the following three points: (1) We introduced investor sentiment, sorted out the theoretical relationship between Stock Connect capital flows, investor sentiment, and mainland stock market volatility, and systematically studied the asymmetric spillover effect between the Stock Connect capital flows and mainland stock market volatility, which expands research on China’s cross-border capital flows. (2) Through manual screening and word2vec algorithm expansion, we analyzed all the comment text of the Shanghai Composite Index Stock Forum and Shenzhen Stock Exchange Component Stock Price Index Forum from Eastmoney, and constructed a Chinese Colloquial Financial Sentiment Dictionary, in order to calculate the investor sentiment index. This method can improve the authenticity and timeliness of the index and better capture investors’ perceived sentiments about financial and economic risks. (3) We use the SV-TVP-SVAR model to explore the dynamic correlation between the net capital inflows of Stock Connect, the investor sentiment index, and the SSE 50 Index, as well as the mutual influences of Stock Connect on the mainland stock market volatility at different times and during various events. This analysis aims to examine the asymmetric spillover effects between the Stock Connect capital flows and mainland China stock market volatility, as well as their intertemporal time-varying characteristics.
2024 is the 10th anniversary of the launching of Shanghai-Hong Kong Stock Connect. For the first time, we have studied asymmetric spillover effects between the Stock Connect capital flows and mainland China stock market volatility based on investor sentiment, which is of great significance in promoting the mature development of China’s capital market. The academic significance lies in the fact that we have extended the relevant theories, providing a new perspective for the study of the relationship between capital flows, market volatility, and investor sentiment in the context of capital market liberalization. The practical significance lies in the fact that we can help investors grasp market dynamics and optimize their investment portfolios based on the relationship between capital flows and market volatility, as well as changes in investor sentiment, thereby avoiding risks. At the same time, it provides decision-making support for regulatory authorities, enabling them to strengthen the supervision of the Shanghai-Hong Kong Stock Connect and maintain market stability.
Literature Review
Theoretical Overview
The characteristics of short-term capital flows under the Stock Connect mechanism are significantly consistent with the portfolio balance theory proposed by Markowitz (1952), which is manifested in that international investors continuously adjust their allocation of A-share assets based on the dynamic optimization of the risk-return ratio. Under the market segmentation theory framework of Errunza and Losq (1985), the Stock Connect has significantly mitigated the degree of segmentation between the A-share and Hong Kong stock markets by effectively reducing institutional investment barriers, thereby systematically altering the pathways and scale of cross-border capital flows. From the perspective of behavioral finance, the investor sentiment theory of Baker and Wurgler (2006) demonstrates that international capital flows significantly influence domestic investors' decision-making through sentiment contagion mechanisms, thereby amplifying or dampening market volatility. Furthermore, grounded in the herding effect theory of Bikhchandani et al. (1992), Stock Connect capital—often perceived as smart money due to its informational advantage—can trigger imitation effects among domestic institutional investors through its trading behavior. From the perspective of market microstructure theory, Kyle’s (1985) information asymmetry model reveals that foreign institutional investors' informational advantages may transmit market signals through trading activities, thereby exacerbating price volatility. However, the liquidity spiral theory proposed by Brunnermeier and Pedersen (2009) demonstrates that rapid withdrawals of international capital may trigger sudden liquidity dry-ups in markets, ultimately leading to nonlinear surges in volatility.
Shanghai-Hong Kong Stock Connect and Stock Market Volatility
The Stock Connect is an innovative strategic initiative that attracted widespread attention and in-depth research by domestic scholars right from its inception. Some scholars believe that the launch of Stock Connect not only facilitated the convergence of the premium rates of the mainland stock market and Hong Kong stock market (Fan & Wang, 2017), but also strengthened the integration of the stock markets in both regions (Hui & Chan, 2018), reduced the heterogeneity volatility of stock price (Gu & Yao, 2022; Zhang & Li, 2018), and increased the information content of the target stocks (Li et al., 2022). Moreover, it enhanced the linkage effects and bi-directional spillover effects between the two stock markets to a certain extent (Cheng et al.,2019; Pan & Chi, 2021; Zhang et al., 2022), leading to a notable trend of value regression in the mainland stock market (Huo & Ahmed, 2017). In contrast to the aforementioned findings, studies by Ma et al. (2019) and Li and Chen (2021) reveal that the Stock Connect has not enhanced the level of integration or co-movement effects between mainland Chinese and Hong Kong stock markets.
Later, some scholars demonstrated the announcement effect, corporate governance effect, and inter-industry volatility spillover effect of Stock Connect (He et al., 2023; Yang et al., 2022), as well as the impact on the stock price effectiveness and volatility (Cheng et al., 2017; Meng et al., 2023). Researchers believe that from the perspective of corporate behavior, Stock Connect will enhance the guiding role of stock prices in corporate investment (Wang, 2021) and promote companies to increase cash dividend levels (Wang, 2020). Some scholars have studied the role of Stock Connect in promoting the opening up of China’s capital market and the internationalization of the RMB (Li & Xu, 2022), believing that Stock Connect will have a profound impact on Cross-border capital flows under China’s capital projects (Wang et al., 2017). Some also point out the potential risks that may be associated with them (Bian et al., 2023; Wu et al., 2021).
Investor Sentiment Measurement
In terms of investor sentiment measurement, many domestic and foreign scholars have conducted multi-angle research on investor sentiment. With the development of theoretical technology, constructing investor sentiment index has become the most mainstream measurement method at present. Researchers use different algorithms to analyze data containing investor sentiment information to quantify investor sentiment. Existing measures of investor sentiment mainly include direct measurement methods and indirect measurement methods.
The direct measurement method refers to a method of analyzing and quantifying text data from stock reviews that can directly reflect investor sentiment. It mainly uses machine learning algorithms and text analysis technology. Yin et al.(2022) constructed investor sentiment factors by extracting the daily occurrences frequency of words such as “bull market” and “bear market” in Chinese Internet. Jiang et al. (2019) constructed the first Chinese financial emotion dictionary in China through word frequency analysis and studied the significant impact of media emotions on stock returns.
The indirect measurement method refers to using financial indicators that can reflect the market environment to replace investor sentiment. In the early stage, a single indicator method was mainly used. For example, Lee et al. (1991) used closed-end fund discount rates that were significantly related to investor sentiment to construct an investor sentiment index. Later, the composite indicator method was derived that can measure investor sentiment more comprehensively and has more sufficient information advantages. For example, Baker and Wurgler (2006) and Huang et al. (2015) selected a series of indicators related to the stock market to construct a comprehensive index of investor sentiment. At present, Chinese scholars mostly select indicators such as the average financing balance of the stock market range, stock turnover rate, and excess returns of individual stocks, and use principal component analysis and partial least squares methods to construct a comprehensive index of investor sentiment (Kumari & Mahakud, 2016; Lan et al., 2021; Wu et al., 2017).
The research framework is structured as follows: Section “Mechanism Analysis” conducts mechanism analysis, focusing on how Stock Connect capital flows affect China’s stock market volatility through the mediating factor of investor sentiment. Section “Model Design” elaborates on the SV-TVP-SVAR model design. Section “Variable Selection and Data Description” details variable selection and data description, with particular emphasis on measuring investor sentiment using the Chinese Colloquial Financial Sentiment Dictionary. Section “Empirical Analysis” presents empirical findings. Section “Conclusion and Policy Recommendations” concludes with policy implications. Section “Limitations and Potential Directions for Future Research” presents the limitations and potential directions for future research.
Mechanism Analysis
We introduce Chinese investor sentiment to delineate the theoretical relationships among Shanghai-Hong Kong Stock Connect capital flows, fluctuations in the Chinese stock market, and investor sentiment. This also represents an innovation in our study, as we expand the research in the field of cross-border capital flows in China.
Positive Spillover: Stock Connect Inflows Drive Up Mainland Stock Prices
When the Stock Connect experiences large-scale capital inflows, domestic investors interpret this as strong international recognition of the value of Chinese assets. The influx of foreign institutional capital not only brings direct incremental funding but also signals optimistic expectations regarding the robustness of China’s economic fundamentals and the favorability of its policy environment. Such expectations significantly bolster domestic investor confidence, leading to a notable increase in risk appetite (Wang & Chen, 2020). Driven by optimistic sentiment, domestic investors accelerate their market participation, creating strong buying pressure by chasing rising stocks and increasing portfolio allocations. This fuels a rapid surge in mainland stock prices. Thus, Stock Connect capital flows generate a positive spillover effect on mainland market volatility through the mediating role of investor sentiment, forming a virtuous cycle of capital inflows→sentiment heating up→stock price appreciation.
Negative Spillover: Fluctuations in Mainland Stock Markets Trigger Capital Outflows from Stock Connect
When prices in the mainland stock market continue to rise, market sentiment gradually shifts from rational optimism to irrational exuberance, and herd behavior begins to dominate. Influenced by short-term upward trends, domestic investors blindly follow the crowd in chasing rallies, driving stock prices away from their intrinsic values and creating valuation bubbles. Such speculative excess is keenly identified by foreign investors as a sign of escalating risks (Kashyap, 2016). Out of concern for potential valuation corrections and the need to protect investment returns, capital flowing through the Stock Connect may choose to sell at peaks. Once foreign capital begins selling off and a downward trend in stock prices emerges, panic sentiment spreads rapidly through the market, prompting more domestic investors to join the sell-off, thereby exacerbating market volatility. The intensification of market fluctuations, in turn, reinforces the outflow tendency of Stock Connect capital, creating a vicious cycle of rising stock prices→overheating sentiment→capital outflows→heightened volatility. Ultimately, this leads to a negative spillover effect, where fluctuations in the mainland stock market adversely impact Stock Connect capital flows.
Model Design
Since Sims (1980), vector autoregressive models have been widely used in the field of macroeconomics, but their explanatory power is greatly constrained by the assumption of fixed parameters. Subsequent scholars improved this shortcoming. For example, Cogley and Sargent (2001) used the VAR model of coefficient drift for analysis but restricted the evolution of variance and covariance. Cogley and Sargent (2005) further extended the model to drift coefficients and time-varying variances but still assumed that the synchronous relationship between variables is constant. Until Primiceri (2005) developed the VAR series model into an SV-TVP-VAR model that allows the intercept term, coefficient, variance and covariance terms to change with time and then the SV-TVP-VAR model in which the coefficients and variances are all time-varying is widely used in macroeconomics research.
The construction of the SV-TVP-SVAR model is based on the SVAR model. The SVAR model can be expressed as Formula (1).

where

We assume that the coefficient matrix

By integrating the above formulas, Formula (1) can be rewritten into a simplified VAR model, as shown in Formula (4).

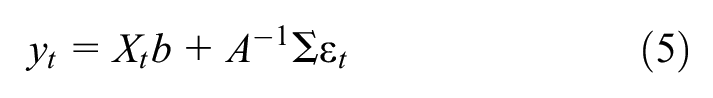
At this time, the parameters in Formula (5) do not change with time. In order to build the SV-TVP-SVAR model, we need to rewrite Formula (5) into the form of Formula (6).
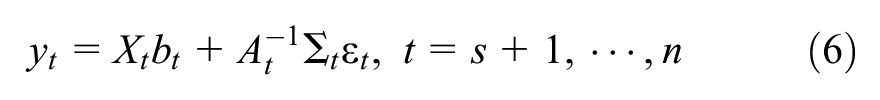
In Formula (6),

Since there are many parameters that need to be estimated, it is difficult to give exact analytical expressions for the estimation of some parameters. Therefore, it is very difficult to apply the traditional likelihood function estimation (MLE) method for parameter estimation. To address this difficult problem, it is common to use Markov Chain Monte Carlo (MCMC) simulations within the Bayesian framework to estimate parameters. Applying this method can not only achieve accurate estimation of parameters but also achieve consistent estimation of state variables.
Commonly used methods in the MCMC method include Metropolis sampling, Metropolis-Hasting sampling, and Gibbs sampling. Among them, since Gibbs sampling only needs to know the marginal probability density distribution of the parameters, the posterior distribution can be obtained, and then cyclic sampling can be performed to obtain the Markov chain of the parameters. Generally speaking, the marginal distribution is relatively easy to obtain, so the Gibbs sampling method is widely used. Since Gibbs sampling is based on the posterior distribution, this sampling method is a Bayes inference method. Because it can update parameters in real-time based on new data, the MCMC inference method under the Bayesian framework is increasingly used in macroeconomic research.
In order to apply the Gibbs sampling method, we need to assign the initial value of the parameter. For this, we let


Variable Selection and Data Description
Measurement of Shanghai-Hong Kong Stock Connect Capital Flows (HGT)
Compared with “daily capital purchases” and “daily capital sales” of Stock Connect, “daily net capital inflows” can more comprehensively reflect the investment trends and strategies intentions of foreign institutional investors, which has become one of the important indicators that mainland investors pay close attention to. Therefore, we refer to Guo et al. (2024b) and select the daily net capital inflow as the proxy variable for Stock Connect capital flows. The inflow here refers to the funds flowing from the Hong Kong stock market into the mainland stock market. The net inflow of funds on the day = the amount of buying transactions—the amount of selling transactions.
Measurement of Investor Sentiment (ISI)
Based on the Chinese Financial Sentiment Dictionary by Jiang et al. (2019) and Guo et al. (2024a), we Innovatively constructed a Chinese Colloquial Financial Sentiment Dictionary based on stock forum comment texts and subsequently calculated an investor sentiment index from it. Stock forum is a stock exchange platform with Chinese characteristics. It is an online space with retail investors as the main participating group, sharing investment experience, and expressing thoughts. The daily comments text of the stock forum comes directly from retail investors and can better represent the sentiment changes of Chinese retail investors. Our text data comes from the Shanghai Composite Index Stock Forum and Shenzhen Stock Exchange Component Stock Price Index Forum in Eastmoney. Eastmoney is a professional comprehensive Internet wealth management operator in China, providing Internet-based financial information, data, transactions, and other services to a large number of users. Stock forum collects all comments posted by retail investors from January 1, 2010, to March 31, 2024, and the data is updated in real-time. In the end, a total of 6.71 million stock reviews were collected (6.26 million on the Shanghai Composite Index Stock Forum and 450,000 on the Shenzhen Stock Exchange Component Stock Price Index Forum). This amount of data can satisfy research needs.
Construction of Chinese Colloquial Financial Sentiment Dictionary
We first analyzed word frequency on all the collected comment texts and selected emotional seed words and then used the word2vec deep learning algorithm to find similar words to the seed words. After manual verification, a Chinese Colloquial Financial Sentiment Dictionary was established by removing duplicates from the Chinese Financial Sentiment Dictionary constructed by Jiang et al. (2019).
In terms of selecting emotional seed words, since the analyzed texts are stock comments posted by retail investors and are informal texts with a high prevalence of colloquial emotional expressions and internet slang, we processed all collected stock comments data using the Jieba Vocabulary for word segmentation in order to accurately analyze the sentiment index of retail investors. After removing Chinese stopwords (including meaningless words and punctuation marks), we analyze word frequency by year and manually selected seed words. The Jieba Vocabulary is a widely used Chinese word segmentation library in Python. The principle of word segmentation in the Jieba Vocabulary involves using a Chinese vocabulary to compare the content to be segmented with the whole vocabulary. It finds the most probable word combinations through graph structures and dynamic programming methods.
The purpose of manual verification involves three aspects: First, to filter out vocabulary that has emotional tendencies and is related to finance, such as “bullish” and “bearish.” Second, select colloquial and finance-related terms, such as “green,” and “run.” Third, to identify words that do not have emotional connotations in the dictionary but have been given special emotional meanings related to finance due to the evolution of the times and the influence of the online environment, such as “trapped” and “leek.” In terms of dictionary expansion, we use the deep learning algorithm Word2vec to train the selected seed words, calculate the word similarity to obtain words that are highly related to the seed words, and operate manual verification again to select the final results and construct a Chinese financial sentiments dictionary. The Word2vec algorithm uses the idea of a neural network to convert words into vectors containing their word information through training and calculate the similarity of words based on this. This model includes the Skip-gram model and the CBoW model. The Skip-gram predicts the adjacent words above and below the text based on the target word while the CBoW model predicts the target word based on the text context, as shown in Figure 1.
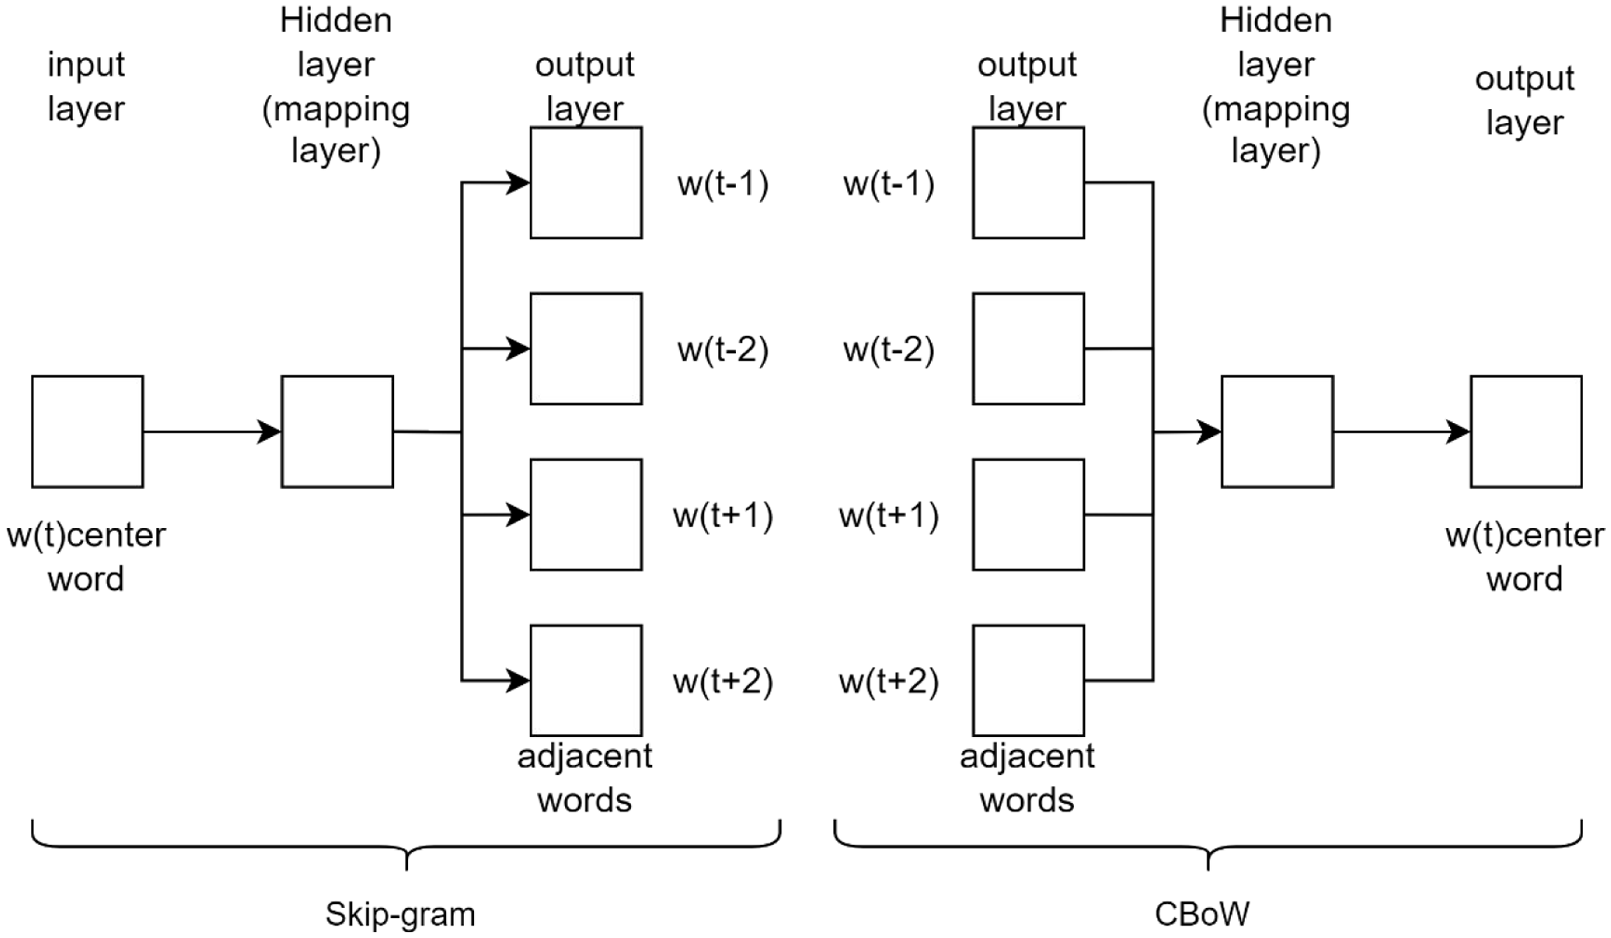
Schematic diagram of Word2vec.
After manually verifying the sentiment classification of each new word, we added a total of 298 emotional words based on the Chinese Financial Sentiment Dictionary by Jiang et al. (2019), including 162 negative words and 136 positive words. The final Chinese Colloquial Financial Sentiment Dictionary includes 3,474 positive words and 6,052 negative words.
Calculation Method of Investor Sentiment Index
Due to the presence of negations, double negations, and even triple negations in Chinese grammar, we have constructed three lexicons for calculating sentiment indices: negation words, positive words, and negative words. First, we remove the Chinese stopwords from the collected stock comments and then use the Jieba Vocabulary for word segmentation. Next, we use three lexicons to filter out all negative and emotional words and arrange them in order. Then, we assume that each emotional word is only influenced by the negative words between this emotional word and the previous emotional word, and we form an emotional unit with negative words between each emotional word, as shown in Figure 2.

Schematic diagram of emotional unit.
Finally, we give positive words a score of 1, negative words a score of −1, and negation words an influence weight


Measurement of Mainland China Stock Market Volatility (SMV)
We conducted statistics on the top 10 most active stocks in daily Stock Connect transactions and found that Stock Connect investors prefer blue-chip stocks from the Shanghai Stock Exchange, and active stocks in Stock Connect transactions showed a clear trend of concentration. Among them, the purchases and sales of the top ten most actively traded stocks in Stock Connect accounted for 37.84% and 38.85% of the total purchases and total sales respectively. Therefore, compared with other stock indexes, Stock Connect has the most significant impact on the Shanghai Stock Exchange 50 Index (short for SSE 50 Index), which is mainly composed of blue-chip stocks from the Shanghai Stock Exchange. Therefore, we refer to Xie et al. (2023), and select the SSE 50 Index as a proxy variable for mainland China stock market volatility.
Data Description
Among the above three variables, the investor sentiment index, and the SSE 50 Index belong to the concept of stock, while the daily net capital inflows of Stock Connect belong to the concept of flow. Therefore, we accumulate the daily net capital inflows and convert them into the net capital inflows from Stock Connect. At the same time, we converted Stock Connect net capital inflows (HGT), Investor Sentiment Index (ISI), and SSE 50 Index (SMV) from daily data to monthly data. The sample testing range is from November 17, 2014, to March 31, 2024, and the sample size was 113. In addition, in order to reduce the volatility of time series data and obtain relatively small regression residuals, we perform logarithmic processing on the three variables respectively. The data we use are all from the WIND database.
Empirical Analysis
Stationarity Test
Whether time series data is stationary often leads to different empirical results. Non-stationary time series data have different random patterns at each time point. Therefore, it is difficult to accurately predict the overall randomness of the time series based on the known information of the time series. Before testing the mutual influence between Stock Connect net capital inflows (HGT), Investor Sentiment Index (ISI), and SSE 50 Index (SMV), it is necessary to conduct a stationarity test on these variables. We use the ADF to test these three-time series variables, and the test results are shown in Table 1. As can be seen from Table 1, HGT, ISI, and SMV are stationary at the 1%, and 5% significance levels respectively.
Variable Stationarity Test.

Note. C, T, and L respectively represent the intercept term, trend term, and lag term in the ADF test. 0 means there is no such term.
*** and ** represent 1% and 5% level respectively.
MCMC Simulation Results
We use Markov Chain Monte Carlo, MCMC to estimate the parameters and set it to 20,000 times. Since the sampling results before convergence do not belong to a stable distribution when using the MCMC algorithm for sampling, we discard the first 2,000 times, that is, the sampling data in the burn-in process.
Table 2 describes the estimation results of the parameters, including the mean, standard deviation, lower and upper bounds of the 95% confidence interval, Geweke convergence diagnostic statistic, and the number of invalid factors of the parameter posterior distribution. It can be found that the Geweke statistics of the six estimation results are significantly lower than 1.96, so the null hypothesis that “the sampling results converge to the posterior distribution” cannot be rejected. It can be seen from the estimation results of the invalid factor column that only sh1 and sh2 have higher invalid factors, exceeding 80. However, about 240 unrelated sampling samples can still be obtained in 20,000 samplings, which is enough for posterior distribution fitting, also further verifying the rationality of the Geweke test.
Regression Results of SV-TVP-SVAR Model Parameters.
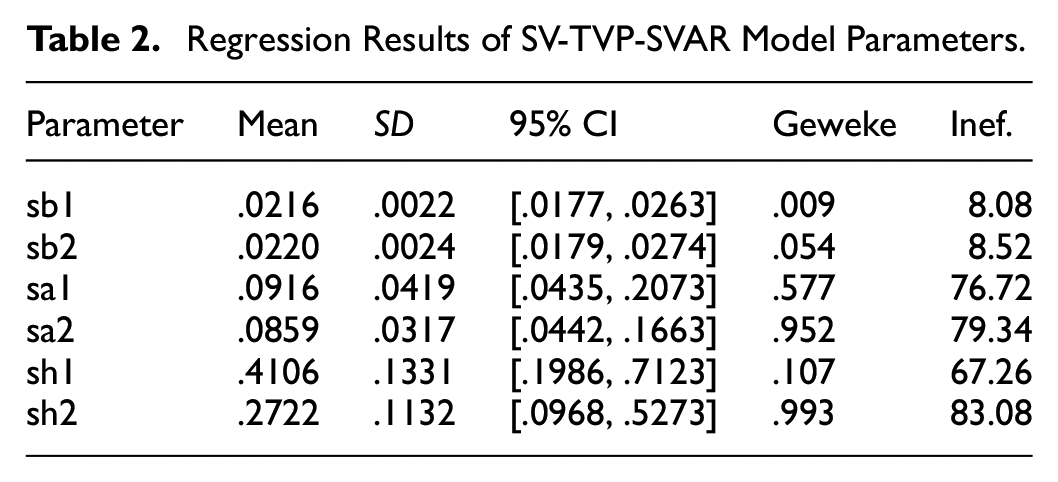
Figure 3 depicts the sample autocorrelation diagram (top), sample simulation path diagram (middle), and fitted posterior distribution density function (bottom) of some parameters in the SV-TVP-SVAR model. It can be seen from the figure that the autocorrelation of the parameters quickly converges to 0. The autocorrelation coefficients of sb1 and sb2 decrease the most rapidly, while the autocorrelation coefficients of sh1 and sh2 decrease significantly slower than those of other variables, corresponding to the results in Table 2 which show that sh1 and sh2 have the largest inefficacy factors among the sampled variables.

Estimation results of SV-TVP-SVAR model parameters.
It can be seen from the sample simulation path diagram that the concentration of the six sampling path diagrams is relatively high, which means that the frequency of extreme values in the six parameter sampling paths is not high, reflecting that the parameter sampling path is relatively stable. It can be seen from the posterior distribution density function diagram that, except for sa1 and sa2, the density function diagrams of the other four parameters are similar to the normal distribution. Combined with other judgment conditions, it can be seen that the difference between sa1(sa2) and the normal distribution does not affect the validity of parameter sampling results. That is, the density functions of sa1 and sa2 can also be regarded as approximately normal distributions.
Analysis of Time-Varying Parameter Characteristics
Compared with the traditional VAR model with constant parameters, the estimated value of each parameter in the time-varying parameter VAR model changes with time, so these time-varying parameters appear as several trend curves that change with time.
Analysis of Time-Varying Characteristics of Variable Stochastic Volatility
Figure 4 reflects the time-varying characteristics of the stochastic volatility of the three variables of Stock Connect net capital inflows (HGT), Investor Sentiment Index (ISI), and SSE 50 Index (SMV).
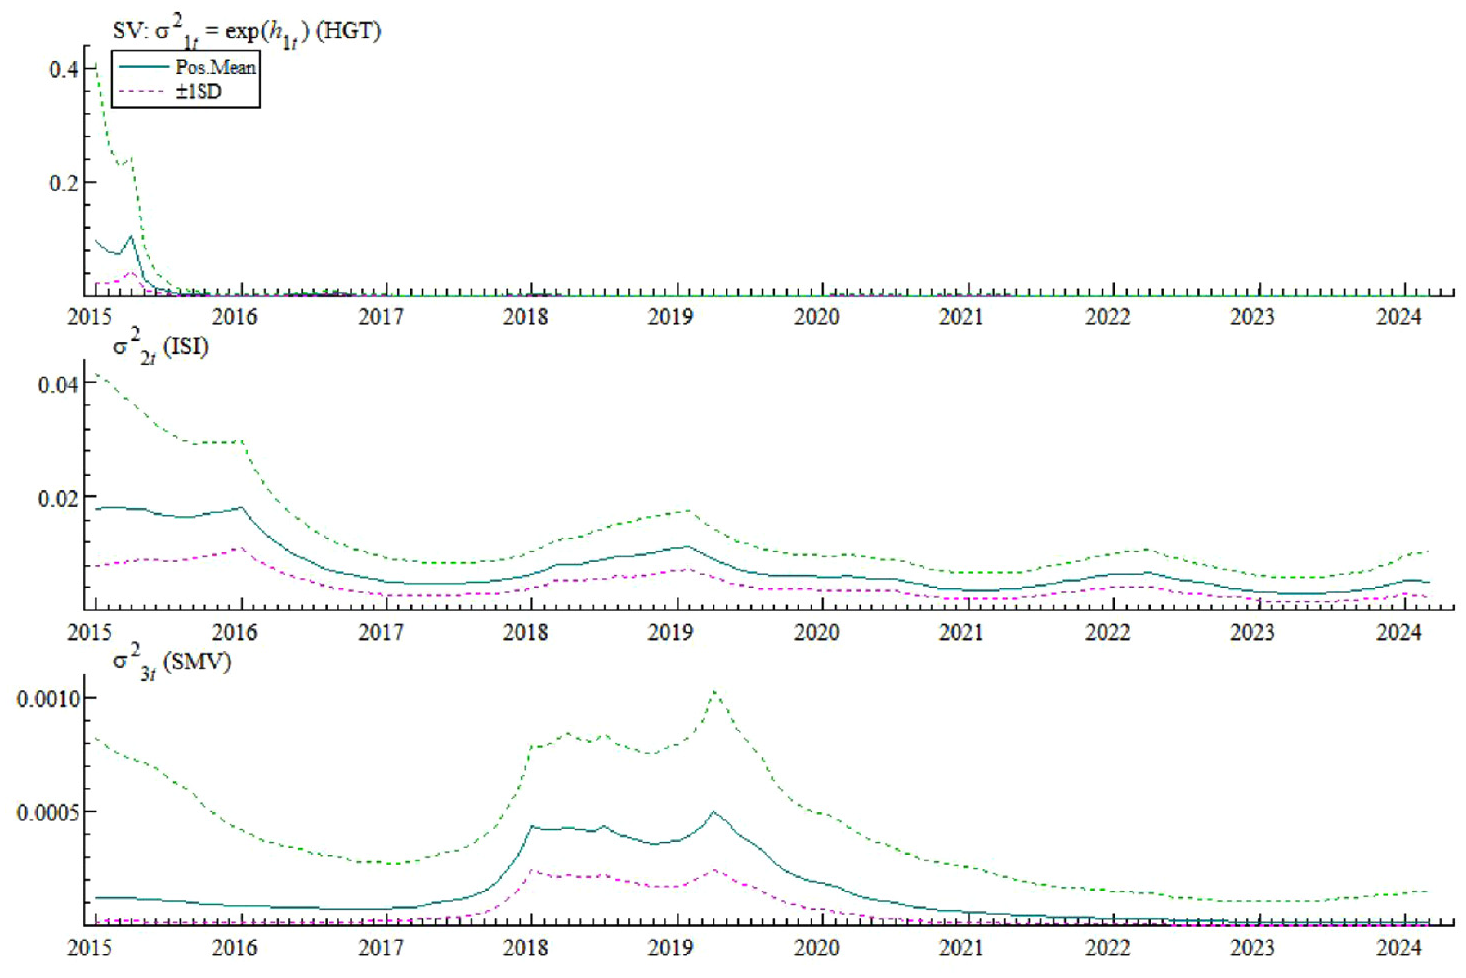
Time-varying characteristics of stochastic volatility of model structure shocks.
As can be seen from the first subgraph, the stochastic volatility of HGT was positive on the day of its opening. This is consistent with the historical fact that the investment limit of 12 billion yuan for Stock Connect was used up on the day of its opening. Three months later, the mainland stock market experienced a sharp rise. Stock Connect funds showed obvious characteristics of large inflows and outflows, and its random volatility also increased rapidly, reaching its highest point in June 2015. Afterward, the mainland stock market experienced two rounds of sharp declines. Investors’ enthusiasm for Stock Connect began to cool down, and its stochastic volatility also began to decline, and it is still hovering at a low level.
As can be seen from the second subgraph, the ISI reached its highest point after the launching of Stock Connect. However with the arrival of the bear market, the investor sentiment index rapidly declined and experienced a mild oversold rebound trend from December 2015. The implementation of the trading curb in early 2016 caused the investor sentiment index to fluctuate between a low range and a narrow range. As a result, its stochastic volatility showed an obvious phased weakening trend, and eventually maintained a low level and ran smoothly.
As can be seen from the third subgraph, the SMV shows the characteristics of large and frequent volatility along with the stock market trends. In 2014, Stock Connect was officially launched on the market. At this time, the mainland stock market was in the initial stage of the bull market. However, the implementation of the trading curb in early 2016 caused turmoil in the mainland stock market and the SSE 50 Index fell sharply. In 2017, under the influence of many positive factors, the SSE 50 Index began to rise steadily along with the rise of the stock market, rekindling the enthusiasm of retail investors for participation. As a result, the stochastic volatility of the SSE 50 Index increased rapidly during this period until reaching its highest point in March 2019. However, COVID-19 in 2020 caused the SSE 50 Index to show a shock decline and eventually remained at a low level.
Analysis of Time-Varying Characteristics of Contemporaneous Relationships Between Variables
Figure 5 reflects the characteristics of the contemporaneous relationship between the three variables of Stock Connect net capital inflows (HGT), Investor Sentiment Index (ISI), and SSE 50 Index (SMV) over time.

Time-varying characteristics of the contemporaneous relationship between three variables.
As can be seen from the first subgraph, the impact coefficient of Stock Connect net capital inflows on the investor sentiment index
As can be seen from the second subgraph, the impact coefficient of Stock Connect net capital inflows on the SSE 50 Index
As can be seen from the third subgraph, the impact coefficient of the investor sentiment index on the SSE 50 Index
Impulse Response Analysis with Different Lead Times
In this section, we employ the SV-TVP-SVAR model to investigate the dynamic interrelationships among the Stock Connect net capital inflows (HGT), investor sentiment index (ISI), and the SSE 50 Index (SMV). Our analysis innovatively examines the asymmetric spillover effects between Stock Connect capital flows and stock market volatility, with particular emphasis on their time-varying characteristics across different periods. Since all parameters in the SV-TVP-SVAR model vary over time, it is necessary to estimate time-varying parameters for different lead times in order to calculate the impulse response functions among the study variables. Figure 6 shows the trends of time-varying impulse response functions for different lead times.

Impulse response function with different lead times.
Specifically, the short-term, mid-term, and long-term coefficients of
The trend of
We now focus on
China's capital account is not yet fully open. As one of the main channels for foreign capital to enter the A-share market, the Stock Connect capital flow has a significant impact on the mainland stock market (Meng et al., 2023). According to the analysis in the previous text, since foreign capital is generally regarded as a representative of value investing, mainland investors often take the movement of capital in the Stock Connect as a barometer of market trends. When Hong Kong investors purchase A-shares in large quantities through the Stock Connect, it is usually seen as an optimistic signal from foreign capital towards the mainland market. Conversely, if there is a sustained outflow of capital through Stock Connect, it may indicate a cautious attitude of foreign capital towards the short-term trend of A-shares. Therefore, the capital flow data of the Stock Connect has become one of the important indicators for analyzing the trend of the A-share market (He, 2020).
Based on the historical data of China’s A-share market, there is a certain interactive relationship between the Stock Connect capital flow and the performance of the A-share market. When the Stock Connect net capital inflow increases, the SSE 50 Index often rises accordingly. This indicates that the inflow of foreign capital has a positive impact on market sentiment and the performance of blue-chip stocks. However, different from the research of Liu and Jo (2019), we find that after the SSE 50 Index rises continuously, the Stock Connect net capital inflow may decrease, and even a net outflow may occur. This phenomenon is consistent with the contrarian investment style of foreign capital in the A-share market: when the A-share market experiences consecutive sharp declines, funds from the Stock Connect tend to buy on dips, positioning for value; whereas when the market rises consecutively and valuations become high, foreign capital is more inclined to take profits and sell at higher prices.
This contrarian trading style has enabled the Stock Connect funds to play a role as a market stabilizer to some extent (Cheng et al., 2019). According to a report from Snowball Inc., a well-known Chinese online wealth management platform, during the significant A-share market correction in 2018, funds from the Stock Connect continued to flow in, providing liquidity support to the market. In contrast, at the beginning of 2021 when the A-share market rose rapidly, foreign capital gradually reduced its holdings of some high-valued stocks. This buy low, sell high strategy not only reflects the value investment philosophy of foreign capital but also influences the trading behavior of mainland investors to some extent, leading to more rational market fluctuations.
We believe that the asymmetric spillover effect between Stock Connect capital flows and mainland stock market volatility stems from the regulatory role of mainland investor sentiment. When the Stock Connect net capital inflows increase, this weathervane will enhance the confidence of mainland investors, quickly promote the rise of mainland stock prices, and cause the SSE 50 Index to rise. Therefore, the impulse response coefficients of
Analysis of Time-Varying Impulse Response Characteristics at Different Time Points
We selected and examined the impulse response functions formed by shocks in the SV-TVP-SVAR model at three different time points: November 2016, May 2018, and February 2021. The events corresponding to the three-time points are as follows: (1) In November 2016, the China Securities Regulatory Commission successfully investigated and dealt with the first case of cross-border manipulation of Stock Connect. (2) In May 2018, the Shanghai Securities Exchange raised the daily quota for the northbound funds under Shanghai-Hong Kong Stock Connect to 52 billion yuan and the daily quota for the southbound funds under the Shanghai-Hong Kong Stock Connect to 42 billion yuan. Northbound funds under Shanghai-Hong Kong Stock Connect refer to funds from Hong Kong to mainland China. Southbound funds refer to funds from mainland China to Hong Kong. (3) In February 2021, the Shanghai Stock Exchange issued the newly revised Measures for the Implementation of the Shanghai-Hong Kong Stock Connect Business of the Shanghai Stock Exchange to include eligible Science and Technology Innovation Board stocks into Stock Connect. The specific empirical results are shown in Figure 7.

Impulse response function at different time points.
Generally speaking, the impulse response function trends at different time points are quite different. In November 2016, the China Securities Regulatory Commission successfully investigated and dealt with the first case of cross-border manipulation of Stock Connect. Among the pulse corresponding coefficients, the coefficients of
A comparison of the three events reveals that the impulse response results of the first two events are similar. Under the influence of these two events, Stock Connect’s net capital inflows, the investor sentiment index, and the SSE 50 Index exhibit complex dynamic interconnections. Consistent with the findings of Liu and Jo (2019), an increase in the Stock Connect capital inflows serves as a signal of fund movements, prompting investors to form new expectations about market trends. This triggers either panic or cautious sentiment, leading to a decline in the investor sentiment index. Simultaneously, changes in capital flows disrupt the supply-demand equilibrium in the market, resulting in a drop in the SSE 50 Index. In contrast to the findings of Hui et al. (2013), when the investor sentiment index rises significantly, the prevailing market optimism enhances investors’ risk appetite, prompting them to seek alternative high-yield investment opportunities. This behavioral shift leads to a reduction in Stock Connect capital inflows. Concurrently, the positive market sentiment drives substantial capital inflows into the stock market, propelling the SSE 50 Index upward. The upward trajectory of the SSE 50 Index, bolstered by its strong market performance, subsequently attracts additional capital inflows, thereby increasing Stock Connect investments. However, as capital continues to pour in, emerging signs of market overheating raise investor concerns about potential risks, ultimately causing the investor sentiment index to decline.
In November 2016, the China Securities Regulatory Commission successfully investigated and dealt with the first case of cross-border manipulation of Stock Connect. This incident attracted widespread attention in the field of financial supervision and became an important milestone in strengthening cooperation and supervision of the securities markets between China and Hong Kong. However, precisely because of this case, the impact of Stock Connect net capital inflows on the investor sentiment index, and the SSE 50 Index has changed compared with Figure 6. It is not difficult to see that mainland retail investors have distrusted the Stock Connect and believe that there are regulatory loopholes in the Stock Connect mechanism. Therefore, the impulse response coefficient changes from the positive value in Figure 6 to the negative value in Figure 7, and the coefficient of the SSE 50 Index also becomes negative and gradually decreases. The impact of the investor sentiment index on the Stock Connect net capital inflows and the SSE 50 Index, as well as the impact of the SSE 50 Index on the investor sentiment index, are not affected by the above-mentioned events. It is worth noting that the impact of the SSE 50 Index on the Stock Connect net capital inflows is exactly opposite to Figure 6. Figure 6 is negative first and then positive, and Figure 7 is positive first and then negative. This shows that the China Securities Regulatory Commission’s investigation and handling of cross-border manipulation cases under the Stock Connect has demonstrated to a certain extent the ability of cross-border regulatory cooperation and has played a positive role in maintaining the fairness and transparency of the stock market.
In May 2018, regulators in mainland China and Hong Kong jointly announced that they would raise the daily quota for the northbound funds under Shanghai-Hong Kong Stock Connect from 13 to 52 billion yuan and the daily quota for the southbound funds under the Shanghai-Hong Kong Stock Connect from 13 to 42 billion yuan. This adjustment increases the upper limit of capital flows between the stock markets of the two places, aiming to further promote the opening of the market, and strengthen the connection between Hong Kong and the mainland stock market. However, contrary to government policy considerations, the investor sentiment index, and the SSE 50 Index responded negatively to the Stock Connect net capital inflows, indicating that mainland investors are worried about the risk of cross-border capital flows caused by the expansion of overseas hot money. They are not optimistic about the quota increase of Stock Connect. The impact of the investor sentiment index on the Stock Connect net capital inflows and the SSE 50 Index, as well as the impact of the SSE 50 Index on the investor sentiment index, are not affected by the above-mentioned events.
In February 2021, the Shanghai Stock Exchange issued the newly revised Measures for the Implementation of the Shanghai-Hong Kong Stock Connect Business of the Shanghai Stock Exchange to include eligible Science and Technology Innovation Board stocks into Stock Connect, aiming at attracting more international capital to participate in the growth of China’s innovative enterprises and also provides investors with more investment options. The expansion of the target stocks of Stock Connect will not only expand the investment scope of the interconnection and provide foreign investors with richer investment targets but will also introduce more overseas institutional investors to the Science and Technology Innovation Board and further improve the investor structure of mainland China’s capital market. It can be seen from the impulse response coefficient that Stock Connect net capital inflows, investor sentiment index, and SSE 50 Index all have a positive attitude towards this event, and the impulse response coefficients are all significantly positive. It is worth noting that Figure 7 is the same as Figure 6,
Conclusion and Policy Recommendations
Building on previous research (Cheng et al., 2019; Huo & Ahmed, 2017; Pan & Chi, 2021; Zhang et al., 2022), we focus on existing research gaps and conduct an in-depth exploration from both theoretical and empirical perspectives. At the theoretical level, we construct a tripartite analytical framework of Stock Connect capital flows—Investor Sentiment—Stock Market Volatility, meticulously delineating the transmission pathways and mechanisms of influence among these three elements. In terms of data and methodology, leveraging micro-level data such as individual investor stock commentaries and trading records, we develop a localized Chinese financial sentiment lexicon by incorporating machine learning algorithms. This approach overcomes the limitations of traditional measurement methods that fail to capture the sentiment of retail investors, enabling a more precise characterization of investor sentiment. In the empirical study, we employ the SV-TVP-SVAR model to examine the time-varying asymmetric spillover effects among Stock Connect, the investor sentiment index, and the SSE 50 index. The findings provide comprehensive and scientific theoretical support for regulators to optimize cross-border capital flow management, establish risk early-warning mechanisms, as well as for investors to formulate dynamic asset allocation strategies. Specifically, Firstly, we constructed a Chinese Colloquial Financial Sentiment Dictionary based on stock forum comment texts through manual screening and the word2vec algorithm expansion and calculated the investor sentiment index. Afterward, we used the stochastic volatility time-varying parameter structure vector autoregressive model (SV-TVP-SVAR model) to empirically test the dynamic correlation between the net capital inflows through Stock Connect, the investor sentiment index, and the SSE 50 index.
The study found that there is a significant asymmetric spillover effect between Stock Connect capital flows and mainland China stock market volatility, and that mainland investor sentiment plays a regulating role in it: When Shanghai-Hong Kong Stock Connect capital inflows increase, the confidence of mainland investors is boosted, which rapidly drives up the prices in the mainland stock market, creating a positive spillover from Shanghai-Hong Kong stock Connect capital flows to mainland stock market volatility. However, when mainland stock market prices rise, the herd effect of mainland investors will be triggered, which will send a negative signal to foreign investment. Shanghai-Hong Kong Stock Connect funds accordingly sell on high, which will cause a negative spillover from mainland stock market volatility to Shanghai-Hong Kong Stock Connect capital flows. Additionally, the first legal case of cross-border manipulation of the Shanghai-Hong Kong Stock Connect has caused mainland investors to distrust the mechanism, subsequently leading to a decline in the mainland stock market index. The increase in the daily limit of Shanghai-Hong Kong Stock Connect has not alleviated mainland investors’ concerns about cross-border capital flow risks, but instead, has led to a negative impulse response of the mainland stock market index to the net capital inflows through Shanghai-Hong Kong Stock Connect.
Based on the above research findings, we put forward the following targeted policy suggestions. (1) On the premise of effectively controlling risks, the management should gradually include eligible stocks into the scope of Stock Connect and eliminate unqualified stocks according to the stock market operation and the specific conditions of stock trading under Stock Connect. (2) Reasonably guide investor sentiment and reduce irrational volatility in mainland China’s stock market. Management should closely monitor and pay attention to the trend of investor sentiment, and based on the goal of healthy development of the capital market, comprehensively consider the use of media publicity, fiscal and monetary policies, and other means to reasonably regulate and guide investor sentiment. (3) Further enhance the opening up of China’s capital market to the outside world, and when all conditions are mature, establish an interconnection mechanism between mainland China’s capital market and international mainstream capital market transactions. (4) Continue to optimize the investor structure and promote the implementation of long-term value investment concepts. The investor structure with retail investors as the main body is a significant feature of the current development of mainland China’s stock market and is also one of the important internal causes of the “herd effect” in the mainland stock market. Therefore, optimizing the investor structure and practicing the concept of long-term value investment will be an important guarantee for the healthy development of mainland China’s stock market in the future.
Limitations and Potential Directions for Future Research
Our paper still has certain limitations. On the data front, although it focuses on micro-level data of individual investors, due to data availability constraints, only selected platform-based stock commentaries and trading records are used. This results in limited sample coverage, which may not fully represent the behavior characteristics of the entire investor population. Additionally, other market sector indices are not fully incorporated, making it difficult to comprehensively reflect the overall condition of the mainland stock market. In terms of methodology, although advanced econometric models are applied, the model specifications may not fully capture the complex and dynamic nature of real-world markets, and the depiction of asymmetric spillover effects is somewhat simplified. Furthermore, the research mainly centers on the Shanghai-Hong Kong Stock Connect, without fully considering other interconnection mechanisms such as the Shenzhen-Hong Kong Stock Connect, as well as the combined impact of macroeconomic policies and the international financial environment on capital flows and market volatility.
Future research can be expanded along multiple dimensions. In terms of data, further integration of investor data from a wider range of sources—covering investor groups with different investment styles and from various regions—can enhance the representativeness of the analysis. Incorporating more market sector indices will also improve the generalizability of the findings. On the methodological front, exploring the integration of artificial intelligence and big data analytics could facilitate the development of more complex and accurate models, allowing for a deeper investigation of nonlinear relationships among variables. In terms of research scope, incorporating the Shanghai-Hong Kong and Shenzhen-Hong Kong Stock Connect schemes into a unified analytical framework could help examine the synergistic effects of cross-border capital flows. Moreover, strengthening the integration of macro and micro perspectives—by analyzing the interactions among macroeconomic policies, international financial market fluctuations, investor sentiment, and capital movements—will offer more comprehensive theoretical and practical guidance for the stable development of financial markets.
Footnotes
Acknowledgements
This research was supported by National Social Science Foundation of China, and we acknowledge their financial assistance. We are also grateful to National Office for Philosophy and Social Sciences for providing the necessary resources and infrastructure to conduct this study. We thank our families and friends for their unwavering encouragement and patience during the completion of this project.
Ethical Considerations
There are no human participants in this article.
Consent to Participate
Informed consent is not required.
Author Contributions
Author participated in the conception and design of the study. Material preparation, data collection, and analysis were performed by Chen Zhu. The first draft of the manuscript was written by Chen Zhu, and author commented on previous versions of the manuscript. Author has read and approved the final manuscript.
Funding
The author disclosed receipt of the following financial support for the research, authorship, and/or publication of this article: This work was supported by the National Social Science Foundation of China (No. 23CJY040).
Declaration of Conflicting Interests
The author declared no potential conflicts of interest with respect to the research, authorship, and/or publication of this article.
Data Availability Statement
The datasets generated by the survey research during and/or analyzed during the current study are available in the WIND Database.