
Abstract
Ever since Stouffer began to measure political tolerance a half century ago, multiple studies have shown that a number of social, psychological, and political characteristics play a significant role in influencing whether individuals want to extend civil liberties to fringe groups. However, less is known about the stability of tolerance attitudes over an individual’s lifetime. To address this problem, our research draws on a national U.S. multiple-generation, four-wave panel study stretching from 1965 to 1997. The intuitive appeal of the approach used in this study is to advance theoretical accounts for variations in political intolerance irrespective of generational placement, life cycle, and differences in the political context. Specifically, the panel design encourages an effort to examine the relative impact of the social, political, and psychological predictors on intolerance over time and across the same individuals, and to assess the consequences of how changes in these determinants affect some of our most fundamental hypotheses about the origins of these attitudes.
Introduction
Triggered in large part by the work of Stouffer (1955), the concept of political tolerance has received a great deal of scholarly attention. Considerable thought has been devoted to uncovering the antecedents of tolerance and intolerance (Marcus, Sullivan, Theiss-Morse, & Wood, 1995), the consequences of tolerant and intolerant attitudes, and trends over time (Gibson, 2006, 2008, 2010; McClosky & Brill, 1983; Mondak & Sanders, 2003). The literature has been enriched by studies of attitudes toward specific target groups (Gibson, 1987, 1992; Peffley & Sigelman, 1990; Stouffer, 1955) and particular historical context (Davis, 2004; Gibson, 1988); the influence of religion on political tolerance (Eisenstein, 2006); better conceptualization and measurement of the key social, political, and psychological predictors of tolerance (D. W. Davis & Silver, 2004; Hurwitz & Mondak, 2002; Marcus et al., 1995; Peffley, Knigge, & Hurwitz, 2001); in-depth examination of personality factors (Marcus et al., 1995; Stenner, 2005); the role of threat perceptions (D. W. Davis & Silver, 2004; Gibson & Gouws, 2003); experimental designs (Gibson, 1998; Marcus et al., 1995); and methodological research (Gibson, 1992; Mondak & Sanders, 2003).
Although the earliest studies made substantial progress in the effort to understand the levels and sources of political tolerance and support for democratic values (Bobo & Licari, 1989; Gibson, 1992; Golebiowska, 1995; Lipset, 1959; Marcus et al., 1995; Mondak & Sanders, 2003; Nunn, Crockett, & Williams, 1978; Stouffer, 1955; Sullivan, Piereson, & Marcus, 1979, 1982), not much is known about the stability of political intolerance attitudes over an individual’s lifetime. In large part, this is because existing studies rely on the standard tolerance battery contained in the General Social Survey (GSS) that might be adequate for cross-sectional research but is deficient for longitudinal analysis (Gibson, 1992) and in particular, differentiating social change stemming from age, period, and/or cohort effects. To address this problem, our research draws on a national U.S. multiple-generation, four-wave panel study stretching from 1965 to 1997 to investigate the interrelationship of social, political, and psychological characteristics with intolerance over the life course that has important implications for our understanding of the sources and consequences of political tolerance.
Although considerable thought has been devoted to uncovering time trends in tolerance, these prior studies have relied on cross-sectional data that are incapable of uncovering changes in tolerance stemming from the replacement of individuals as opposed to individuals changing how they think (Firebaugh, 1989). Of special concern is the question of “why” changes in opinions occur, and the present study examines certain facets of this question. Thus, this research, unlike most studies in the subfield, relies on lengthy panel data to identify the origins of political intolerance by the same individuals, and across three lineage generations (see Appendix A for wave panel summary). From this vantage point, it is possible to compare the political intolerance attitudes of today with those of the past, and as a result, it is possible to speak confidently about trends in intolerance that result from life cycle, generational, or period effects. The evidence can be used to enlighten the debate about the dynamics that are associated with intergenerational maintenance, acquisition, and reduction of intolerant beliefs.
A second objective is to see how well Sullivan, Marcus, Feldman, and Piereson’s (1981) model of generic tolerance would perform when applied to the narrower question of the sources of intolerance toward a specific civil liberties dispute: allowing a suspected communist the opportunity to run for elected office. Although a number of studies examine “focused intolerance” toward specific target groups, none uses longitudinal data and so are limited in their ability to examine the relative impact of the key predictors on one’s willingness to extend civil liberties over time. Because a strategy employed here is to determine whether the generations are more alike or unalike, and why, we examine the influence of the social, psychological, and political predictors and the presence of intolerance for each generation. Of importance here is the extent to which changes in an individual’s environment may create instability in attitudes, and which environmental factors significantly contribute to the change.
Not surprisingly, Stouffer’s (1955) benchmark study discovered great intolerance among the American public toward communists, socialists, and atheists in the 1950s. However, as documented by the work of Nunn et al. (1978), intolerance toward communists had dropped considerably by the 1970s. The impact of this seminal study led many scholars to conclude that tolerance in general, not just toward communists, in America had increased. Yet, Mondak and Sanders (2003) claimed that the increase in tolerance was not wholly the consequence of a general increase but in part reflective of changes in group-specific attitudes. While it may well be the case that communists were the least-liked group for most Americans in the 1950s, that was coupled with high levels of intolerance for that particular group, the political context of that time period was substantially different from the one that prevailed in the 1970s. It was argued, that most Americans were still willing to deny political rights to disliked groups in the 1970s; it was just that Americans’ dislike of communists had fallen (Sullivan et al., 1979, 1982).
The advantage of our approach is that it can explore the impact of important contextual factors that condition an individual’s intolerance toward communists spanning a 32-year period. It is not possible to obtain these results in prior studies and consequently, our findings shed new light on the various ways these variables influence intolerance in a given context. In this way, investigating “focused intolerance” toward a specific group provides a stringent “test” of the generalizability of the sources of intolerance to a very different history era and political context (Peffley & Sigelman, 1990, p. 95).
The results of this research, thus, present both unique and valuable contributions to the study of political tolerance. In short, we move beyond the common approach of focusing on why aggregations of individual attitudes vary over time and across cohorts and instead explain why attitudes vary across individuals. Unlike other studies of political tolerance, we have the added advantage of “before” and “after” measures and lengthy panel data. Specifically, the research design encourages an effort to examine the relative impact of the predictors to intolerance for allowing a suspected communist to hold public office and to assess the consequences of how changes in these determinants affect some of our most fundamental hypotheses about the origins of intolerance.
Given the importance of intolerance from both a scholarly (Peffley & Sigelman, 1990) and a historical perspective within the United States, the ability to study the determinants of intolerance toward communists across time by the same individuals provides a unique opportunity to help us understand attitudinal stability and discontinuity including the sources of change. Because we know very little about how stable intolerance beliefs are, and the extent to which the predictors are relevant over an individual’s life course, the objective here is to provide a long-term examination that explores age, period, and cohort variations in a specific civil liberties dispute. By considering attitude change in trends for whether a suspected communist should be able to hold public office, we contribute both to the literature on tolerance and on social change more broadly.
Key Concept
Political Tolerance
People are tolerant to the extent that they are willing to grant the full rights of citizenship uniformly and without exception. The general literature on democracy and political tolerance suggests one requirement is a dedication to the “rules of the democratic game and a willingness to apply them equally” (Sullivan et al., 1982, p. 2). It follows that people are intolerant provided that they advocate any restriction of political acts that are otherwise permissible under law (Bobo & Licari, 1989; Lawrence, 1976; McClosky & Brill, 1983; Mondak & Sanders, 2003, 2005; Sniderman, Brody, & Tetlock, 1991); that is, any deviation from the commitment to the rights and liberties of others reflects some degree of intolerance (Bobo & Licari, 1989; Lawrence, 1976; McClosky & Brill, 1983; Mondak & Sanders, 2003).
Therefore, persons are considered intolerant to the extent that they are prepared to refuse the legally recognized right to run for office. Although there is no constitutional right to hold public office per se, there is support in extant research (e.g., Bobo & Licari, 1989; Cigler & Joslyn, 2002; Mondak & Sanders, 2003) suggesting such a measure is pertinent to tolerance in the sense that it implicitly taps into a fundamental right guaranteed in a democracy. Tolerance requires that individuals respect the right of people to express different views, and the denial of the right to seek office to members of ideological groups directly violates their right “to try to win majority support for their opinions” (Prothro & Grigg, 1960, p. 283). Thus, denying a suspected communist the opportunity to hold elected office unequivocally measures intolerance.
The earliest empirical study of tolerance (Stouffer, 1955) utilized a similar measure designed to examine the extent to which Americans were prepared to extend procedural rights to groups on the left. It should come as no surprise that in the 1950s, communists were cited as one of the most commonly disliked groups in America. As such, virtually all Americans supported depriving admitted communists of at least some of their political and civil liberties (Stouffer, 1955). 1 Although opposition to communists may have decreased since the 1950s, recent research suggests that they remain on the radar of most Americans and are not well liked in the United States. Using data from 2005, Gibson (2008) found that communists rank as the sixth most commonly disliked groups in America today, with about one in five Americans putting communists on their list of the three most disliked groups. Moreover, only 5.2% of the respondents expressed any degree of positive affect toward communists as compared with the 73.4% who disliked them. In short, it is clear that there still remains a considerable amount of animus toward communists in the United States.
Age–Period–Cohort
In our approach, it is possible to compare the political intolerance attitudes of three generations over time and as a result, it is possible to identify continuity and discontinuity arising from generational effects, life-cycle effects, and period effects. A cohort explanation argues that differences in attitudes are due to the social and cultural climate prevailing so that members of a generation share the same formative experiences, distinctive from the experiences of their adjacent counterparts (Jennings & Niemi, 1981; Mannheim, 1928/1972). Thus, the historical period and the nature of the political times shape the youth’s first political experiences that influence them for a lifetime. In contrast, an age or life-cycle explanation argues that distinctive patterns in attitudes are due to position in the life cycle (Mayer, 1992); that is, respondents, regardless of cohort placement, will have similar attitudes while in their youth, middle age, or when elderly. It is also possible however, that political climate affects the public at large so that attitudinal changes reflect period effects. Period or historical effects have a roughly common impact on all or most segments of society (Mannheim, 1928/1972).
There have been many suggestions in the literature that younger people typically are more tolerant than older people. This was originally attributed to a life-cycle effect, that is, the tendency for people to become less tolerant as they age (Sears, 1983; Stouffer, 1955). But more recent studies have found no evidence of this aging effect and indicate instead a generational effect so that recent cohorts are not only more tolerant than earlier cohorts but tend to remain so as they grow older (e.g., Cutler & Kaufman, 1975; Davis, 1975; Wilson, 1994). Overall, the picture emerging is one where tolerance attitudes are invariably the result of generational rather than life-cycle effects; because of their particular research design, however, these studies cannot answer questions such as why individuals may be more tolerant as compared with similarly situated individuals in the previous or later generation, or how those tolerant and intolerant attitudes develop and change over the life cycle.
The basic problem in assessing age, period, and cohort effects is that two of the basic effects (either age and cohort, period and cohort, or age and period) are confounded. When older persons are shown to be more conservative than younger persons, this may result from aging but also from the confounding effects of cohort (generational) differences in socialization. Thus, any inferences about the effect of age changes on political attitudes derived from cross-sectional studies must be viewed with considerable reservation. Unlike other studies of political tolerance, we have the advantage of lengthy panel data.
In the following section, we will begin with a discussion of several hypotheses regarding explanations of individual change and a review of evidence pertaining to several central issues that arise from these hypotheses. The main question is to what extent, age, cohort, period, and individual characteristics contribute to the longitudinal explanation of intolerance regarding the right of a suspected communist to hold public office? This discussion provides the theoretical basis for our presentation of findings. Next, we will describe the data and measures used to test these hypotheses. In the final section, we will present and discuss the results of our analyses.
Explanations of Change
In comparing generations with each other and with themselves over time, one must be aware of four types of phenomena: (a) continuity and discontinuity as a function of (b) life-cycle effects, (c) generational effects, and (d) period effects. It is important to distinguish between these three processes, because each has important and differing implications for the shape of intolerant opinions.
Hypotheses
There have been many suggestions in the literature that age or life-cycle processes are important to attitude formation and change. Life-cycle effects represent differences attributable to aging-related developmental changes in the life course. In the “conventional lifecycle effects model” the research should demonstrate movement by the younger generation to the older one in which change in the older generation has stopped (Jennings & Stoker, 2004). Accordingly, our first hypothesis is as follows:
A related argument is the “age-stability hypothesis” that claims that people change their minds little as they age (Alwin & Krosnick, 1991; Lorence & Mortimer, 1985). This hypothesis has been supported with respect to many social attitudes (see, for example, Cutler & Kaufman, 1975; Davis, 1992; Firebaugh & Davis, 1988; Wilson, 1994). The assertion is that as individuals’ age and move through various stages of life, their attitudes become more stable over time. The stability grows out of a learning process marked by habituation and hardening through exposure and usage (Jennings & Markus, 1984). If the fact that attitude inconsistency is more prone to occur in the young, but as the individual ages, attitude stability increases, then the evidence suggests that there is a highly formative stage in young adulthood after which time the person becomes more resistant to environmental pressures that affect attitude change.
Given these considerations, our second hypothesis is formulated as follows:
However, as the younger cohort ages and life experiences change less, the expectation is that political intolerance attitudes will become increasingly stable up through middle age. The assumption is that as they pass through time, the young will demonstrate similar levels of attitudinal stability to that of their parents (or at least to the point at which the older generation was when it was in that age bracket).
In contrast, a generational explanation argues that differences in attitudes are due to the social and cultural climate prevailing so that members of a generation share the same experiences, distinctive from the experiences of their adjacent counterparts (Jennings & Niemi, 1981; Mannheim, 1928/1972). A generational effect exists when a specific age cohort is uniquely socialized by a set of historical events. The usual assumption is that certain events in history make an indelible imprint on the young, whereas older individuals are better equipped to resist its influence by their previous life experiences. Studies of young adults during the volatile 1960s (e.g., Sears & McConahay, 1973) found that new environments induced new political orientations.
There are valid reasons for expecting generational differences for intolerance. It has often been suggested that because of the unique experiences with communism during their impressionable years, the parent generation will be more intolerant whereas their offspring (Gen 2), whose formative political experiences consisted of the Civil Rights Movement and the Vietnam War, will hold less repressive tendencies. In particular, it is believed that the younger generation, having reached adolescence during “the 1960s” will carry with them a permanent “liberal” tilt that could have serious consequences for political intolerance (J. A. Davis, 2004).
If correct, we hypothesize the following:
Related, we also surmise that intolerance should follow the expected route, and so we contend the following:
From this perspective, the unique events occurring in the 1960s-1970s set the political tolerance orientations of the second generation apart from their parents and children.
Evidence, however, suggests that strong political shocks can affect young and old alike and leave a permanent imprint on one’s attitudes and opinions. In situations where the effects of contemporary societal circumstances reflect a more uniform change, regardless of age, we tend to classify them as period effects. Period effects can produce both individual and aggregate change, often quickly and enduringly, without any age-related differences. The sharp drop in trust in government between 1965 and 1975, for example, was almost entirely this sort of period effect, as Americans of all ages changed their minds about their leaders’ trustworthiness. 3
We can also expect some period effects. The third set of arguments suggests that there will be a gradual improvement for both Gen 1 and Gen 2 over time as the context in the country has gradually changed. Since the 1950s, intolerance of communists has waned considerably (see Nunn et al., 1978). During the late 1960s and early 1970s, extreme hostility toward the Soviet Union and communists began to soften somewhat and polls showed less opposition to communism and greater tolerance for allowing a communist to speak in public (Mayer, 1992). However, the 1980s ushered in a period of conservatism that rose to dominance when Ronald Reagan became president and was accompanied by a belief that the Soviet Union was not just unfriendly but an enemy. To the extent that intolerance is shaped by historical events, we hypothesize as follows:
In sum, the longitudinal design provides the opportunity to explore the extent to which new generations of people enter the electorate and bring with them different life experiences that can be expected to influence political attitudes differently than previous generations. Alternatively, the basis of the explanation may be found in the aging process itself—when environments become increasingly unstable in the preadult years (as individuals complete education, enter marriage, the workforce, or the military, for example), they may have more reasons to shift their attitudes and orientations as they grow older (Lorence & Mortimer, 1985).
Sources of Political Tolerance
The earliest empirical studies (e.g., Stouffer, 1955) identified individual-level factors that appear to enhance or impede political tolerance, including political, psychological, and social background variables. Indeed, education, age, religiosity (including church attendance and one’s interpretation of the Bible), social status, gender, race, political ideology, interpersonal trust, party identification, political knowledge, and region have all been identified in the literature as important antecedents of tolerance. 4 Realistically, we expect to find that the impact of the predictors should work to differentiate members within a cohort and across cohorts (e.g., Jennings, 2002; Nie, Junn, & Stehlik-Barry, 1996; Sullivanarcus, 1982).
Because the bases of intolerance appear to vary with a number of possible influences, the present design provides the opportunity to examine the direct effect of each of the predictors, and to also examine whether the relationship is consistent across generations and time.
Data
To assess the effect of age, birth, and year on changes in intolerance, we rely on the Youth–Parent Socialization Panel Study, 1965-1997, collected by Jennings and Niemi (1981; see also Jennings, Markus, & Niemi [and Stoker]). 5 The long-term political socialization project was compiled from interviews with a national probability sample of 1,669 high school seniors from the graduating class of 1965, and when possible, at least from one parent. Of the high school sample, a total of 935 individuals were resurveyed in 1973, 1982, and 1997, resulting in an unadjusted retention rate of 56% across the 32 years. The three-wave parent panel consists of 898 respondents from an original sample of 1,562, for an adjusted retention rate of 57%. For ease of understanding and to avoid awkward labeling, the high school senior class is identified as Gen 2 or G2 and their parents as Gen 1 or G1.
Additional data consist of interviews in 1997 with Gen 2 and their offspring (Gen 3 or G3), aged 15 and above. Self-administered questionnaires were received from 778 of the 1,435 offspring (G3) aged 15 and older, for a response rate of 54%. The availability of data for G2 and their offspring (G3) in 1997 provides the additional opportunity to explore the extent to which intolerant beliefs in the previous generation are reflected in the next. 6
However, less attention will be paid to contrasting the second generation with their children (e.g., contrasting G2 with G3). The absence of additional observations prevents us from knowing whether the patterns continue as the generations age, and process historical experiences and social change. The offspring generation is particularly problematic because discontinuity is more likely to occur within G3 as they confront frequent disruptions—such as getting married, having children, deciding on a profession—that are associated with the aging process.
Dependent Variable
Whereas tolerance presupposes that the individual dislikes the group or groups in question, people are intolerant provided that they advocate any restriction of political acts that are otherwise permissible under law. 7 Because opposition to communists cannot be determined with the socialization data set, our dependent variable taps intolerance toward communists rather than tolerance. To create the measure of intolerance of communists, we counted the number of “disagree” or “don’t know” answers. 8 Thus, respondents are considered intolerant to the extent they express ambivalence or a willingness to deny office-holding privileges to suspected communists.
Of course, if the purpose of this research was to track trends in tolerance attitudes or measure the extent of generic intolerance in the United States, a simple dichotomy responding to a single question certainly constitutes a poor strategy. Our objective, however, is to provide a more focused investigation of intolerance and how the antecedents of political intolerance affect the suppression of communist officeholders across a substantial time frame of an individual’s lifetime. By focusing on the “disagree/don’t know” responses to holding office, a right that is codified by law, this represents a valid measure of one specific manifestation of the phenomenon. This dichotomous conceptualization of tolerance versus intolerance is supported in the literature (on this point, see Mondak & Sanders, 2003).
Moreover, as noted in the introduction to this article, Gibson (2008) found that much of the American public still expresses some antipathy toward communists suggesting that the issue of extending freedoms, such as allowing a suspected communist to run for elected office, would be considered offensive by many. That is, Gibson (2008) demonstrated that communists remain a highly disliked group by most Americans and that a bit more than 50% of Americans would be willing to ban a demonstration by communists. More importantly, the level of antipathy and intolerance toward communists in contemporary America is similar to that toward other groups, such as Radical Muslims and Atheists. So although the proclivity for intolerance of communists may have waned since the 1950s, the unwillingness to extend freedoms to communists remains pervasive among most Americans. Because communists continue to be one of the least-liked groups toward which Americans hold high levels of antipathy and intolerance, the sole measure utilized here provides for a more focused investigation of intolerance toward communists spanning a substantial period of American history. However, given that Americans rank communists similar to other target groups considered more salient in contemporary society, we expect our analysis to contribute to a better understanding of the roots of intolerance that does not refer to any specific target group.
Method
Finally, a quick word about the statistical analyses we use in this research. To examine the questions posed earlier, this study will use quantitative methodology using two levels of analysis—individual and aggregate. The aggregate purpose is to demonstrate continuity/discontinuity as well as to highlight differences in attitudes at similar ages. The individual approach will attempt to explain the reasons for these patterns by assessing the effects of the social, psychological, and political determinants on tolerance attitudes. Comparisons based on the occurrence of the predictors may shed light on the importance of each factor for attitude formation, including whether the impact is dependent on the relative or absolute occurrence of the predictor. Moreover, we can compare how changes in these factors result in modifications of intolerant opinions.
As the dependent variable is dichotomous, we have used probit 9 models to estimate the effects of the predictors on intolerance for communists to hold public office for each panel wave. The tolerance item is coded so that 1 indicates an intolerant response. The social, psychological, and political determinants were coded using dummy variables with “1” representing the presence of a particular characteristic, and “0” representing the absence of the characteristic. To avoid perfect collinearity in the model, cases where the values of the independent variable consisted of three or more categories, such as party identification, one value was used as the baseline measure in the model. The political knowledge and interpersonal trust predictors are indexes created by combining several questions with larger numbers representing greater knowledge or trust, respectively (see Appendix B for question wording).
Findings
To more clearly illustrate the results of our analyses, the following section is divided into three subheadings pertaining to the main effects we examine: “Life-Cycle Effects,” “Generational Effects,” and “Period Effects.”
Life-Cycle Effects
Our first hypothesis stated that if intolerance was defined by a life-cycle effect, then age-related patterns and changes would manifest themselves in the form of Gen 2 showing similar intolerance as Gen 1 (their parents) at the same point in the life cycle. Examining the percentage differences reported in Table 1, at the aggregate level, we find little evidence to support H1—as Gen 2 aged the percentage reporting intolerance of a communist taking office did not move closer in line with the previous generation, an expected pattern associated with a life-stage explanation. Indeed, the gap between Gen 1 and Gen 2 widens from an initial percentage difference of 9 points in 1965 to 19 points in 1973, and basically remaining at this level beyond.
Cross-Sectional Differences.
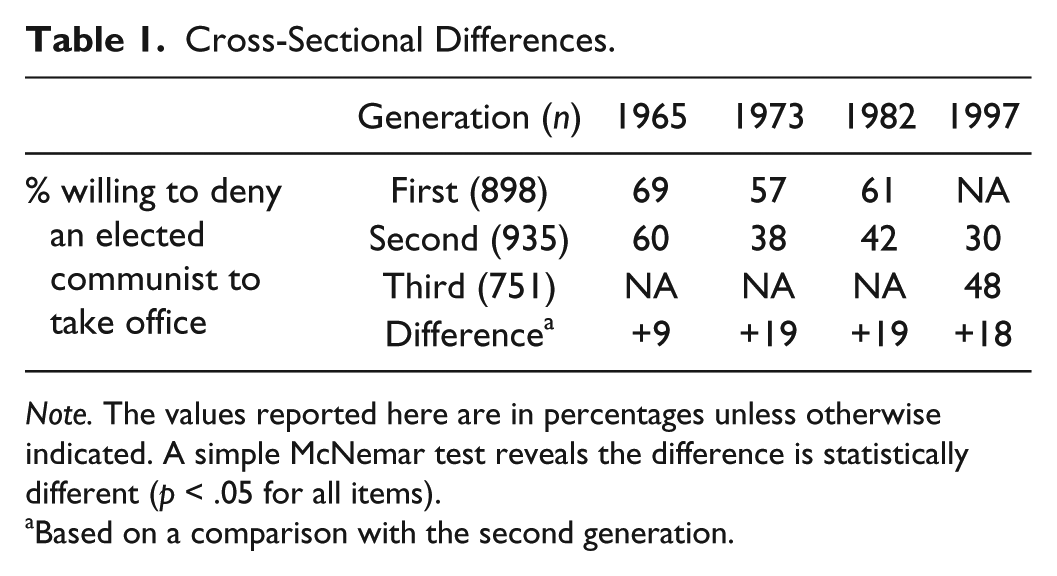
Note. The values reported here are in percentages unless otherwise indicated. A simple McNemar test reveals the difference is statistically different (p < .05 for all items).
Based on a comparison with the second generation.
These findings also suggest that attitudes toward electing a communist to public office were an exception to the standard “age-stability” hypothesis (H2), which claims that opinions on controversial social issues are formed by early adulthood and change little with age. The increase in the continuity coefficients reported in Table 2 is similar for the first and second generations over the period 1965-1973 (.37 and .33, respectively; for a reporting of the consistency of responses for each wave of data as compared with the next, see Appendix C). 10 That the aggregate movement was not exclusive to the younger generation provides support for the lifelong-openness theory, which emphasizes that lifelong changes can occur.
Overtime Stability by Generation (First and Second Generations).

Note. Entries are Phi continuity correlations. Unstandardized regression coefficients obtained by regressing the T2 score on the T1 score are almost identical. Cases were held constant across time, within each generation.
However, as the continuity coefficients in Table 2 suggest, the second generation, after experiencing more attitudinal fluctuations as it came of age, appears to become more stable by middle age. The addition of a third time period demonstrates that these gains tended to remain very much in place—particularly impressive given the much longer time span represented by the third period. In contrast, however, the continuity coefficients reported in Table 2 also suggest that the older cohort was somewhat more likely than the young to adhere to their earlier attitudes, and because the “nature of the times” affected the younger cohorts more, this differential propensity led to a widening gap in tolerance between the generations. We therefore find little evidence supporting H2—that the second generation’s position in the life cycle will exhibit less aggregate attitudinal stability than their parents.
Generational Effects
With regard to H3, which states that Gen 2 is least likely to display political intolerance, the figures reported in Table 1 strongly suggest that being socialized during the Vietnam War–Civil Rights era was quite a different experience from being raised before or after that time period. Coming of age during this time of tumult, as the 1960s generation did, appears to have had the effect of rendering the group as strong advocates for upholding the rights of communists—especially when compared with both previous and later generations who were not exposed to such a unique combination of events and changes. Thus, we obtain evidence in support of H3.
Related to this finding, we also find support for our fourth hypothesis, which also explores generational dynamics and states that the most recent cohort (Gen 3) will exhibit less intolerance than their grandparents (Gen 1) but more intolerance than their parents (Gen 2), who came of age during the 1960s. We can see that the disparity in tolerance opinions extends to Gen 2 and their offspring, and with three generations to examine, there is evidence of differential experiences as demonstrated in intergenerational gaps. Examining the percentages reported in Table 1, a wide gulf favoring Gen 2 exists that is reminiscent of the contrasts between Gen 2 and their parents (Gen 1). However, as Stouffer (1955) speculated, the aggregate results reveal a trend toward greater acceptance so that the third generation, although more intolerant than Gen 2 in 1997 (48% vs. 30%), outperform their grandparents’ generation.
Additional evidence to strengthen these claims can be found by considering “time-lag cross-generational” comparisons (Table 3). Contrasting the generations contained within the socialization project when they are at comparable ages illustrates pronounced secular movement over time, along with generational contrasts, and the changing nature of political intolerance. Thus, Gen 2 at age 26 as of 1973, matches very closely to the older half of Gen 3 as of 1997 (mean age = 27). Similarly, Gen 2 in 1997 (mean age = 50) matches almost exactly the mean age of the younger half of Gen 1 in 1973. We see further confirmation of a generational interpretation in Table 3.
Cross-Generation (Time-Lag) Comparison: Intolerance at Similar Ages.

Note. The values reported here are in percentages unless otherwise indicated. The standard error for each time reference is 0.05, and a simple McNemar test reveals the difference is statistically different (p < .05 for all comparisons). To permit matching up of approximately same-aged individuals, the parent generation is limited to the younger half when both G2 and G1 were about 50 years old; and the older half of Gen 3 in 1997 (mean age 27) is compared with Gen 2 in 1973 (mean age 26).
Based on a comparison with the second generation.
These patterns illustrate that being socialized during the Vietnam War–Civil Rights era was quite a different experience from being raised before or after that time period. It is as though the unique political climate and social conditions within which the 1960s generation came of age conditioned them to permanently, and increasingly, advocate for upholding a suspected communist’s right to contest for public office as compared with the previous or later generations at the same age.
Period Effects
These aggregate findings can also address questions about longitudinal developments in the commitment of the American public in general (H5). This third model emphasizes the role of changes in context that apply to the whole population. In this instance, a majority of both generations indicate a preference for intolerance by expressing a willingness to deny an elected communist to hold public office. By 1982, both generations had changed and become significantly less intolerant. In this case, the generations began apart and moved with the times (Figure 1). The younger generation, however, presumably because of its still impressionable years, changed more rapidly between 1965 and 1973. In contrast, between Waves 2 and 3 (1973 and 1982, respectively), the gap remains unchanged because the generations moved at a corresponding rate. These findings provide support for the influence of period effects (H5) with intolerant opinions changing in response to external events and conditions.

Trends for allowing a suspected communist to hold public office.
It is, however, important to bear in mind that the evidence of change and stability in intolerance attitudes discussed so far have been primarily based on aggregate-level analyses, which do not allow us to examine how much “individual-level” changes are responsible for the patterns revealed. Therefore, it is important to examine whether the generational discontinuity highlighted thus far occurs because of changes in each generation’s composition, or because they were raised in different historical periods.
Given the emphasis on long-term trends, the impact of social and demographic changes holds a variety of potentially significant implications for intolerance attitudes. Because opinions are strongly influenced by individual characteristics (e.g., one’s occupation or educational attainment, life histories, day-to-day experiences, peers, etc.), changes to their social and demographic conditions will produce changes in their attitudes (Mayer, 1992). Table 4 reports probit estimates of the individual-level determinants of intolerance attitudes toward a communist officeholder for Gens 1 and 2. Coefficients in columns 1 to 3 are estimated using data from 1965, 1973, and 1982, respectively. The tolerance item is coded so that a “1” indicates an intolerant response with a positive coefficient indicating a person is more likely intolerant, and a negative coefficient means he or she is less likely to be intolerant.
Determinants of Intolerance of Communist Officeholder: Gen 1 and Gen 2 (Probit Estimates).

Note. The tolerance determinants were coded using dummy variables with “1” representing the presence of a particular characteristic and “0” representing the absence of the characteristic. To avoid perfect collinearity in the model, cases where the values of the independent variable consisted of three or more categories, such as party identification, one value was used as the baseline measure in the model. The political knowledge and interpersonal trust predictors are indexes created by combining several questions with larger numbers representing greater knowledge or trust, respectively. The model excludes the social class measure in 1965 as it does not exist for the younger sample. Additional analyses excluding the social class variable revealed no substantive differences among the predictors. Standard errors in parentheses. Ref = reference; attend = attendance.
p < .05. **p < .01; #p < .05 and ##p < .01 for coefficient difference across panel years.
After controlling for a variety of social and demographic characteristics identified as important predictors, we find that one’s generation has a strong relationship with the suppression of allowing a suspected communist to hold office. For these analyses, the generational variable is dichotomized so that the parent generation was assigned a value of 0, whereas the second generation was assigned a value of 1. As the negative sign across columns 1 to 3 indicates, and consistent with previous findings, Gen 2 is consistently less likely to express intolerance than their parents, a finding that is statistically significant over the entire panel period (although the difference between the time periods is not statistically significant). 11
Furthermore, examining Table 4, it becomes clear that the occurrence of the predictor and the impact is important for attitude formation. Consistent with previous studies (e.g., Golebiowska, 1999; Nunn et al., 1978), the positive and statistically significant coefficients indicate that Whites, women, and those individuals with less than a college degree are more intolerant. However, the negative coefficients for both personal trust and political knowledge indicate that higher levels of both are associated with a greater willingness to allow a suspected communist to hold public office. This confirms previous studies that have established an association between political sophisticates and the ability to apply abstract principles in specific situations (McClosky & Brill, 1983; Wagner, 1986). Knowledgeable individuals possess an advantage that likely stems from their increased capacity for thinking about these matters in a coherent and sophisticated way (McClosky, 1964), and that facilitates the application of democratic values to practical situations. It is also worth noting that the impact of education and political knowledge on being less intolerant grew significantly over time.
Table 4 also reveals variables that have only a tenuous relationship with political intolerance. For instance, religious individuals are politically intolerant to the extent that they have a certain view of God and the Bible. The positive and significant coefficient for those who believe the Bible should be taken literally indicates these individuals are more willing to suppress rights than people with different views. This is unsurprising because one of the factors that made communism so threatening to Americans was its close association with Godlessness, and as a consequence, the phrase “under God” was added to the Pledge of Allegiance (Gibson, 1989). That this relationship is only statistically significant in the years of 1965 and 1982 likely reflects the influence of political events and increased opposition to communists documented during those years (Mayer, 1992). These findings regarding bible interpretation are also important for other reasons, most importantly, that they provide evidence of the theoretical mechanism underlying the relationship between threat and intolerance we believe to be in play. If a literal bible interpretation simply limited one’s acceptance of communists, we would expect that it would influence intolerance regardless of time period. Instead, an examination of the coefficients for “Bible’s Belief—God’s word” reported in Table 4 shows that the influence of religious beliefs on intolerance waxes and wanes with the salience of the communist threat. Last, party identification and social class are not strong determinants of intolerance.
Although the probit model provides statistical support for the influence of the predictors on intolerance, the coefficients do not lend themselves to intuitive interpretation. After converting the reported coefficients into probabilities, we can generate predictions about the types of individuals who would be more (or less) likely to be intolerant. The most revealing way to do this is to begin by focusing on a hypothetical individual. By using either the minimum or maximum values for the binary predictors and entering the mean values of the continuous variables—political knowledge and interpersonal trust—we can calculate the change in probability brought about by changes in those specific variables. Table 5 shows the results of the calculations of a hypothetical individual—one who is White, male, Republican, attends church frequently, believes the Bible is the literal word of God, has a high school education or less, and is from the South—and his predicted intolerance of a communist holding public office. 12
Probit Estimates Converted to Probabilities for Intolerance.
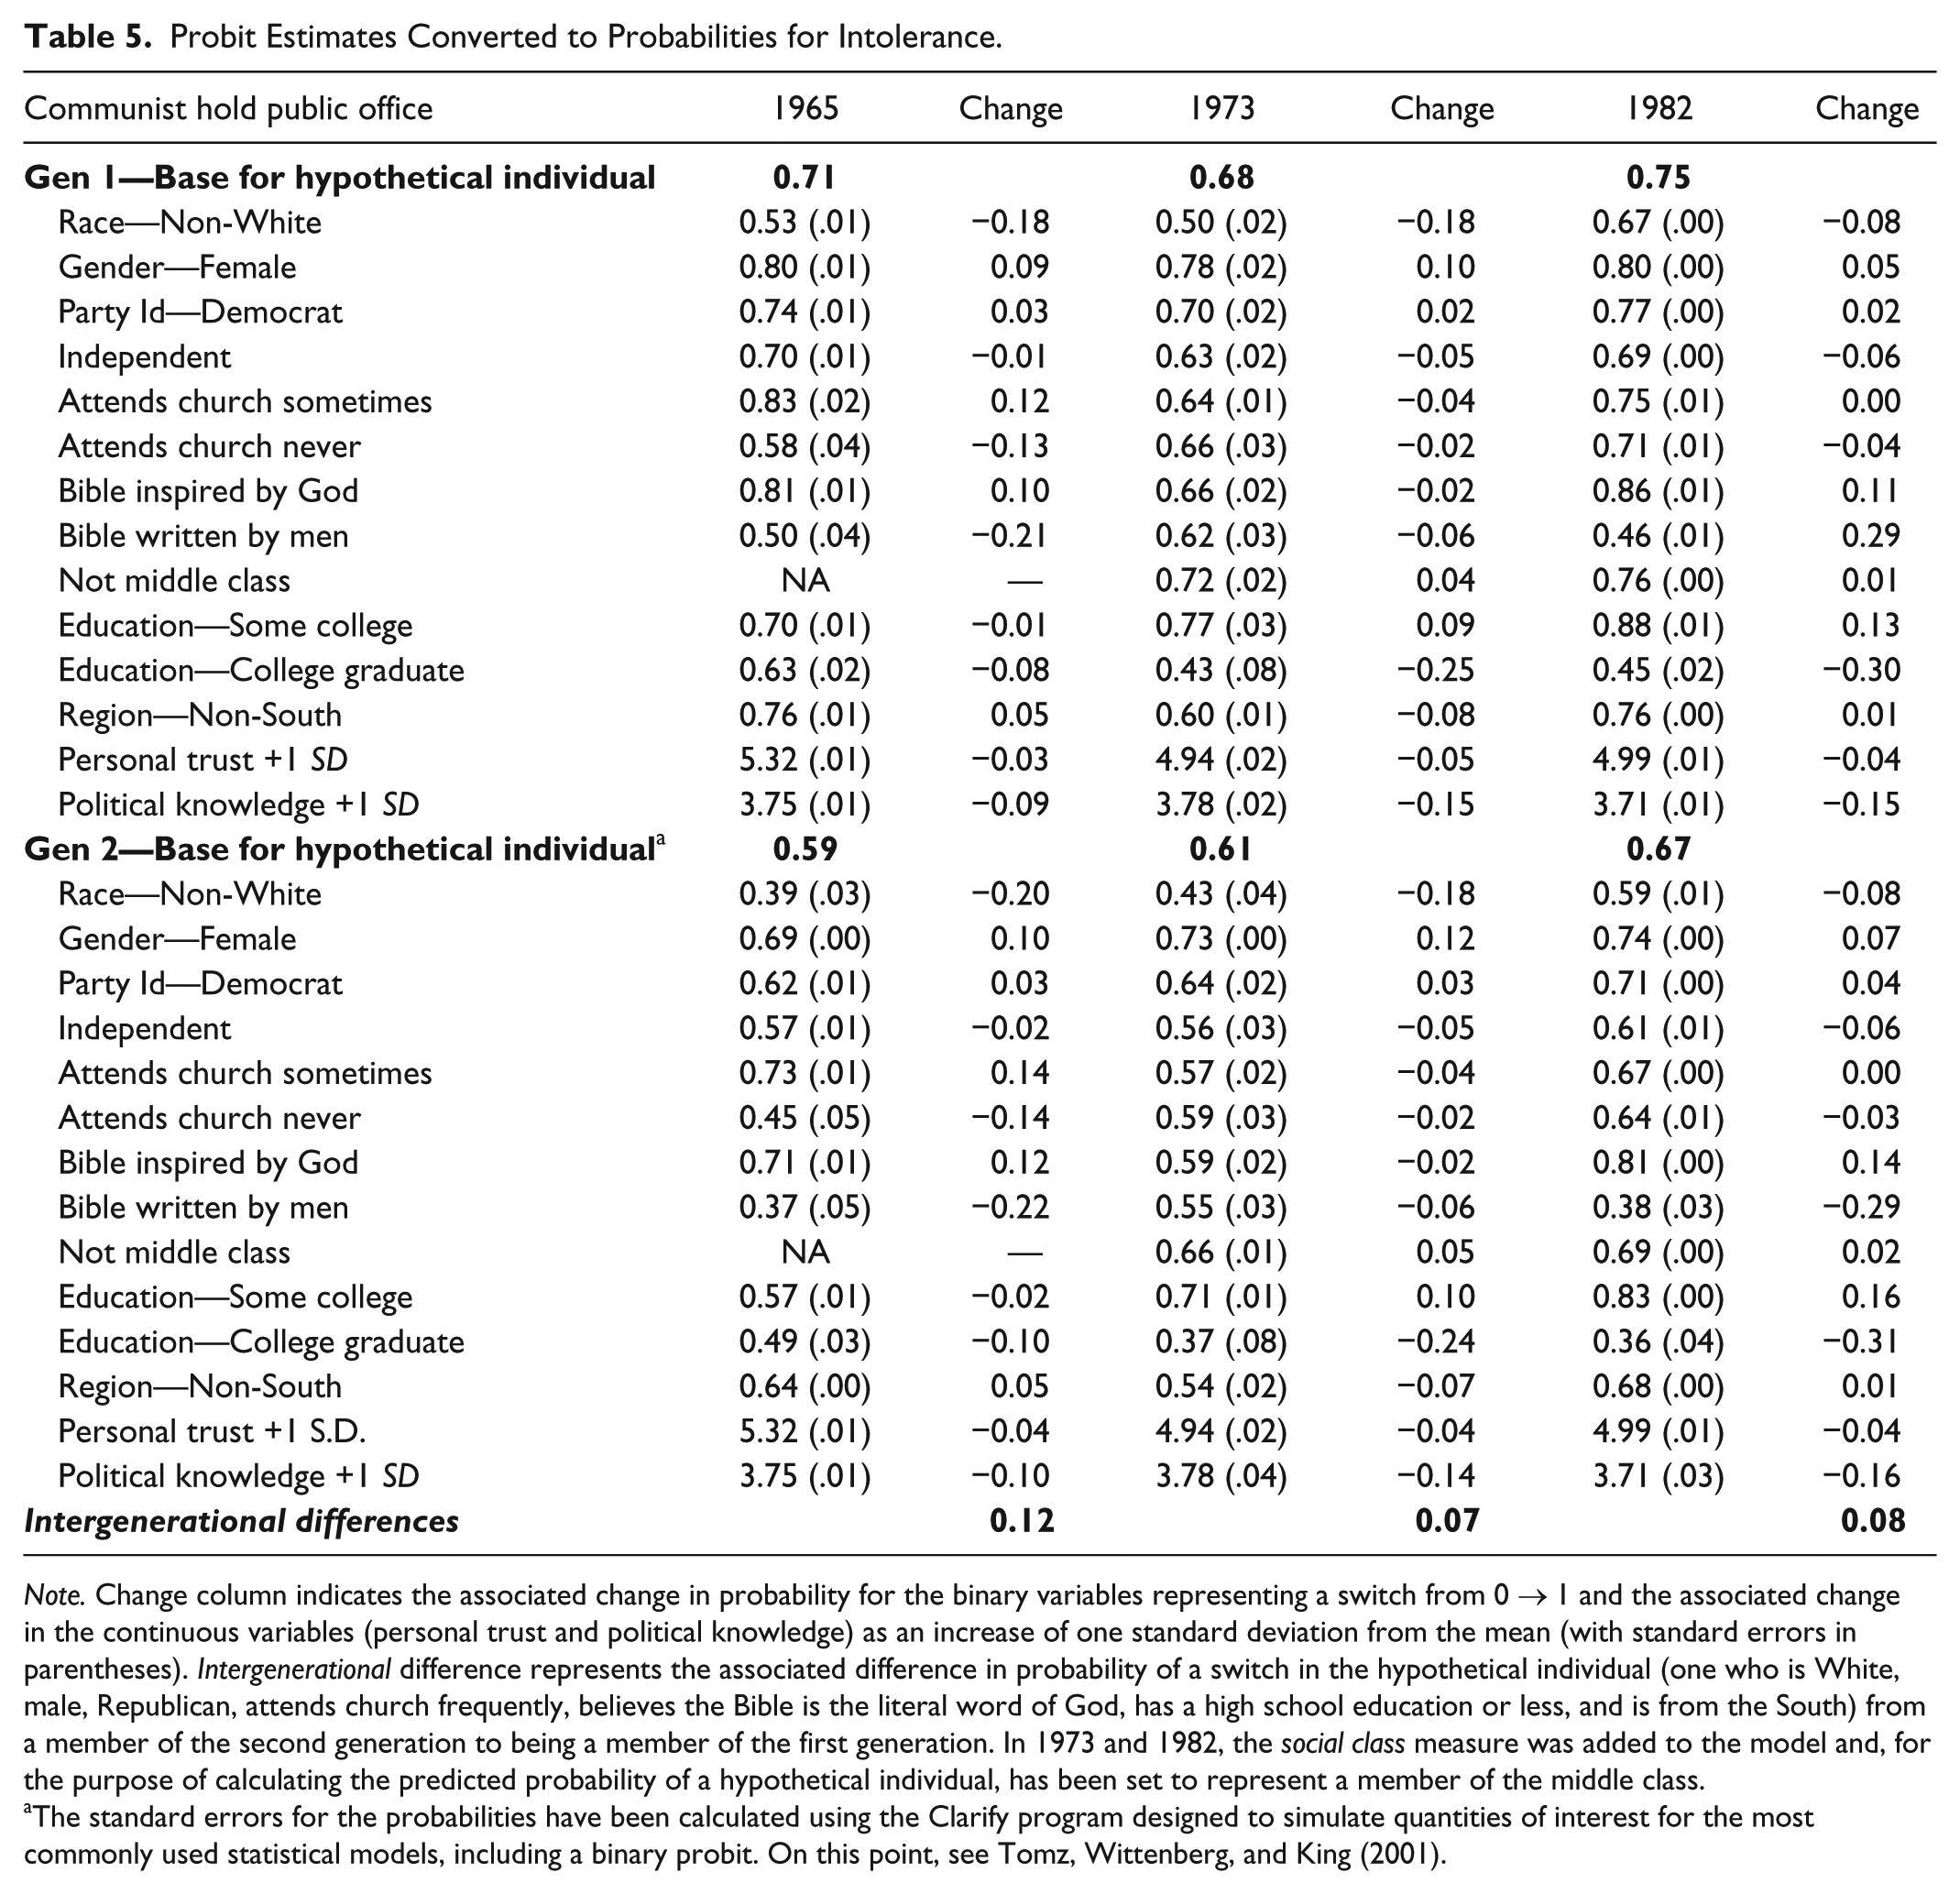
Note. Change column indicates the associated change in probability for the binary variables representing a switch from 0 1 and the associated change in the continuous variables (personal trust and political knowledge) as an increase of one standard deviation from the mean (with standard errors in parentheses). Intergenerational difference represents the associated difference in probability of a switch in the hypothetical individual (one who is White, male, Republican, attends church frequently, believes the Bible is the literal word of God, has a high school education or less, and is from the South) from a member of the second generation to being a member of the first generation. In 1973 and 1982, the social class measure was added to the model and, for the purpose of calculating the predicted probability of a hypothetical individual, has been set to represent a member of the middle class.
The standard errors for the probabilities have been calculated using the Clarify program designed to simulate quantities of interest for the most commonly used statistical models, including a binary probit. On this point, see Tomz, Wittenberg, and King (2001).
The predicted probabilities say a good deal about the direction and magnitude of these factors on intolerance and how these relationships reflect age, period, or cohort effects. A higher score indicates a more intolerant view, whereas a positive number in the change column (columns 2, 4, and 6 of Table 5) means the predictor is associated with greater intolerance as compared with the hypothetical individual. Controlling for the effects of generation (see bold values in Table 5), we note that the baseline for the hypothetical individual representing the second generation is lower than that for the hypothetical parent (0.59, 0.61, and 0.67 vs. 0.71, 0.68, and 0.75, respectively). For otherwise identical individuals who differ only in cohort placement—Gen 1 or Gen 2—a substantial degree of difference exists with regard to allowing a communist to run for public office as indicated by the “Intergenerational Differences” shown at the bottom on Table 5 (12% gap in intolerance in 1965, 7% in 1973, and 8% in 1982).
Based on the “over time” readings, these results also suggest that despite the parents’ greater inclination for intolerance and the resulting generational gap, the impact generated by the predictors of intolerance are consistent across the generations. As a result, the occurrence of a predictor and the position in the life cycle that it was experienced work to differentiate members within the cohort but not across cohorts, so that members from adjacent cohorts are more alike than those within the same generation. Thus, in these analyses, the importance of the key predictors has not been modified over time, but rather, the effect is the same regardless of cohort placement. The relative stability of these relationships to intolerance serves to differentiate members within the same cohort and also maintains the substantial gap between the two cohorts.
To continue the discussion of political intolerance and how the effects of the predictors influence the patterns uncovered, the probit estimates and predicted probabilities for the second generation and their children (Gens 2 and 3) are summarized in Tables 6 and 7. The absence of additional data points limits the discussion somewhat because the aging process, particularly for Gen 3, is still very much in play. Moreover, political knowledge and social class have been excluded from the models as these variables do not exist in the 1997 survey. As we noted earlier, political knowledge in particular can be a precondition for political tolerance and its exclusion may influence the remaining predictors to behave differently than in earlier analyses. These limitations aside, the evidence presented suggests that the documented differences in opinions are due to generational effects. The Gen 2–Gen 3 comparisons shown in Table 6 add further empirical evidence to this claim, indicating that the legacy of acceptance (in Gen 2) does not extend to their offspring, Gen 3. The coefficient estimate for “Generation—Second” reported in Table 6 demonstrates that generation is a major contributor to the explanatory power of our models.
Determinants of Intolerance of Communist Officeholder: Gen 2 and Gen 3 (Probit Estimates).
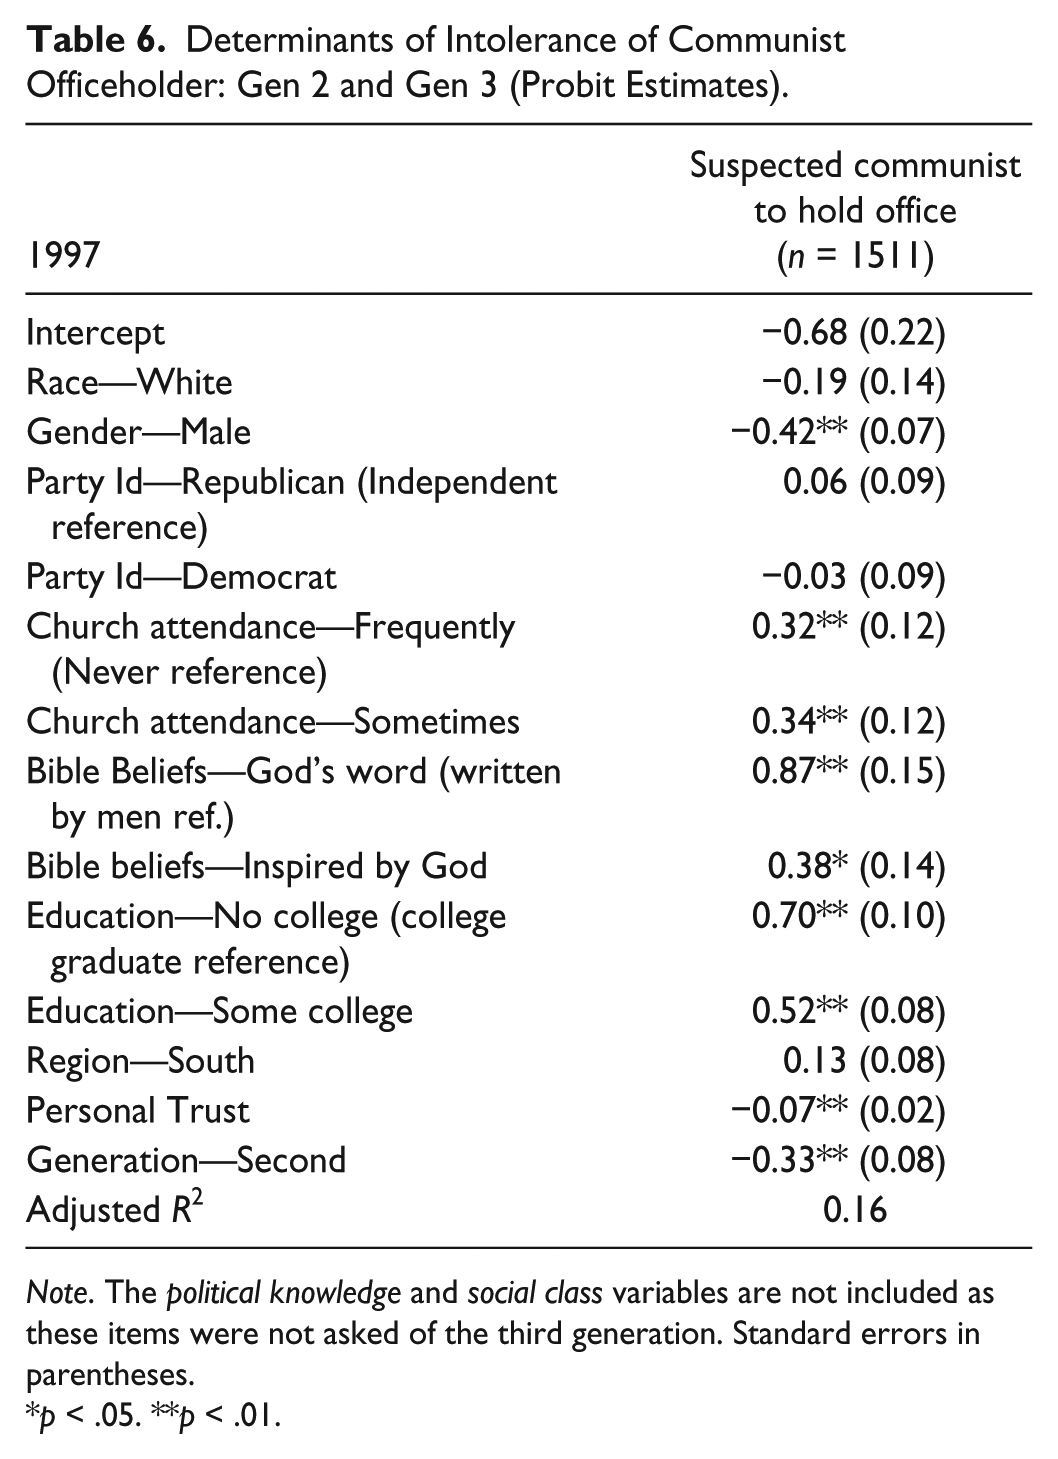
Note. The political knowledge and social class variables are not included as these items were not asked of the third generation. Standard errors in parentheses.
p < .05. **p < .01.
Probit Estimates Converted to Probabilities.

Note. Change column indicates the associated change in probability for the binary variables representing a switch from 0 1 and the associated change in the continuous variables (personal trust) as an increase of one standard deviation from the mean (with standard errors in parentheses). Intergenerational difference represents the associated difference in probability of a switch in the hypothetical individual from a member of the second generation to being a member of the third generation.
More importantly, from a trend perspective, the influence of the predictors on political intolerance is consistent with the earlier comparisons between the first and second generations, and is reflected in both intragenerational and intergenerational discontinuities. As before, we find that the impact of many of the predictors of intolerance is substantively large, and as a consequence, the generational gap is actually smaller than differences among members of the same generation. For example, Table 7 shows that educational attainment in particular works to differentiate members within, but not across, cohorts. As a result, members of adjacent cohorts are more alike (e.g., college graduates of Gen 2 have a .29 predicted probability of intolerance as compared with Gen 3’s .41 predicted probability, resulting in a 12% intergenerational gap) than members within the same cohort (i.e., a 27% intracohort gap between college graduates and those without a college education, the reference group). That education remains a relatively stable factor in terms of its connection to intolerance across the generations (regardless of the year obtained) suggests that the impact stems from the amount of education achieved, irrespective of the educational environment when it was completed.
Last, additional evidence for the “generational cleavages” explanation comes from the cross-generation (time-lag) probit and predicted probabilities (not shown, available on request). The analysis draws on same-aged individuals at different time periods, thus ruling out the influence of life-cycle effects. The figures demonstrate that rather than a convergence in opinions at similar ages (as is required with the aging explanation), generation is a major contributor to the explanatory power of the models (p < .01). Compared with their parents and children at comparable moments in their life stage, the patterns tell a familiar story uncovered earlier: Members of the second generation are less intolerant in youth (8% difference) and middle age (11%) than their children or parents.
Conclusion
The analyses presented here have taken the tolerance discussion a step forward by focusing on a specific civil liberty and investigating the importance of three models—life cycle, generational, and period effects—that could account for intolerance patterns and trends. Moreover, the study provides a stringent check of the generalizability of our current understanding of the sources of intolerance over an individual’s life span.
At the outset, we outlined several questions we wished to address. The first question asked how political intolerance changed over time and across generations, and contingent on the answer to this first question, what was the source of the change? In terms of both of these questions discussed above, the results make several important theoretical points. First, our results suggest that intolerance is not explained by a life-cycle effect. Certainly, we find no support for the proposition that “we all get more conservative as we age” as the evidence presented actually supports the contrary position. The Stoufferian prediction—a decrease in intolerance through cohort replacement—fits the facts very well. The longitudinal and contemporaneous gaps in tolerance opinions imply that the persistent age differences in political intolerance appear attributable to a generational argument. In some cases, the gap between the first and second generations is too large to explain away by the effects of aging alone. The older cohort was more intolerant than the two younger generations, and the second generation became less intolerant rather than more, as expected by the life-cycle hypothesis, with age. The overtime generational comparisons show that the difference is relatively constant, which undermines any sense of gradual and consistent change as one ages.
Rather, the findings reveal that these age-based patterns can be explained, for the most part, by the political, economic, and social environments in which the generations were raised. The cohort differences are such that the more recent generations are less intolerant than the earliest cohort. The differences in attitudes toward communist officeholders continue even after controlling for compositional differences in race, gender, education, religiosity, party identification, social class, region, personal trust, and knowledge. Put differently, when all else is equal, intolerance declines considerably across birth cohorts. Thus, change in intolerant attitudes is independent of other changes in the population, as measured here. Moreover, because the study examines intolerance, when we observe that more recent cohorts are less willing to deny the rights and liberties of others than the oldest generation (Gen 1) in all survey years, this reflects true generational differences, and not generational differences in opposition. These are the major findings of this research.
Second, the evidence suggests the uniqueness of the second generation. The age-based patterns summarized earlier indicate that the most important influence on intolerant orientations was the unique circumstances in which the second generation first acquired their viewpoints. The younger cohort was at the most politically impressionable ages (under 30 years) during the turbulent decade of change, the 1960s. Their preferences are definitely less intolerant than the cohorts who preceded or followed them. The general pattern, regardless of the changes taking place in their personal lives and society, was a fundamental commitment to allowing a suspected communist to run for public office.
In general terms, period effects are causes of public opinion that affect all cohorts at the same time and produce a general shift in public opinion in some direction. The data show a growing acceptance for communist officeholders over the panel period. Indeed, substantial positive aggregate movement was captured suggesting the importance of historical happenings regardless of cohort placement. In sum, the contributions of the three age, period, and cohort dimensions suggest that cohort and period effects largely explain the longitudinal modifications that occurred while age effects were relatively unimportant.
Finally, the focus on one specific manifestation of intolerance as a test of the applicability of the Sullivan et al. model has proven to be beneficial. Not only have the results confirmed the relevance of key predictors across birth cohorts and time periods but also how social and cultural changes may influence the impact of these predictors to intolerance. First, the results reveal that the impact of many of the predictors is substantially large and works to differentiate individuals “within” a generation. As a consequence, the generation gap is actually smaller than the intracohort differences among members of the same generation. Second, among the tolerance determinants, political knowledge and education emerge as strong predictors. This finding squares with the extant literature because it is widely assumed that higher levels of education would expose individuals to differing viewpoints and discourage intolerance (Gibson, 1992; Stouffer, 1955; Sullivan et al., 1982).
Similarly, a large body of research shows that increased education—especially a college experience—tends to socialize students to have more tolerant and cosmopolitan views of the world (e.g., Bobo & Licari, 1989; Campbell, Converse, Miller, & Stokes, 1960; Erikson, Luttbeg, & Tedin, 1991). The size and direction of the educational coefficients illustrate the power of this relationship. An important and related point here is that although education continues to distinguish members within a cohort, the evidence demonstrates that, despite having obtained their education under quite dissimilar conditions, the effect of a college degree works to “minimize” cross-generational differences. An expectation attached to higher education is that absolute levels (sum of education achieved) are important because educational attainment works in a positive direction in its influence on political tolerance (Nie et al., 1996).
The impact of education on tolerance opinions may, however, depend on relative (age, or historical and political period attended) levels or both (on this point, see Nie et al., 1996). That educational achievement remains a reasonably stable fixture in terms of its connection to intolerance across the two generations, regardless of the year obtained, suggests the impact stems from absolute achievement. Moreover, the education relationship continues regardless of life stage suggesting a more permanent divergence between individuals at opposite ends of the educational spectrum and regardless of generational placement.
The existence of tolerant procedural norms is an important condition on which a modern democracy rests. These comparisons offer illustrations and evidence that can be used to further our understanding about the formation and continuity of politically intolerant opinions. The longitudinal patterns indicate the source of support for allowing a suspected communist to run for public office has more to do with the formative experiences of the younger generations than social and demographic differences. We realize, of course, that these conclusions are based on an examination of a single manifestation of intolerance using a four-wave national panel study, but it seems to us that these findings are consistent with what a number of other scholars have concluded about intolerance of communists. A number of empirical studies show that Americans remain deeply divided in their views of communists and yet increasingly support their civil rights (Gibson, 1992; Mondak & Sanders, 2003; Peffley & Sigelman, 1990). We reach the same conclusion but with the certainty that is only possible with panel data.
Footnotes
Appendix A-Research Design for Longitudinal Analysis of Political Tolerance
| Survey year |
|
|
|
|
|
|---|---|---|---|---|---|
|
|
|
||||
| Average age | 18 | 26 | 35 | 50 | 935 |
|
|
|||||
| Average age | |||||
| All parents | 46 | 54 | 63 | — | 898 |
| Younger parents | 41 | 49 | 58 | — | 448 |
|
|
|||||
| Average age | |||||
| All children | — | — | — | 23 | 779 |
| Older children | — | — | — | 27 | 379 |
|
|
|||||
| A. Single generation over time—Gen 2: 65, 73, 82, 97; Gen 1: 65, 73, 82. | |||||
| B. Contemporaneous cross-generation comparisons—G1:65-G2:65; G1:73-G2:73; G1:82-G2:82; G2:97-G3:97. | |||||
| C. Cross-generation (time-lag) comparisons—e.g., G1:73-G2:97; G2:73-G3:97. | |||||

Appendix B-Measures and Index Construction
Intolerance Item (Agree/Disagree):
Appendix C:Report Agreement/Discrepancy for Allowing Communist Officeholder (1965-1997)
| 1965-1973 | 1973-1982 | 1982-1997 | ||||
|---|---|---|---|---|---|---|
|
|
|
|
|
|
|
|
| Gen 1 | 69% | 31% | 77% | 23% | n/a | n/a |
| Gen 2 | 63% | 37% | 79% | 21% | 81% | 19% |

Note. Responses were coded as either “consistent” or “discrepant” for allowing a communist officeholder for each wave of data as compared with the next. Consistent reports for each time period (e.g., 1965-1973) included individuals who gave either a tolerant or intolerant response at both waves of data collection. Respondents categorized as discrepant included those who reported a different response in the prior wave as compared with the subsequent wave of data collection.
Authors’ Note
Authors are listed in no particular order.
Declaration of Conflicting Interests
The author(s) declared no potential conflicts of interest with respect to the research, authorship, and/or publication of this article.
Funding
The author(s) received no financial support for the research and/or authorship of this article.