
Abstract
This study examines the spatial polarization that characterizes the dwellings in the African leading megacity of Lagos. Data were collected through an extensive housing survey carried out on 1,485 household residences in 56 wards within 12 administrative units in Lagos megacity. The spatial dimension of residential density in the city generates three unique residential patterns which are low residential density (LRD), medium residential density (MRD), and high residential density (HRD) areas. Descriptive and multivariate inferential statistics were used to render explanations for the spatial variations in the residential quality variables in the study area. Findings indicated that a clear difference exists in the residential quality within the three residential density areas of Lagos. High correlations exist among the residential quality indicators and housing type. The principal component analysis shows that residential polarizations that occur in the LRD, MRD, and HRD are based on the location, dwelling facility, interior and exterior quality, neighborhood integrity, social bond, barrier to entry, and security. The practical implications of residential polarizations along the residential density areas are explicitly expressed.
Introduction
Over the years, urban scholars’ analyses of residential polarization have generally followed two diametrical paths: those that focus on revealing the residential pattern based on dwelling and neighborhood quality and those that strive to provide explanations for such pattern (Abumere, 1994; Harvey, 1975; Hwang & Quigley, 2004; Kain & Quigley, 1970). Housing as a field of study cuts across virtually all social and technological sciences with each proffering solutions to a set of perceived problems. Urban polarization is a common research problem to all social scientists although geographers are keener about spatial polarization of human activities including housing than other social scientists. While the sociologists attempt to view residential differentiation as resulting from the tendency for racial segregation (Krivo, 1986), the economists tend to look at residential differentiation as an outcome of choice behaviors resulting from the tendency to maximize utility (Cirman, 2006; Quigley, 1985). Sociological and economic explanations of residential differentiation are fraught with serious problems (Harvey, 1975). First, sociological explanation does not provide insight beyond emphasizing the rather simplistic notion that people of the same racial provenance live closely together, and second, the neo-classical economic theory of utility maximization which emphasizes differentiation based on consumer behavior does not explain the spatial pattern of human activities sufficiently.
However, the geographic view of residential polarization assumes that the spatial aspect of housing quality imposes on the cityscape a peculiar pattern which influences choices (Aliu, 2012; Briggs, 2005; Harvey, 1975). Of all urban land uses, housing perhaps gives the city its most glaring image and form and this is partly because housing constitutes the largest land use and partly because housing is a complex physical stock. In developing economies, urban housing markets are often characterized by both quantity and quality variations which make home decision making quite problematic (Agbola, 2005; Ajala & Adelodun, 2007; Aluko, 2000). Generally, in terms of quantity, price, and quality, the housing market is never a monolithic structure, but a set of submarkets that display complex spatial variation (Abumere, 1994; Aluko, 2000; Hwang & Quigley, 2004). The nature and basis of residential polarization in Nigerian cities within the contemporary spatio–social realities have however remained insufficiently explained.
The focus on Lagos residential condition is exciting for a number of reasons. First, Lagos is a rapidly growing megacity with a globalizing posture. The city has existed precariously and resiliently from the colonial era assuming a cosmopolitan look in the process of growth and evolution. Second, it occupies a privileged position on the National City hierarchy as the first seat of colonial power, the first capital city of Nigeria, and obviously the most industrialized region in the whole West African sub-region. Third, Lagos possesses the most developed housing market in Nigeria (see Aluko, 2000). There are three discernible spatial patterns of housing structures in Lagos: the high-density-low-quality residential, the medium-density-medium-quality residential, and the low-density-high-quality residential areas (Aluko, 2000; Oduwaye, 2005). These are differentiated intra-city regions with peculiar residential quality, price, and socioeconomic characteristics.
The objectives of this study are to
describe and summarize the polarization of residential quality indicators in the study area,
analyze the correlations between the residential quality variables,
explore the residential quality components within the residential density areas of the city, and
offer practical implications of the polarization of residential quality in the megacity of Lagos.
This article contributes to literature on housing polarization in three ways: (1) It gives a fresh empirical explanation on the residential polarization that exists in Lagos megacity, (2) it confirms the assumption that variation in residential quality reflects a medley of home attributes, and (3) it reinforces the theory that these attributes can be collapsed into a few quality variables.
Theoretical Premises
There are divergent opinions among scholars on what actually generates residential polarization within a given locality or political entity. While some ascribe residential polarization to the external and internal designs of dwellings, others canvass the environmental quality proposition such as public facilities available within the neighborhood (Ajala & Adelodun, 2007; Aliu, 2012; Aluko, 2000). Majorly, it is the residential quality differentials that account for urban social polarization although, social, economic, and cultural differences play obvious role. Urban scholars often conceive residential quality as minimum livable conditions of a residential dwelling in terms of structural design, dimension of space, and environmental suitability (Mabogunje, Hardoy, & Misra, 1978; Sumka, 1979). In addition, residential quality emphasizes structural solidity and durability, basic services provision, unfettered accessibility, security of tenure, security, choice, and reduction of crowdedness (Agbola, 2005). Putting the concept of residential quality in proper perspective, Aliu (2012), in a recent study, defines residential quality as the structural as well as the neighborhood attributes of dwellings in a specific location.
Theoretically, as indicated in Figure 1, housing possesses three physical quality dimensions: location, structural, and neighborhood quality. The structural quality reflects the intrinsic values of houses, the location quality reflects the positional attributes of dwelling, and the neighborhood quality reflects the extrinsic values of the neighborhood where houses are located (Ajala & Adelodun, 2007; Aluko, 2000; Arimah, 1992; Goodwin, 1977; Hwang & Quigley, 2004). At the theoretical level, residential quality can be measured in terms of accessibility, drainage, serenity, security, parking, environmental sanitation (neighborhood quality); proximity to work, children’s schools, shopping centers, places of worship, friends, and relations (location quality); and house type, number of rooms, room space, toilets, baths, water sources, patio, kitchen, lot size, and aesthetics (structural quality). However, residential quality is very controversial and has been shown to be unique to different races (Mabogunje et al., 1978). There is no universal residential standard that is acceptable to all societies of the world. Geographical and ethnographic peculiarities define more often the type of housing quality and standard that prevail within a particular socio–cultural setting (Dewilde & De Keulenaer, 2003; Rapoport, 2001).
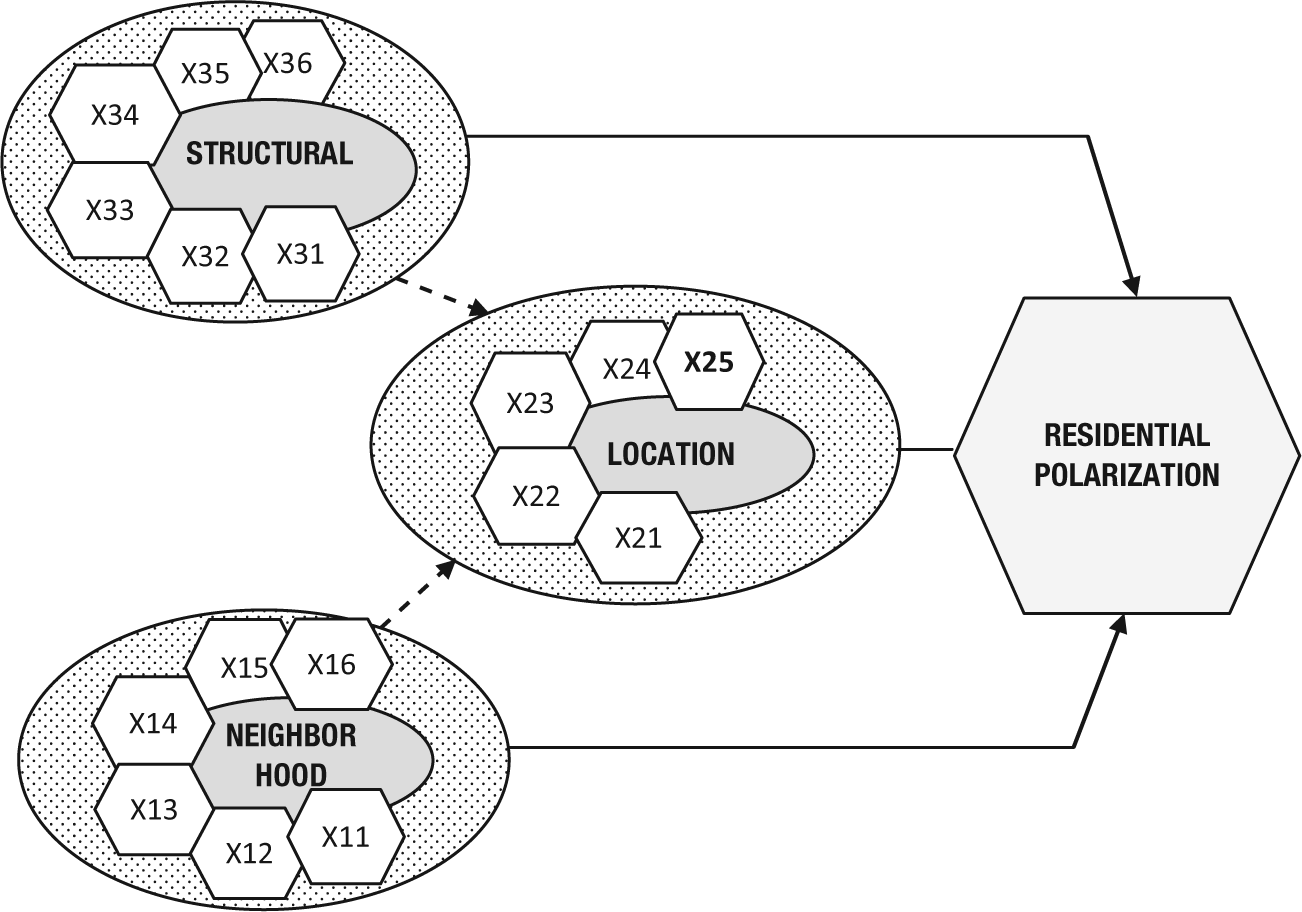
A model of residential polarization.
The intra-city or spatial differentiation in housing quality has two theoretical premises. The first is the ecological model of residential polarization. The proponents of this theory canvass the argument that the cityscape would naturally be characterized by land uses especially residential land uses which would be antagonistic to one another and therefore display variegated patterns as each land use tends to serve a particular interest of the urban dwellers. The ecological model of residential polarization draws tremendously from the works of classical ecological scholars notably Burgess (1925), Hoyt (1939), and Harris and Ullman (1945). The second theoretical premise on which intra-city residential differentiation is based is the neo-classical economic rationalization model. The neo-classical economists have continued to remonstrate about the operation of the housing market which subsists on the invisible price mechanism. To the neo-classical school of thought, the housing market condition, which is invariably imperfect, determines the nature of housing that permeates a given location and also the socioeconomic condition of a place will go a long way to define the existing quantity and quality of housing therein (Adams, 1986; GilderBloom, 1980). In another way, the quality of dwellings provided, in a place or region, depends on the socioeconomic status of the builders. In poor societies where people struggle to have property, the structural and neighborhood facilities of houses are hugely compromised, and because most renters make do with what is available, these forms of housing are taken by the city dwellers that are less economically privileged (Aliu & Adebayo, 2010). However, theoretically this study leans toward the ecological model for its adequate depiction of spatial polarizations in urban land uses especially housing.
From theoretical evaluation of spatial polarization of housing, we can therefore hypothesize that there is generally a significant variation in the housing quality within the city region. Given the socioeconomic and cultural reasons, housing often displays not only inter-market variations but intra-market differentiation in quality. As there are differences in housing quality from one city to the other or one country to the other, there are also differences in quality from one neighborhood to the other. Residential quality therefore can be perceived along varying geographical scales: global, regional, and local. In this study, the differences in residential quality in three density areas of Lagos city is considered.
Study Area
Geographically, Lagos state is located between longitudes 2o 42’and 4o 20’ East and latitudes 6o 22’and 6o 42’ North. Located in the South Western region of Nigeria, Lagos State is bounded in the east and in the north by Ogun State, in the south by the Atlantic Ocean, and on the western flank by Republic of Benin (see Figure 2). It occupies a total land area of 3,577 km2 representing 0.4% of Nigeria. Given the small land area of Lagos, it invariably remains the smallest state in Nigeria. Lagos State is characterized by tropical high climate, with high temperature, high humidity, and heavy rainfall, two rainfall peak regimes in June and October. The microclimate is also influenced by the proximity to the ocean. The rainy season in Lagos generally starts in April extending to October with a short cool but dry spell in August (August Break).

The study area—Lagos megacity region.
Lagos is the most urbanized and industrialized region in Nigeria (Odumosu, 2004; Peil, 1991). It has a population of about 10 million people, out of which about 8 million (80%) live in the metropolis (National Population Commission Census, 2006). Lagos is now a globalizing megacity, with over 10 million people, and by 2020 its total population is projected to be about 15 million (United Nations Habitat, 2008). Lagos State consists of 20 local government areas (LGAs) among which 17 are within the megacity region. Twelve LGAs namely Ajeromi-Ifelodun, Agege, Lagos Island, Oshodi-Isolo, and Mushin (high residential density [HRD]); Amuwo-Odofin, Lagos Mainland, Somolu, and Surulere (medium residential density [MRD]); Ikeja, Apapa, and Eti-Osa (low residential density [LRD]) form the study area for this research (see Figure. 2). Research on housing conditions in Lagos has been for a long time (see Abiodun, 1976; Ekanem, 1995). More recent studies reveal a predominance of multiunit housing and differentiated housing markets (Aliu, 2012; Aluko, 2000; Jiboye, 2009).
Research Design
Data and Method
Data used for this study are mainly from primary sources. According to Arimah (1992) and Aluko (2000), primary data if collected carefully are of higher accuracy than the secondary data. A multi-stage systematic random field survey was conducted in 56 wards of 12 LGAs of Lagos to acquire the primary data needed for the study. As many as 1,485 copies of structured questionnaires were administered on household heads within the study area. The study area was divided into three residential density areas, namely, the LRD, the MRD, and the HRD areas, and questionnaires were distributed in the residential areas in the ratio 1:2:3, respectively. To ensure representativeness, the questionnaire distribution followed the population densities of the residential areas; hence, the highest questionnaires were administered in the HRD which constitutes the most densely populated area and the lowest in the LRD which is the least populated area. This means that one sixth of the questionnaires making 270 were distributed in the LRD, one third making 486 in the MRD, and one half making 729 in the HRD. The questionnaires were collated, coded, and analyzed using different descriptive and inferential techniques in the Statistical Package for Social Scientists (SPSS version 17).
Measures of Variables
Residential quality variables are expansive and best measured by considering the exterior, environmental, and structural variables of dwellings (Ajala & Adelodun, 2007; Aliu, 2012; Aliu & Adebayo, 2012; Aluko, 2000). Hence, residential quality data in this study were measured by 20 neighborhood and structural quality variables, and these are presented in Table 1. These are the attributes of dwellings that are associated with the dwellings occupied by Lagos residents at the moment. The variables were drawn from both empirical literature and standard residential surveys on housing studies in Lagos in recent time (see Aliu, 2012; Aliu & Adebayo, 2012; Aluko, 2000).
Residential Quality Variables Used.

Analytical Techniques
Three analytical techniques are used to analyze the collected data in this study. The first analytical technique involves the use of descriptive statistics such as mean, cross tabulation, and percentage frequency distribution. These are univariate analytical methods that were used to describe and summarize residential quality data. The second analytical technique is the correlation statistics used to establish association between pairs of residential quality variables. The third technique is the principal component analysis (PCA). The PCA technique is a multivariate statistical technique that has as its objectives to take p variables ωs (standardized original variables) and to find linear combination of these to produce indices Zs that are orthogonal (Robinson, 1998). PCA is a data-reduction technique which is used in this study to reduce many variables on location, neighborhood, and structural characteristics of dwellings in the study area to a few important components and thus explain level of contribution to total variation observed in the residential quality data. According to literature, PCA can be used in this way to explore the latent components that underline patterns exhibited in a particular region or delineated area (Hardy & Bryan, 2006; Neuman, 1997; Robinson, 1998). Several regional studies have found the usefulness of PCA as an exploratory framework (Aliu, 2012; Aliu & Adebayo, 2012; Oduwaye, 2005). In this study, the PCA is also used to explore the residential components that account for differentiation in residential quality in three residential density areas of Lagos megacity region. The PCA furnishes us with the information concerning variables that are important using their explained variations and thus reduce the dimensionality of the data used. The PCA follows sequentially in aggregating the component loadings through a set of constructs as represented in Equation (1):

where Z is the loading score as a component variable which according to Keiser criterion should not be less than 1, α1p represents the variance loading on component variable, and ωp represents the original variables. But α1p represents the weight of var (Z) = Z1, Z1 = α′1ω′ωα1 is maximized and this is subject to the constraint given in Equation 2:

For PCA, the variances are the Eigenvalues of the covariance matrix and their extracted proportions vary in accordance with the sequence as described in Equation (3):

From Equation (3), it is expected that the first component would make higher contribution to the total variance than the second, and the second would make higher contribution than the third, and so on and so forth. Three parameters are significant in the application of PCA results for pattern description. These are the latent variable variance (component), the total variance, and the corresponding variance loadings of original variables on the components (Robinson, 1998). The Keiser, Meyer, and Okin (KMO) parameter available in the SPSS 17 package provides a test of the adequacy of data used, and the higher the KMO the more reliable the data. The PCA statistical tool is useful in sieving the variables of redundancy and therefore emphasizing the more relevant variables (Hardy & Bryan, 2006). The PCA method is used to extract the relevant residential quality variables that are crucial to the explanation of residential polarization in the study area. However, methodologically Varimax method which allows orthogonal rotation was used to produce uncorrelated component loadings and outputs that are more comprehensible for the explanation required in the study (Aliu & Adebayo, 2012; Oduwaye, 2005).
Results and Discussion
Descriptive Analysis of Residential Polarization in Lagos
Residential quality features are broadly explained in two ways, namely, neighborhood and structural features. Eleven variables are used to describe the quality of residential neighborhoods and these include metropolitan characteristics, security, accessibility, layout, and environmental quality. Others are spatial proximity to workplace, school, market, worship places, hospital, and closeness to friends and relations (Table 2). As indicated in Table 2, houses that are located in the city core areas are barely 34.3% compared with 65.7% that are located in the outer-city core areas. Majority of the houses are in neighborhoods closer to places of work, hospital, children schools, religious centers (churches and mosques), and local markets or shopping centers. These spatial patterns reflect the tendency among the residents in the study area to minimize the cost of transportation to the activity places (Aliu, 2012; Hoong & Foong, 2006). Accessibility is viewed in this study as having unhindered opportunity to public transport by the residents. There are two categories of accessibility namely limited accessibility and reasonable accessibility. Findings as shown in Table 2 indicate that majority of the dwellings in Lagos, which is 82.9%, are situated in areas that are reasonably accessible to public transport. Large proportions are also in mixed layout, good environmental quality, and formal security neighborhoods.
Neighborhood Quality Indicators of Households’ Residential Units.

Source. Authors’ Field Survey (2011).
Note. ARD = all residential density; LRD = low residential density; MRD = medium residential density; HRD = high residential density.
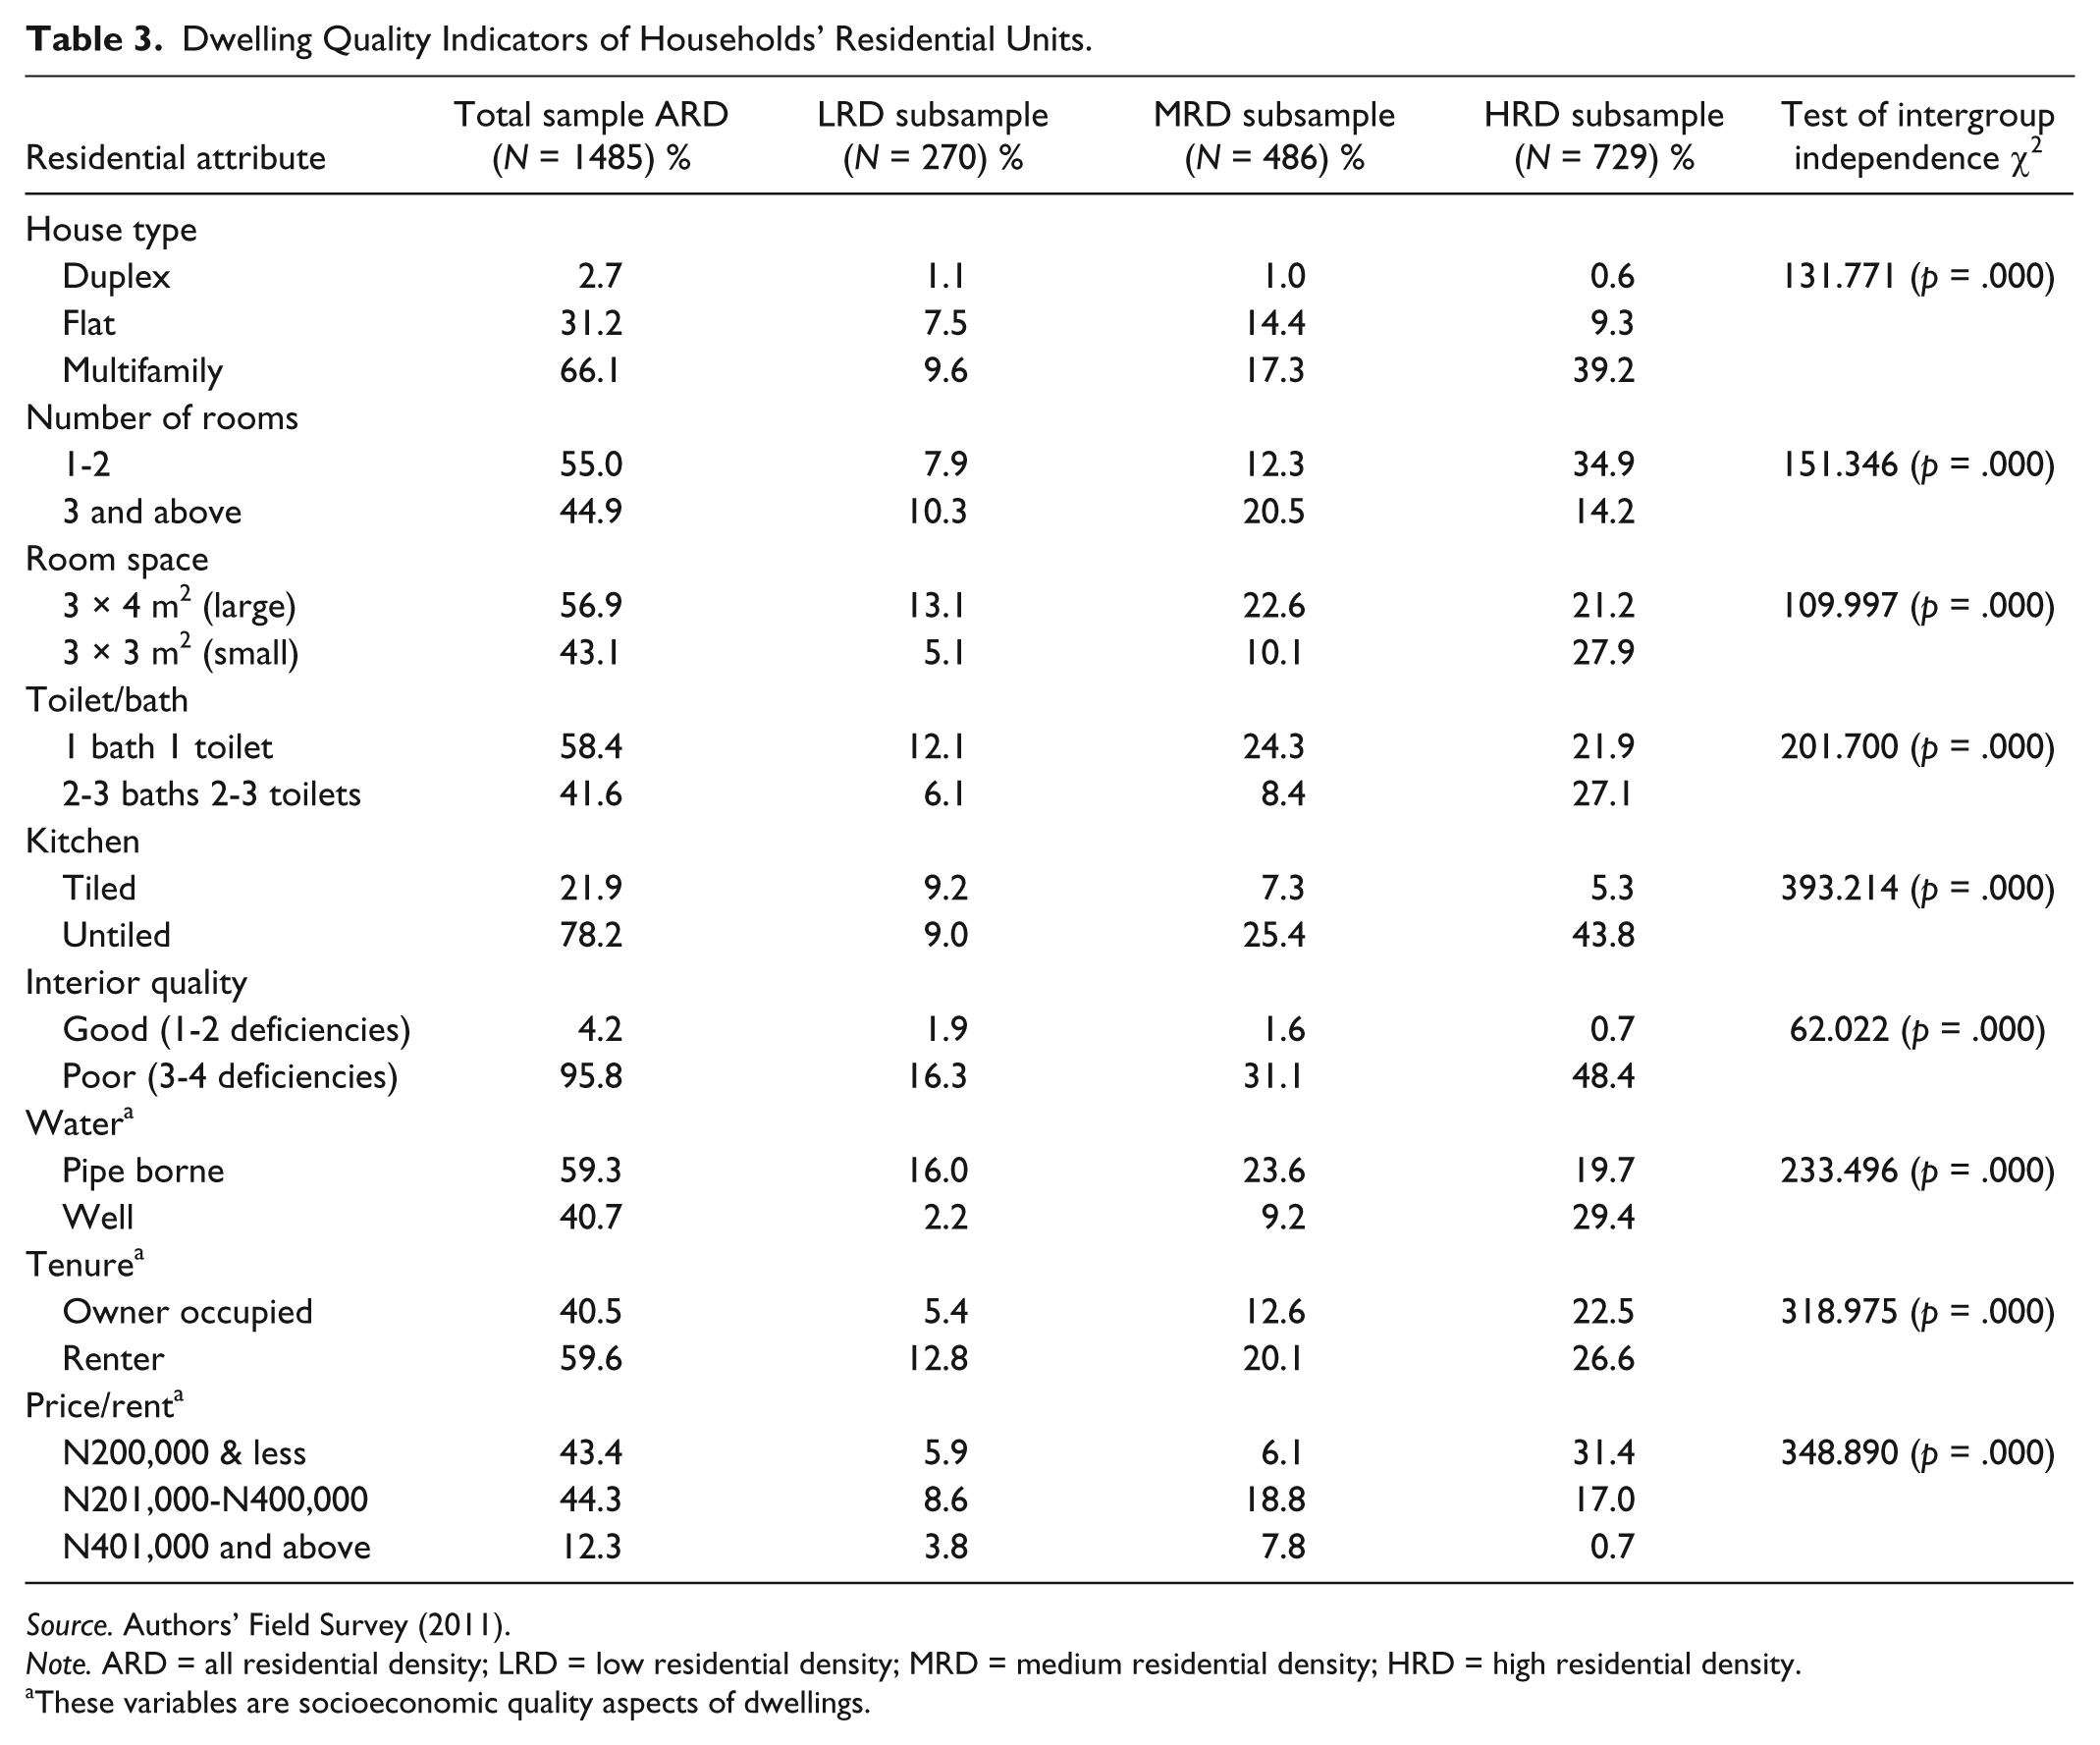
The structural features of dwellings in Lagos are described by six variables. The first is the housing type of dwelling units in the study area. As presented in Table 3, analysis indicates that majority (66.1%) of the dwellings are multi-family unit localized as “face-me-I-face-you,” 1 while 31.2% are flats, and 2.7% are duplex. The preponderance of face-me-I-face-you housing units in Lagos has been well explained in some recent studies (Aliu & Adebayo, 2010, 2012). The second is the number of rooms in each dwelling unit. Number of rooms is categorized into two that is 1 to 2 rooms and 3 rooms and more. According to information in Table 3, majority of the houses representing 55% contain 1 to 2 rooms. The third structural quality observed in the study area is the room space in the dwelling units, and findings indicate that 56.9% consist of large living rooms (see Table 3). The fourth attribute of the dwelling units studied is the number of toilets and baths provided within each dwelling in the study area. Analysis indicates that 58.4% of the dwellings have 1 bath and 1 toilet facility, and the rest (41.6%) of them possess 2 to 3 toilet and bath facilities. The fifth structural quality variable of the dwelling units examined is the nature of the Kitchen provided and results show that 78.2% of the units actually have untiled kitchen, compared with 21.8% of the units that do have tiled kitchen. The sixth attribute is the interior design of the dwelling and results presented in Table 3 also indicate that about 96% of the dwellings can be said to be of poor quality given their interior conditions. These results confirm recent observations on dwelling conditions by previous studies in Nigerian cities (Ajala & Adelodun, 2007; Aliu & Adebayo, 2010, 2012; Aluko, 2000; Arimah, 1992).
Dwelling Quality Indicators of Households’ Residential Units.
Source. Authors’ Field Survey (2011).
Note. ARD = all residential density; LRD = low residential density; MRD = medium residential density; HRD = high residential density.
These variables are socioeconomic quality aspects of dwellings.
Other residential quality variables (which are not strictly speaking structural attributes of dwellings, but rather socioeconomic quality attributes) include water supply, tenure type, and annual rents. On the account of the type of water available in the dwelling units, analysis shows that 59.3% of the dwellings in Lagos have pipe-borne/borehole water as against 40.7% dwellings with well/water vendor. The issue of tenure often reflects in the macro-economic performance of the country and it is a measure of urban economic performance (Krivo, 1986; Towry-Coker, 2012). The tenure type is split into two that is owner-occupier and renter. From information in Table 3, the rental dwellings form the majority making 59.5%, while the rest of the dwellings have owner-occupier. And last, the dwelling unit costs or rents are considered for analysis. Results indicate that dwelling units with a rent of N201,000 to N401,000 per annum are in the majority (44.3%) compared with others: N200,000 and less (43.4%) and N401,000 and above (12.3%) rents per annum. The spatial patterns of these residential quality variables indicate significant intergroup independence with chi-square (χ2) values all significant at 99.9% alpha levels.
Bivariate Analysis of Residential Polarization in Lagos
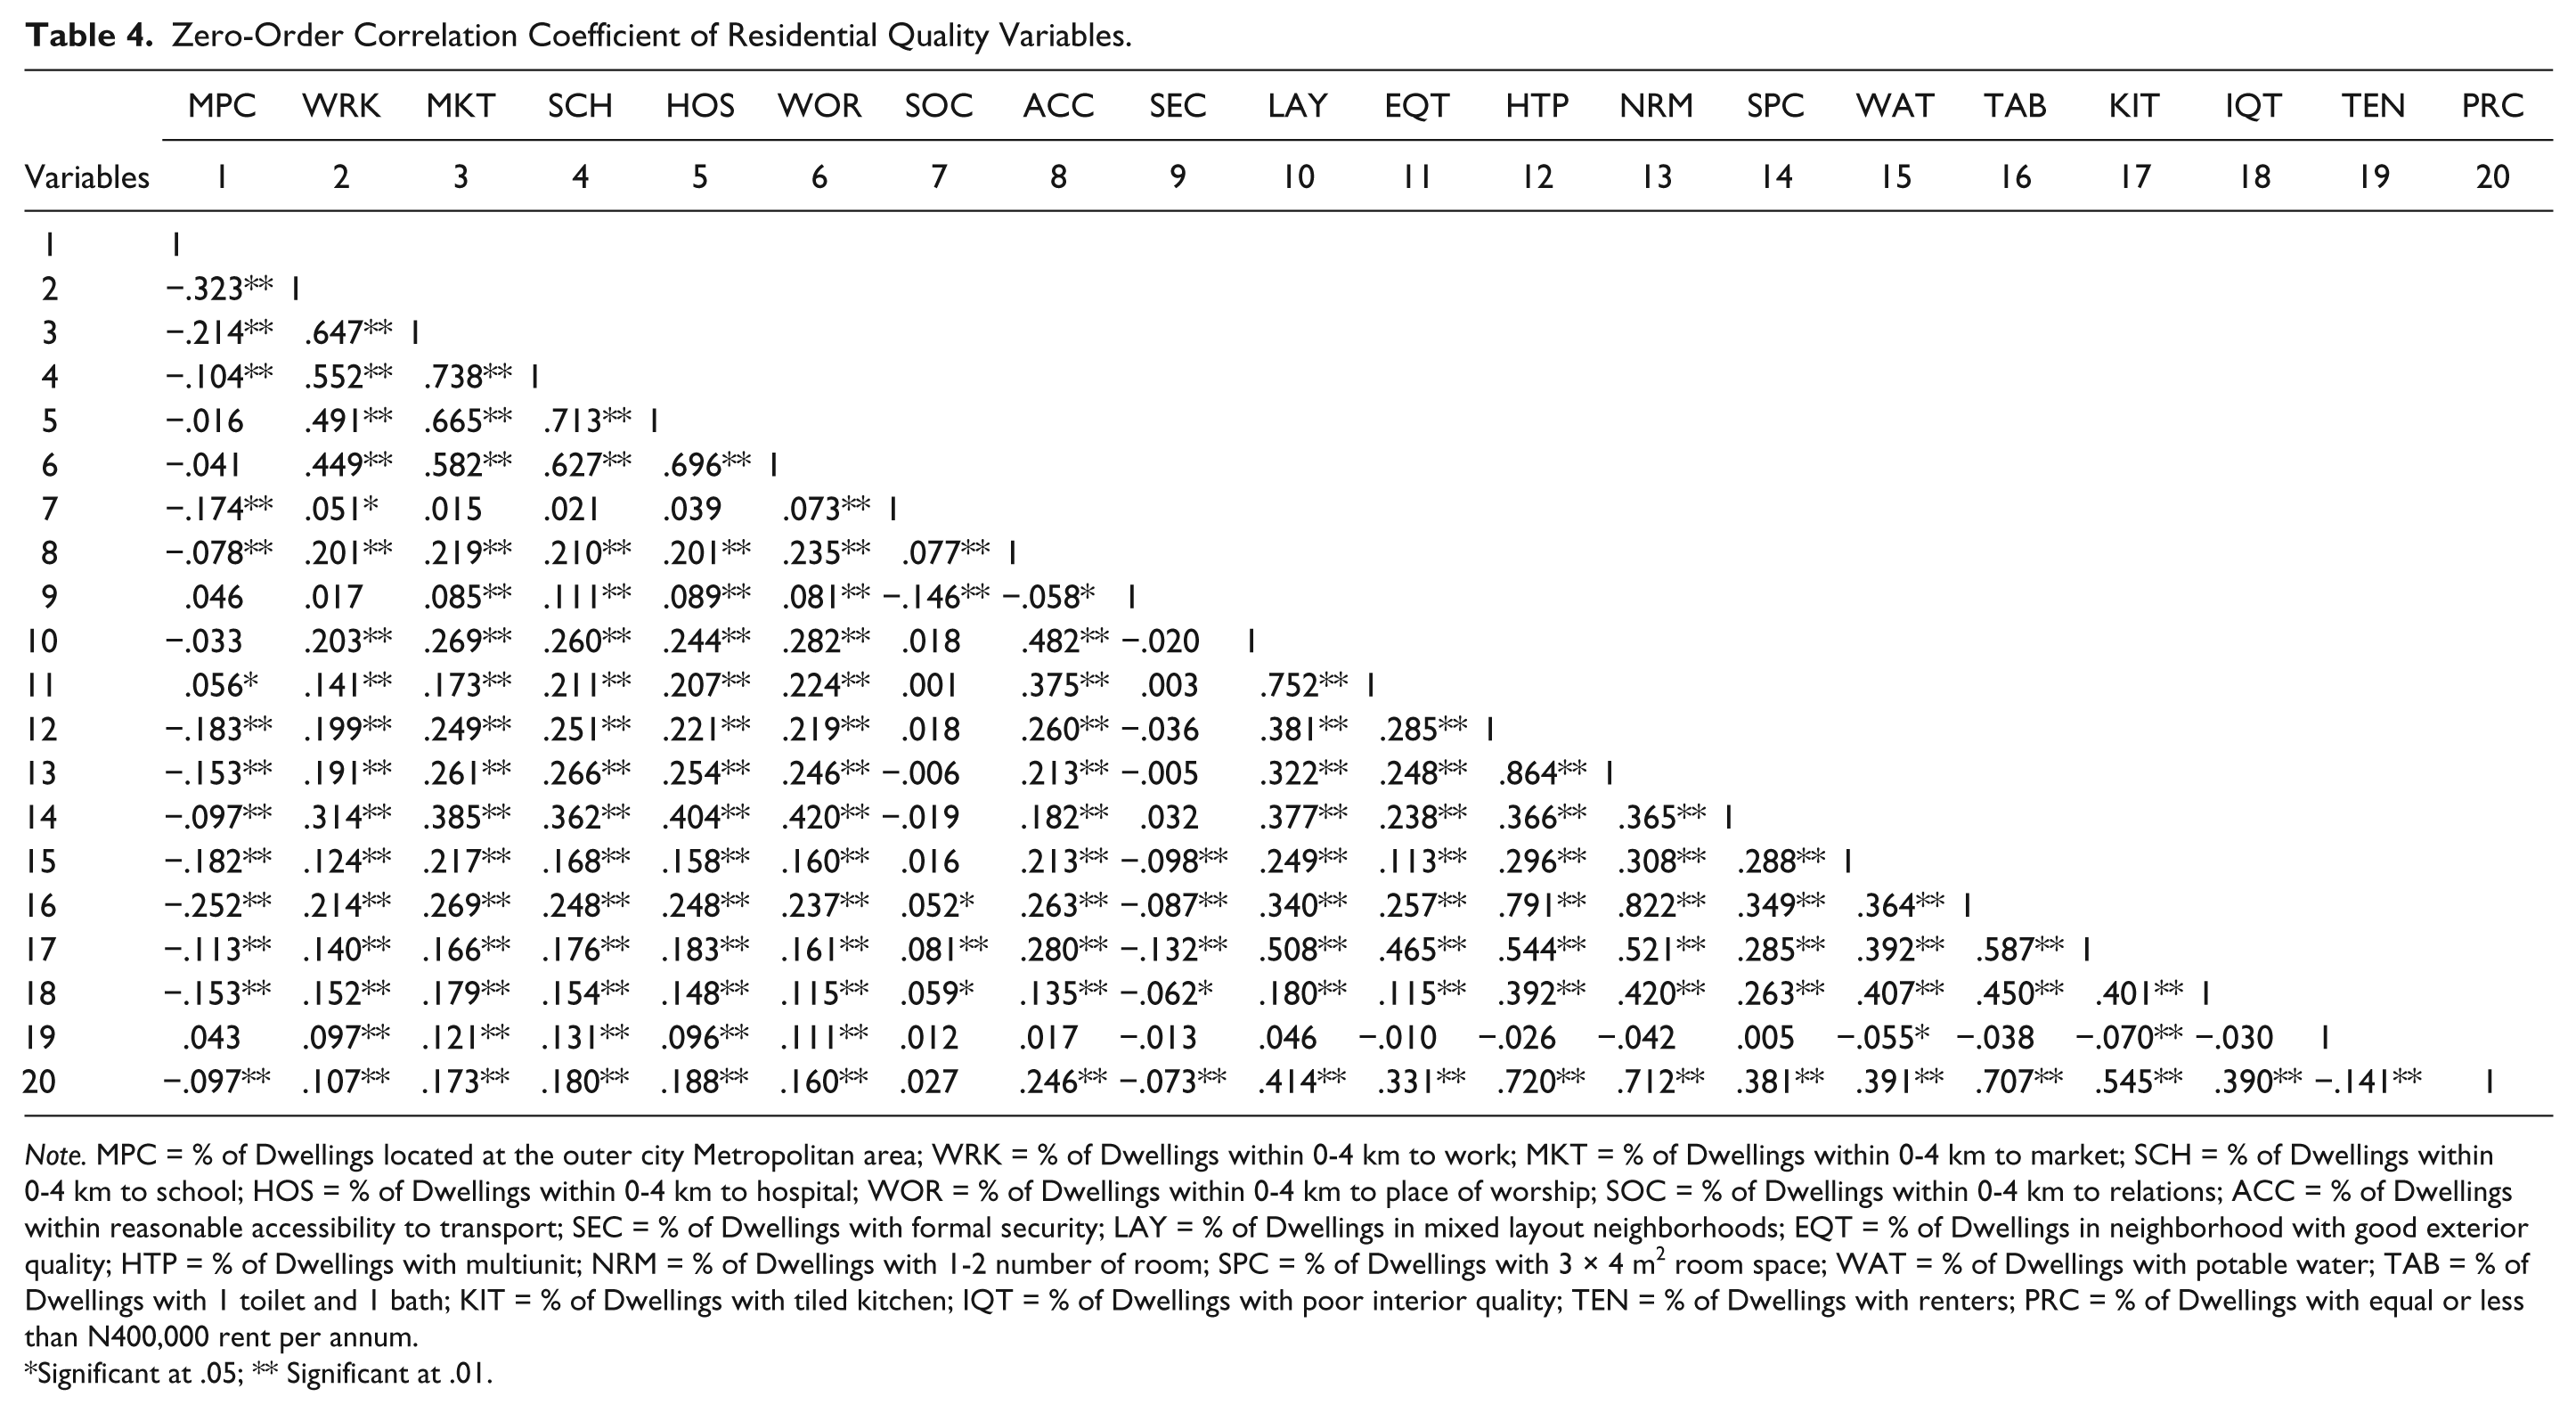
The normal practice when using PCA as an exploratory framework is to begin with the correlation of the variables of interest as this provides the initial insights into the nature and extent of associations among the variables (Aliu & Adebayo, 2012; Hardy & Bryan, 2006; Robinson, 1998). In this study, there are 20 residential variables of interest. Bivariate zero-order correlation analysis shows that these variables correlate to a lesser degree with one another. According to information in Table 4, the highest correlations exist between multiunit house type and 1 to 2 room units (r = 0.864) as also between 1 toilet/bath and 1 to 2 room dwellings (r = 0.822). The lowest correlations exist between dwellings with formal security and neighborhood with poor exterior quality (r = 0.003) and between 0 to 4 km proximity to relations and neighborhood with poor exterior quality (r = 0.001).
Zero-Order Correlation Coefficient of Residential Quality Variables.
Note. MPC = % of Dwellings located at the outer city Metropolitan area; WRK = % of Dwellings within 0-4 km to work; MKT = % of Dwellings within 0-4 km to market; SCH = % of Dwellings within 0-4 km to school; HOS = % of Dwellings within 0-4 km to hospital; WOR = % of Dwellings within 0-4 km to place of worship; SOC = % of Dwellings within 0-4 km to relations; ACC = % of Dwellings within reasonable accessibility to transport; SEC = % of Dwellings with formal security; LAY = % of Dwellings in mixed layout neighborhoods; EQT = % of Dwellings in neighborhood with good exterior quality; HTP = % of Dwellings with multiunit; NRM = % of Dwellings with 1-2 number of room; SPC = % of Dwellings with 3 × 4 m2 room space; WAT = % of Dwellings with potable water; TAB = % of Dwellings with 1 toilet and 1 bath; KIT = % of Dwellings with tiled kitchen; IQT = % of Dwellings with poor interior quality; TEN = % of Dwellings with renters; PRC = % of Dwellings with equal or less than N400,000 rent per annum.
Significant at .05; ** Significant at .01.
Among the structural quality variables house type, number of rooms, toilets, and baths, kitchen, and price have high and significant correlations with a number of other variables. For instance, house type is highly and significantly correlated with number of room (r = 0.864), toilet and bath (r = 0.791), kitchen (r = 0.544), and price (r = 0.720). This means that housing types are associated with rooms, number of toilets and baths, nature of kitchen, and home rentals level. Number of rooms is also significantly correlated with toilets and baths (r = 0.822), kitchen (r = 0.521), and price (r = 0.712). The association between price and number of rooms is understandable as room number is a function of cost per room. Toilet and bath correlates with kitchen (r = 0.587) and price (r = 0.707) and kitchen correlates highly with price (r = 0.545). However, three variables stand out very distinctively among the neighborhood variables in their unique low and negative correlations with other variables and these are metropolitan area, social relations, and security (see Table 4 columns 1, 7, and 9).
The implication is that variables with strong correlations with one another are expected to load similarly on the same PCA latent components (see Aliu, 2012; Aliu & Adebayo, 2012). Hence, from the results of the correlations in Table 4, one might begin to see that variables such as price/rent, number of rooms, toilet and bath, and kitchen would load on the same component, just as variables that have extremely low coefficients load separately on different components.
Multivariate Analysis of Residential Polarization in Lagos Megacity
Although dwellings often display varying number of quality indicators, only few of these indicators actually influence the spatial organization of the housing market (Aliu, 2012; Aliu & Adebayo, 2012; Arimah, 1992; Hoong & Foong, 2006; Quigley, 1985). To determine these few residential quality variables, we use PCA. As indicated in Tables 5 through 8, four PCA results are generated for explaining the essential components that summarily describe residential quality structure in Lagos. Eight latent variables were extracted from the rotated PCA of 20 original variables used to represent the neighborhood and structural quality of dwelling units of Lagos residents. The PCA components of variables with a minimum loading of 0.40 and at least two distinct variables were used to facilitate easy explanation. The eight latent component variables extracted in this study accounted for 77.7% of the variance in the data set in all residential density (ARD), 71.4% in LRD, 80.0% in MRD, and 77.8% in HRD, respectively. The KMO tests of data adequacy are respectively 0.874, 0.791, 0.848, and 0.862 and are all significantly high. However, based on theoretical assumption of the Kaiser criterion, only five of these eight components are important to the explanation of the total variance of 64.1% of residential attributes that shape housing polarization in Lagos . The remaining components have less than 1.0 Eigenvalue and just one significantly high loading variable on each of them. More components have been extracted in some cases. For instance, Opoku and Abdul-Muhmin (2010) extracted nine components, while Kain and Quigley (1970) extracted five components.
PCA Rotated Component Loadings for ARD Areas (N = 1,485).

Source. Authors’ Field Survey (2011).
Note. PCA = principal component analysis; ARD = all residential density; KMO = Keiser, Meyer, and Okin.
PCA Rotated Component Loadings for LRD (N = 270).
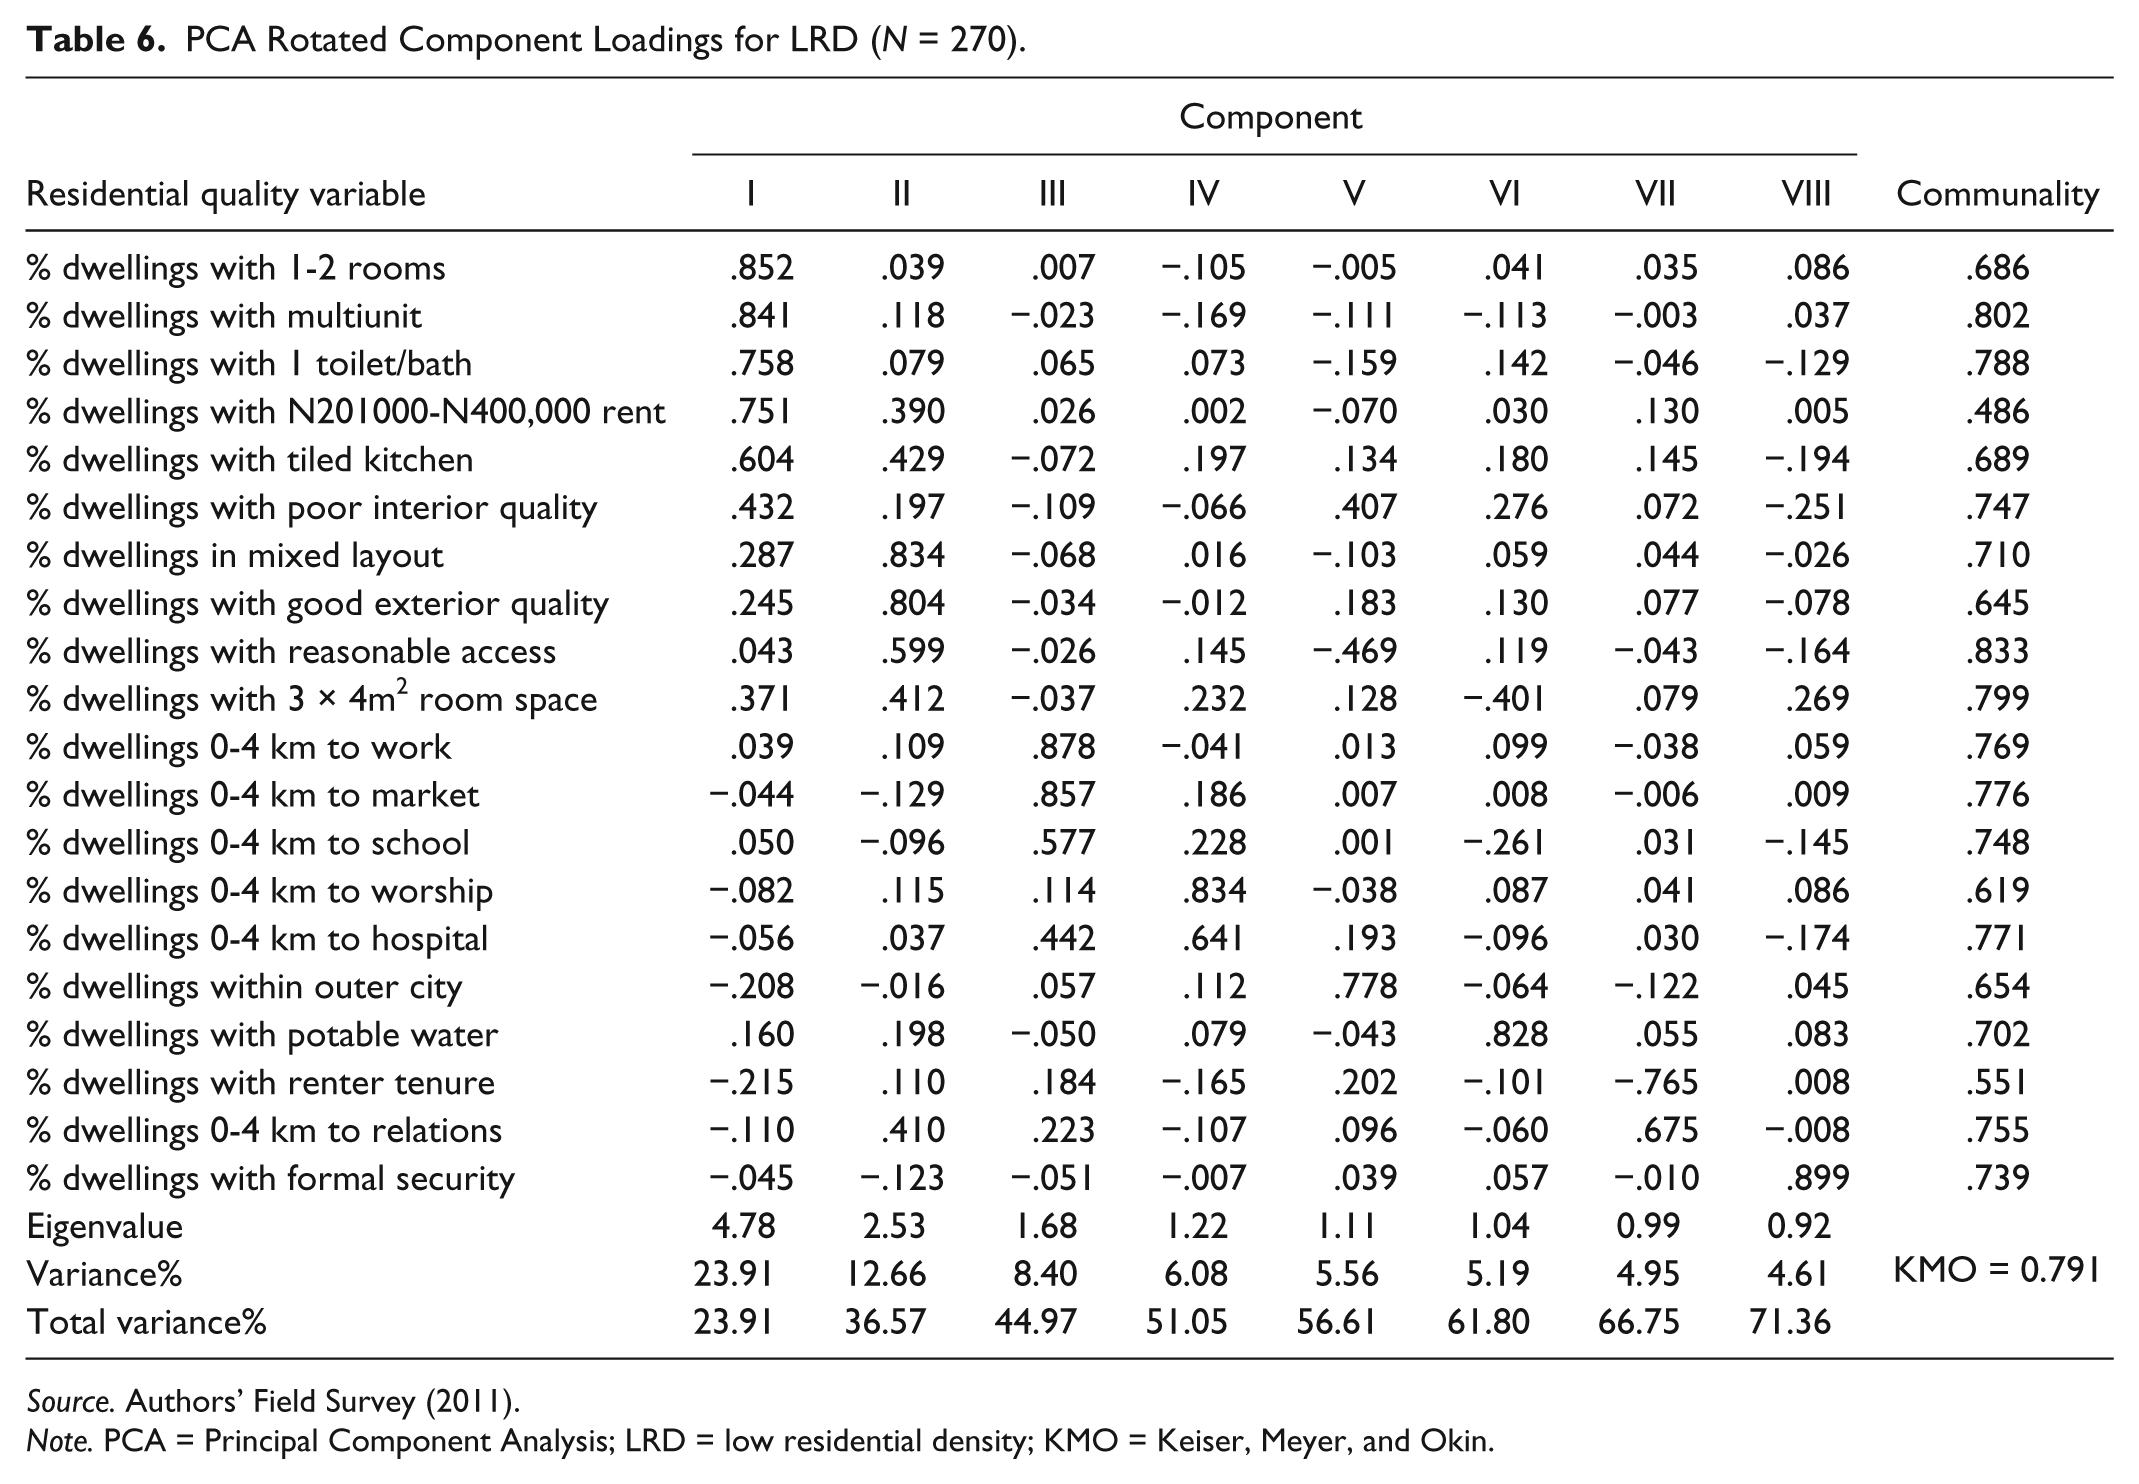
Source. Authors’ Field Survey (2011).
Note. PCA = Principal Component Analysis; LRD = low residential density; KMO = Keiser, Meyer, and Okin.
PCA Rotated Component Loadings for MRD Area (N = 486).

Source. Authors’ Field Survey (2011).
Note. PCA = Principal Component Analysis; MRD = medium residential density; KMO = Keiser, Meyer, and Okin.
PCA Rotated Component Loadings for HRD (N = 729).

Source. Authors’ Field Survey (2011).
Note. PCA = principal component analysis; HRD = high residential density; KMO = Keiser, Meyer, and Okin.
A look at Table 5 indicates that five dwelling unit quality variables, namely, number of rooms, house type, number of toilets and baths, kitchen, and price/rent strongly load on Component I with Eigenvalue of 6.1 and Variance of 30.7%. This component is therefore named “Dwelling Facility-Quality I,” as it contains dwelling variables that are of immense usefulness within the residential unit structure. The second component contains six variables, namely, proximity to hospital, school, market, worship, work, and space with loadings well over 0.40 each. This component is appropriately named “Location Proximity-Quality II.” The third component has high loadings on three variables: layout, exterior quality, and accessibility. This component is therefore named “Neighborhood Exterior-Quality III.” The fourth component contains high loadings on two structural quality variables of water and interior quality and it is therefore called “Dwelling Interior-Quality IV.” Metropolitan characteristic variable represented by outer city loads singly and negatively on the fifth component which is also called “Neighborhood-Integrity V.”
The fifth component contains variables with many negative loadings indicating lack of association between the district of residence and such variables as proximity to work, place of worship, market, school, and layout. The sixth, seven, and eight components also contain quite a number of variables with low and negative loadings except relations which loads very strongly on the sixth (Social Bond V), tenure on the seventh (Barrier to Entry VI), and security on the eight component (Security/Safety Quality VIII). However, spatial variations exist in the structure of the components across residential density areas. As indicated in Table 6, for instance in the LRD, the first component “Dwelling Facility-Quality I” accounts for nearly 24% of the total variance in the set, the second “Neighborhood Exterior-Quality II” account for 12.7%, followed by “Location Proximity-Quality III & IV” 14.5%, “Neighborhood-Integrity V” 5.6%, “Dwelling Interior-Quality VI” 5.2%, “Barrier-to-entry VII” 5%, “Security/Safety-Quality VIII” 4.6%. Six components based on Kaiser Criterion are important in this LRD and they account for 61.8% of the total variance. Incidentally, a component “Social-Bond” has no distinct presence in this region as it merges with component VII. As there is slight rearrangement in the components so in the variables that account for them. Component I contains in addition to the previous variables interior quality, while hospital and worship load on Component IV.
The situation in the MRD presents a different revelation as the arrangement of the components is different from those discovered in LRD. Extracting the same eight components as in LRD, results of PCA components in MRD are more interesting. The first component to be extracted in the MRD is “Dwelling Facility-Quality I,” followed by “Location Proximity-Quality II,” “Neighborhood Exterior-Quality III,” “Neighborhood Integrity-Safety IV,” “Social-Bond V,” “Dwelling Interior-Quality VI & VII,” and “Barrier-to-entry VIII.” The components, respectively, account for 30.5%, 15.2%, 8.2%, 6.9%, 5.9%, 4.8%, 4.3%, and 4.3% of the total variance in the data set (see Table 7).
Although the same numbers of components were extracted in the LRD and MRD, the arrangement and loading values differ significantly. The MRD loadings perhaps display the most inconsistent orientation, as many variables load in multiples on different components—for instance, work, accessibility, space, security, interior quality, and kitchen. Like the ARD components, the pattern displayed in MRD is a bit antithetical to the normal trend. The explanation for this unusual variation from expectation may be that the MRD, in terms of socioeconomic attributes, falls between the low economic status of residents in HRD and high economic status of residents in LRD (Aliu, 2012). Only five components that account for 66.7% of the variance are important in explaining residential quality variables in the MRD of the study area. The PCA results in HRD as shown in Table 8 present a different pattern from two previously discussed areas. Eight components account for 77.8% of the total variation in residential quality data used in the study. The first component “Location Proximity-Quality I” accounts for 27.6%, “Dwelling Facility-Quality II” 15.4%, “Dwelling Interior-Quality III” 7.6%, “Neighborhood Exterior-Quality IV” 7.1%, “Neighborhood-Integrity V” 5.9%, “Security/Safety-Quality VI” 5.1%, “Social-Bond VII” 4.8%, and “Barrier-to-entry VIII” 4.2% of the variance observed in the set.
According to information in Table 8, six variables loaded heavily and positively on the first component and four on the second component. Out of the four variables that loaded on the second component, number of rooms, number of toilets and baths, and house type are the most substantial residential quality variables. All the variables except accessibility consistently load on the expected components. The accessibility variable loads on two components (V and VI) and this confirms its inconsistency in housing quality provision. Incidentally, only six components that account for 68.8% of the variance are important in explaining the residential quality variations in the HRD part of the study area. Although previous studies do not differentiate clearly among the density areas they however, found that variation exist among the residential variables as they load on the components (Aliu & Adebayo, 2012).
Conclusions and Practical Implications
This article explores the nature and pattern of residential polarization in a foremost African megacity, Lagos. The key findings from this study have indicated a marked differentiation in the residential quality components in the three residential density areas of Lagos as proposed in the theoretical section of this article. Using the exploratory PCA approach, the 20 residential quality variables responsible for this polarization were explained by few components which are dwelling-facility, location-proximity, interior, exterior, neighborhood-integrity, social-bond, barrier to entry, and security components. However, these components are neither consistently extracted nor equally valued within the three residential density areas. For instance, in the LRD, Dwelling Facility-Quality, Neighborhood Exterior-Quality, and Location Proximity-Quality components are the first three components. But in the MRD, the Dwelling Facility, Location Proximity, and Neighborhood Exterior-Quality components are the first three. Also, in the HRD, Location Proximity, Dwelling Facility, and Dwelling Interior-Water Quality components are the first three residential components extracted. The compositional disparity occurs due to the dwelling peculiarities of residential density areas. These indicate that residential polarizations do not just happen; they are produced and patterned by a combination of features in different locations (Abumere, 1994; Aliu, 2012; Harvey, 1975; Kain & Quigley, 1970).
Although, the results do not perfectly confirm the ecological model in the modes of explanation rendered by Burgess or Hoyt, yet they offer explanation on the peculiar housing patterns and the ways home quality bears implicit relationship with home prices/rents in African cities. The variations in the components indicate a decreasing prominence of some variables for instance, social relation, barrier to entry, and security and an increasing importance of dwelling facilities, location, and neighborhood quality in the spatial polarization of the city built environment. These variations can be further expatiated in the light of historical and political development of cities in developing countries where due to colonial and traditional factors, dwellings in the core city areas reflect lower qualities compared with those in the Government Residential Areas or the LRD (Abiodun, 1976; Abumere, 1994; Arimah, 1992; Mabogunje et al., 1978). In the case of Lagos, the HRD and parts of MRD are characterized by unplanned, informal, and traditional multiunit apartments, unlike the LRD areas that are characterized by planned, formal, and modern residential structures. Theoretically, these results interrogate the fluidity of housing quality variables that urban scholars use to describe housing polarization and home values in developing economies.
Besides the theoretical implications, findings from this study also have a number of practical implications for property management, urban designs, and sustainability of the city. The Dwelling Facility, Neighborhood, and Location Proximity-Quality components remain the most important components that account for differentiation in residential dwellings in Lagos megacity. In all, the four rotated matrices, price/rent is consistently high and positively loaded on Dwelling Facility-Quality component. It shows that the most important price determining quality variables are the dwelling facility variables (Aluko, 2000; Hwang & Quigley, 2004; Kain & Quigley, 1970). The correlations that dwelling quality variables bear with prices are understandable as quality homes have a lot to do with costs expended on the structural and neighborhood attributes of dwellings. These findings are important for developers and surveyors who need to understand the spatio–structural dynamics of home quality and residential valuation. However, good valuation of property requires constant management of structural and neighborhood facilities. No matter how well designed and constructed residential dwellings are at the time of construction, after a while, deterioration will set in except in cases where attention is given to the structural and environmental management of the building. A proper building management and maintenance culture does not only elongate the physical life of individual buildings, but also enhances the future value of the property as an economic entity (Arimah, 1992; Kain & Quigley, 1970).
The findings from this study are of immense importance to urban designers. Basically the dwellings that permeate the three residential density areas are relatively different as dwellings in the HRD and MRD display lower quality level than those in the LRD. This apparent residential polarization shows that intervention policies on residential improvement or rehabilitation should avoid blanket application of the same measures on the whole city. Instead, corrective measures should be made in accordance with the peculiarities of the residential density areas. The discernible polarization of dwelling quality in Lagos can be addressed through urban design methods such as gentrification. In the core city (HRD) areas of Lagos, majority of the residential dwellings were built many years ago with little attention to the structural and environmental quality (see Abiodun, 1976; Ekanem, 1995; Towry-Coker, 2012). This has been attributed partly to the poor financial capacity of the owners and partly to the low economic power of the potential renters. Most of these old dwellings are presently in decrepit conditions and need rehabilitation. However, the nature of tenure, where the owners are the grandchildren of the first owner may stand in the way of their improvement. For reasons bordering on tradition and culture, in the core areas of Lagos, majority of the buildings are jointly owned by second to fourth generation of the original owners. The children hardly agree to either sell or engage property developers to construct befitting modern structures to replace the blighted ones. Gentrification in highly polarized urban environment like Lagos will impact the property and environmental conditions in two important ways. One, gentrification will provide further vacancies for better residential units through filtering; and two, it will engender environmental sustainability of the city. In contemporary urban planning thinking, residential dwellings are crucial components of urban design and sustainable city growth (Echenique, Hargreaves, Mitchell, & Namdeo, 2012).
Footnotes
Declaration of Conflicting Interests
The author(s) declared no potential conflicts of interest with respect to the research, authorship, and/or publication of this article.
Funding
The author(s) received no financial support for the research and/or authorship of this article.