
Abstract
The Motivated Strategies for Learning Questionnaire (MSLQ) has a long history of use in educational psychology, yet few studies have examined the latent factor structure of the entire scale using data from a single administration of the instrument. Although using the subscales individually was encouraged by the creators of the instrument, the practice has produced piecemeal evidence for the latent factor structure. In the current study, we administered all 15 subscales of the MSLQ to a large population of postsecondary students enrolled in introductory geoscience courses and used confirmatory factor analysis to examine the latent factor structures described in previous MSLQ literature. Faced with unsatisfactory evidence for the hypothesized structures, we describe our respecification process and provide some commentary on a more parsimonious latent factor structure that may be of use in similar research projects.
Keywords
The Motivated Strategies for Learning Questionnaire (MSLQ) is a popular measurement instrument in educational psychology research. It has been used in literally hundreds of educational research projects to assess student motivation and strategy use (Duncan & McKeachie, 2005) and has gained recent, renewed attention in measurement literature (Cho & Summers, 2012; Credé & Phillips, 2011; Dunn, Lo, Mulvenon, & Sutcliffe, 2012). The creators of the instrument proposed a hypothesized structure of the subscales in their initial work (Pintrich, Smith, Garcia, & McKeachie, 1991) and subsequently examined empirical evidence for the factorial validity of two major sections of the scale during the creation of the instrument. In addition, others have examined combinations of items for specific subscales (e.g., Credé & Phillips, 2011) or conducted meta-analyses of existing studies to examine the entire instrument (Dunn et al., 2012). However, few studies have examined all of the subscales in a single administration of the MSLQ, save for those conducted by the creators of the scale (Pintrich & DeGroot, 1990; Pintrich et al., 1991, Pintrich, Smith, Garcia, & McKeachie, 1993) and a validity study conducted on a translated version of the scale (Nirmala & Sachs, 1999). The scarcity of measurement work that examines the entire latent factor structure of the instrument is an important gap in the MSLQ literature.
One reason for this gap may be that the creators of the MSLQ (Pintrich et al., 1991) suggest that the 15 scales can be used together or separately and are designed to meet the needs of the researchers who administer them. In a similar vein, measurement experts also acknowledge that researchers have to make difficult choices about which variables to include in a study (Byrne, 2006; Kline, 2005). Areas of inquiry where theory posits the existence of many exogenous variables can be especially difficult (such as in the study of motivation and strategy use). In the case of the MSLQ—an instrument with 15 latent variables designed to predict unique variance in student performance—difficult choices are perhaps implicit in deciding to use the questionnaire. The overall result seems to be that although many of the subscales have been used successfully in research projects, others have become less prevalent, with sporadic documentation of how the subscales work in combination.
We chose to administer the full version of the MSLQ to a large sample of postsecondary students enrolled in introductory geology classes. The data collection was part of an externally funded project to study student motivation and cognition in the geosciences—an under studied area of science, technology, engineering, and math (STEM) research (McConnell & van der Hoeven Kraft, 2011) with dwindling graduation rates (Keane, 2012; Milling & Christy, 2002). Introductory geoscience students are different from many other introductory science students due to the high number of nonscience majors (Gilbert et al., 2012). The purpose of this analysis was to examine evidence for the structural validity of the MSLQ in pursuit of a satisfactory measurement model useful for future research.
The MSLQ Latent Factor Structure
The MSLQ is an 81-item questionnaire that measures varied indicators toward a specific course (Pintrich et al., 1991, 1993). The MSLQ items can be broken down into six motivation subscales (Intrinsic Goal Orientation, Extrinsic Goal Orientation, Task Value, Control Beliefs, Self-Efficacy for Learning And Performance, and Test Anxiety) and nine learning strategy subscales (Rehearsal, Elaboration, Organization, Critical Thinking, Metacognitive Self-Regulation, Time and Study Environment, Effort Regulation, Peer Learning, and Help Seeking).
The first widely cited published measurement work on the MSLQ was done by Pintrich and DeGroot (1990). These authors describe a five latent factor structure using data from junior high students. Although the technical manual for the MSLQ was not in circulation, these authors define their five factors similar to the way they are later reported in the MSLQ technical manual and later publications. The five factors were expectancy, value, affect, learning strategies, and self-regulation. These factors were constructed of items that would later become the 15 subscales reported above and seem to have become influential to later work.
A good portion of the original measurement work done on the MSLQ was also reported in an unpublished technical manual distributed in the early nineties (Pintrich et al., 1991). This manual contains the item wording and related psychometric data and expounded upon the five major components described by Pintrich and DeGroot (1990), elucidating the 15 subscales. The authors explain that the items were revised over multiple administrations in educational psychology classes at the University of Michigan between 1982 and 1986. After presenting a sample questionnaire to be used by other researchers, the authors present the results of a confirmatory factor analysis (CFA). This analysis was conducted on a combined sample of students from the University of Michigan and an undisclosed community college.
In the CFA, the authors chose to examine the two major sections of the questionnaire, motivation and strategy use, in separate measurement models. They argue that although the goodness-of-fit statistics are not adequate, they are reasonable given the range of courses and subject domains represented in the data (Pintrich et al., 1991). The fit of the motivation section (6 latent factors) was as follows: χ2 / df = 3.49; Goodness of fit statistic (GFI) = .77; Root mean square residual (RMR) = .07; critical N (CN) = 122. The fit of the learning strategies section (9 latent factors) was as follows: χ2 / df = 2.26; GFI = .78; RMR = .08; CN = 180. The structural portion of the models appears to be orthogonal from the diagrams, though not specifically addressed. Two years later, Pintrich et al. (1993) attempted to improve the fit of their model using modification indices, without success. Dunn and colleagues (2012), describe these results by arguing, “this provides a clue that the hypothesized model has shown not only a certain degree of misspecification but also a serious problem on its latent structure,” suggesting more work needs to be done to explore the latent factor structure of the scale (p. 316).
Despite these vagaries, the instrument has been administered in many different classroom and school settings to predict student performance with a good degree of consistency (Crede & Kuncel, 2008; Duncan & McKeachie, 2005). In postsecondary science classrooms in particular, those most near to our population of interest, the motivation subscales have predicted moderate amounts of variance in student performance in introductory chemistry (Zusho, Pintrich, & Coppola, 2003) and biology courses (McKeachie, Lin, & Strayer, 2002). The strategy use subscales have also been linked to performance in postsecondary science classrooms (Peng, 2012) and differences between first-year medical students and nursing students have been explained using the strategy measures (Salamonson, Everett, Koch, Wilson, & Davidson, 2009).
Although these types of findings are common—to the extent that a full review of them for all young adult samples is well beyond the scope of this study—a handful of studies have documented psychometric problems with the MSLQ. For example, Malpass, O’Neil, and Hocevar, (1999) provide evidence that the effort regulation and metacognitive self-regulation subscales cannot be distinguished. Similarly, Pintrich and DeGroot (1990) and Yap (1993) both reported that evidence from their administrations of items lacked discriminant validity between the regulation subscales. Using a translated version of the instrument, Nirmala and Sachs (1999) provide good evidence for a five-factor oblique model, yet they could not distinguish between strategy use and self-regulation factors and ultimately combined them, using a method factor as the fifth latent variable. Dunn et al. (2012) thoroughly review many of these problems and provide a recombination of the metacognitive self-regulation and effort regulation items that may help future researchers.
Credé and Phillips (2011) also provide an extensive review of studies using the MSLQ. In their approach, these authors conducted a meta-analysis to determine which of the 15 subscales accounted for the most variance in academic performance over the years. In their collection of studies, they found that the strategy use subscales not directly related to self-regulation—Rehearsal, Organization, Elaboration, Critical Thinking, Help Seeking, and Peer Learning—were largely unrelated to academic performance. Although other studies have produced useful findings using items from these subscales in samples of college students (e.g., Karabenick & Collins-Eaglin, 2007), by and large, the available evidence seems to suggest these scales are the least predictive of academic performance. Credé and Phillips (2011) argue, convincingly in our opinion given the rigor of their meta-analysis, that the motivation and self-regulation subscales may be most useful for researchers.
Study Purpose
The MSLQ was designed by educational psychologists interested in providing researchers with a framework for examining motivation and strategy use in the classroom. These researchers encouraged users to focus on subscales useful to their research questions. This approach stands in contrast to other types of thinking about measurement, where replication of a particular latent factor structure across contexts is highly valued. The MSLQ has provided the opportunity for researchers to choose from a wide range of constructs to determine what might work best for a given research question. Because validity is the property of evidence, not a particular instrument, this may have been a useful feature of the MSLQ and has perhaps made it appealing to researchers. However, its flexibility has led to a rather piecemeal collection of evidence regarding how the scale functions psychometrically.
Because there is little evidence regarding the full latent factor structure for single administrations of the entire questionnaire, there is little measurement evidence to guide researchers in regard to which combinations of subscales may produce psychometrically sound measurement models. The guiding purpose of this study was to test the different latent factor structures for the MSLQ described in the literature, either by the creators, or other researchers, to determine if any of them demonstrated reasonable fit to our data. Faced with unsatisfactory fit for these latent structures, the second goal of the project was to respecify the best fitting model to produce evidence for a good fitting latent factor structure.
Method
Participants
Students enrolled in introductory to physical geology courses at 13 postsecondary institutions from around the United States in Fall 2008 through Spring 2012 voluntarily participated in this study: three research-, one PhD-granting universities (n = 1,936), two master’s-granting, public universities (n = 640), five community colleges (n = 364), and three liberal arts colleges (n = 200), for a total of 3,140 students. This represents 37 unique instructors and 93 unique class sections over this time. The classes at the research-one universities and master’s-granting universities typically had 60 to 160 students each. The community colleges and liberal arts college sections typically had fewer than 30 students each. All courses were intended as the first geology course, for nonmajor and major alike, and all except one were titled “Introductory Geology” or “Physical Geology,” or something very similar and had comparable content. Institutional review board (IRB) approval was attained before data collection.
The ratio of gender and ethnicity of the student population that participated in the survey do not vary significantly from the overall student population for most institutions, suggesting the samples were representative of the institutions from which they were gathered. For the data set in its entirety there were 1,585 females (50.7%), 1,541 males (49.3%), and 14 students chose to not indicate sex. There was only one institution where the gender ratio differed significantly from the overall institute population, Community College C had six females in the survey of 16 total participants (37.5%), but the institution has a proportion of 58% female students (χ2 = 7.62, df = 1, p < .01). The difference may be due to the small survey population. The survey population was predominantly Caucasian (80.7%), with individual institution proportions varying between 58% and 91%. Similar to the gender ratio, the proportion of Caucasian to non-Caucasian participants did not differ significantly from the overall ratio that is reported on institution websites and public reports, with the exception of Community College B. Community College B had 12 students who participated in the survey of which 7 indicated they were Caucasian (58.3%); the overall institution reports that 32.0% of the students identified themselves as Caucasian (χ2 = 12.84, df = 1, p < .001). See Table 1 for a summary of these results.
Summary of Sex and Race Demographics by Institute Type.

Note. n = 3,140; Research 1 universities (n = 1,936), 4-year public universities (n = 640), community colleges (n = 364), and liberal arts colleges (n = 200).
As the course surveyed is an introductory science course that is commonly used to fulfill general education requirements for a degree, the majority of students enrolled were below the age of 21 and a large portion had not declared a major at the time of the survey. The largest proportion of students, 57.7% self-reported between 18 to 19 years of age, followed by 27.6% self-reported between 20 and 21 years of age. Classes with the largest proportion of students older than 25 years of age were found in the community colleges, between 9.1% and 37.5% of the surveyed students. At the time of survey, 36.2% of the students had yet to declare a major. Of those remaining, 24.6% self-reported choosing a STEM major and 39.2% for those reporting a major declared themselves as non-STEM majors.
Measure
During the last 2 weeks of the semester, students voluntarily completed the MSLQ (Pintrich et al., 1991). The MSLQ questionnaire is an 81-item self-report survey divided into 15 subscales. Six of the subscales were related to the motivation section and nine were related to the learning strategies section, each with their own sets of scales described below (see Table 2 for the intended structure of the instrument). Students rated themselves on a 7-point Likert-type scale, from 1 (not at all true of me) to 7 (very true of me) for each statement as it applies to the current course.
Components of the Motivated Strategies for Learning Questionnaire.

Note. Table represents the organization of the questionnaire as defined by Pintrich, Smith, Garcia, and McKeachie (1991, 1993).
Motivation Section
Value
The value scale contains three subscales: Intrinsic Goal Orientation, Extrinsic Goal Orientation, and Task Value. Intrinsic Goal Orientation consists of four items that refer to an individual’s perception that tasks involved in a class will help to achieve a personal goal, such as satisfying a curiosity or mastery (e.g., “In a class like this, I prefer course material that arouses my curiosity, even if it difficult to learn”). The Extrinsic Goal Orientation subscale consists of four items that measure the perception that participating in class tasks are important to grades, competition, or evaluation by others (e.g., “Getting a good grade in this class is the most satisfying thing for me right now”). The Task Value subscale consists of six items that measure how a student views the importance and usefulness of a task (e.g., “I think I will be able to use what I learn in this course in other courses”).
Expectancy
The Expectancy scale contains two subscales, Control of Learning Beliefs and Self-Efficacy for Learning and Performance. Control of Learning Beliefs consists of four items to measure a student’s belief that their efforts will result in positive gains in learning and academic performance (e.g., “If I study in appropriate ways, then I will be able to learn the material in this course”). Self-Efficacy consists of eight items to measure self-appraisal of the ability to master tasks (e.g., “I’m certain I can master the skills being taught in this class”).
Affect
The affect scale contains only one subscale, Test Anxiety. Test Anxiety consists of five items that measure student’s negative thoughts and anxiety about performance (e.g., “I have an uneasy, upset feeling when I take an exam”).
Learning Strategies Section
Cognitive and metacognitive strategies
The Cognitive and Metacognitive Strategies scale consists of five subscales, namely, Rehearsal, Organization, Elaboration, Critical Thinking, and Metacognitive Self-Regulation. Rehearsal consists of 4 items that measure a student’s tendency to use basic study strategies that focus on memorization, such as reciting or naming items from a list (e.g., “When studying for this class, I read my class notes and the course readings over and over again”). Elaboration subscale consists of 6 items that measure a student’s tendency to use study strategies, such as summarizing and creating analogies, that promote internal connections between items when learning (e.g.,” I try to understand the materials in this class by making connections between readings and the concepts from lectures”). The Organization subscale consists of 4 items that measure strategies that students use to organize information such as outlining, clustering information, and selecting main ideas (e.g., “When I study the readings for the course, I outline the material to help me organize my thoughts”). The Critical Thinking subscale consists of 5 items that refer to degree that students apply previous knowledge to new situations or evaluate the problem (e.g., “When a theory, interpretation, or conclusion is presented in class or in the readings, I try to decide if there is good supporting evidence”). The Metacognitive Self-Regulation subscale consists of 12 items that refer to a student’s awareness of their learning through the use of strategies to planning, monitoring, and regulating their learning (e.g., “When reading for this course, I make up questions to help focus on my reading”).
Resource management
The Resource Management scale consists of four subscales, Time and Study Environment, Effort Regulation, Peer Learning, and Help Seeking. Time and Study Environment consists of eight items that measure a student’s ability to schedule, plan, and manage their study time (e.g., “I make sure I keep up with the weekly readings and assignments for this course”). The Effort Regulation subscale consists of four items measuring a student’s ability to continue with their study efforts despite difficulties or distractions (e.g., “I work hard to do well in this class even if I don’t like what we are doing”). The Peer Learning subscale consists of three items that refers to a student’s tendency to collaborate with their peers (e.g., “When studying for this course, I often try to explain the material to a classmate or friend”). The Help Seeking subscale consists of four items that refer to a student’s tendency to seek assistance from either peers or the instructor when they do not understand the material (e.g., “I ask the instructor to clarify concepts that I don’t understand well”).
Analysis
General overview
We completed our analysis in three general steps. First, descriptive statistics, internal reliability estimates, and correlations for all MSLQ subscales were computed and data screening was conducted. We also inspected the variance components for the individual subscales to determine if between-university variations required multilevel modeling. Based on these results, items were parceled into subscales, and CFA was used to test the latent factor structure of the instrument. Parcels are composites scores created from individual items that are treated as continuous variables. According to Kline (2005), parceling is appropriate to reduce the complexity of a model when the unidimensional nature and internal reliability of item sets are not in question. Because the purpose of this study was to examine the latent factor structure of the MSLQ and not the individual items, we saw parceling as a practical decision given the sound coefficient alphas and the complexity of the models.
Second, the latent factor structure of the five MSLQ scales—Expectancy, Value, Affect, Cognitive Strategy Use, and Resource Management as initially described by Pintrich and DeGroot (1990), and later defined by Pintrich et al. (1991)—was examined in an orthogonal model to establish a baseline. This was similar to the starting point used by Nirmala and Sachs (1999) in their measurement work. After this, we embarked on a series of nested model comparisons informed by the MSLQ measurement literature and common CFA techniques. We examined an oblique model that included the five original scales (Pintrich & DeGroot, 1990), a six-factor model representative of the full factor structure from subscales to scales to sections described in the original technical manual (Pintrich et al., 1991), and two other logical alternative models (Byrne, 2006). The four models are described in detail below. We chose the model with the best overall fit, and proceeded to the multivariate Lagrange Multiplier chi-square test (LM test) to examine evidence for misspecification.
Third, we continued the specification process, this time working toward a more parsimonious, theoretically consistent model—referred to from this point forward as the final model. This model was also in line with the recommendations of the MSLQ creators, but it only included subscales we chose, based on the rationale described below, once we exhausted the end of the CFA approach, in its purest sense, and transitioned into exploratory mode.
Model specification
The MSLQ contains many subscales, organized into a hierarchical structure (see Table 2). If completely elucidated from subscales, to scales, to sections, it yields 21 variables with 23l—that is, v(v + 1) / 2—observations. To begin, we thought it wise to test the original models suggested by the survey creators. We examined an orthogonal model with all five of the major sections to establish a baseline. Then, to begin our model comparisons, we tested a model based on the work by Pintrich and DeGroot (1990) and similar to the measurement work reported by Nirmala and Sachs (1999). Model 1, the Pintrich and DeGroot (1990) model, contained four latent factors and their 15 respective indicators. In this model, the affect scale was treated as an indicator because it contained only one subscale; however, it was allowed to cross load with all four of the latent factors, the best mathematical substitute for covariance. Model 2 was a modified version of Model 1, but contained only one general learning factor. Model 3 was the structure of the entire questionnaire described by Pintrich et al. (1991) in the technical manual. This model contained two second-order factors, representative of the motivation and learning strategies sections; four first-order factors, representative of the expectancy, value, cognitive strategies, and resource management scales; and 15 indicators (or the subscales). The affect scale was again treated as an individual indicator because it contains only one subscale, but was allowed a parameter estimate directly from the second-order motivation factor. Model 4 was a modified version of Model 3, but contained only one second-order general learning factor. Testing these four models allowed us to determine whether multiple latent factors were important and whether a hierarchical approach to the model was more consistent with the data (see Figure 1 for a graphical representation of these models).

Graphical representation of nested models used to test full MSLQ instrument.
Faced with poor fit in all four models, we had to consider options for respecification. We chose to work with the best fitting model of the four. One of the primary decisions was whether or not we wanted to use modification indices to produce evidence for how to trim or add parameters to get the best global fit. We made a conscious decision to use these tests carefully—our reason being that these tests, when followed more or less blindly, can produce models that are not theoretically interpretable. We limited our use of modification indices to the determination of whether or not it made substantive sense to free up the factor to indicator parameter(s) that exhibited the largest LM test value.
Faced again with poor results, we chose to combine our analysis of the best fitting model with our theoretical understanding of the MSLQ to develop a final model. At this point, we believed we needed to abandon the CFA approach in its purest sense and move onto exploratory respecification. Byrne (2006) argues that once a hypothesized CFA model has been rejected, and traditional approaches have been exhausted, an exploratory approach is justified. Thus, we eliminated variables that produced poor evidence of internal reliability, had weak parameter estimates in the original model, or had performed poorly in recent studies.
We saw the move to remove subscales in the following way: When researchers are faced with decisions about which variables to include in a model, they are confronted with evidence from many directions. The difficulty in this type of decision making is acknowledged by experts, and the notion that a right answer about which model to choose exists is idealistic at best. We also want to make clear that we explored many models. Structural equation modeling provides the opportunity to compare many alternative models, especially with the advance of new, easier-to-use software. Realistically, a researcher is going to run dozens, if not more, models when trying to determine what model is most consistent with data. Our final model includes 6 of the 15 original subscales, equaling 21 total observations. In our final step, we analyzed the final model with the individual items included in the analysis. More about the reasoning behind the final model is presented in results and the discussion.
Program and fit indices
We used EQS 6.2 (Bentler, 1995) to examine the fit of our data to the measurement models. To assess the fit of the model, we used the chi-square test as well as the Comparative Fit Index (CFI), the Root Mean Square Error of Approximation (RMSEA), and the Standardized Root Mean Square Residual (SRMR). Data were presumed to be consistent with the model if the fit indices were deemed acceptable and the chi-square test was nonsignificant. It is easy for researchers to become overwhelmed with information about fit indices, but Hu and Bentler (1999) caution that careful consideration is required when choosing what to examine because each can function differently given sample, model complexity, and the like. Because of our large sample, and complicated models, we chose to look at the CFI, SRMR, and RMSEA as they have been deemed appropriate for analyses of this nature (Byrne, 2006). We kept conventional cutoff criteria in mind when evaluating model fit (e.g., Hu & Bentler, 1999).
Results
Descriptive Statistics and Data Screening
Descriptive statistics for the 3,140 cases used in the CFA model were computed and inspected for normality (see Table 3). We saw evidence for univariate normality as good indication of multivariate normality. Results indicated that means, standard deviations, and normality statistics were all acceptable and did not provide reason for concern. No outliers were detected. None of the Cronbach’s alphas could be considered excellent, save for perhaps task value and self-efficacy. All others were acceptable, save for perhaps, Organization and Help Seeking, both of which fell below .7. None of these results suggested parceling was inappropriate. In addition, analysis of variance components demonstrated that between 93.5% and 99.9% of the variability in the 15 MSLQ subscale scores was attributable to within-student phenomena, as opposed to between-university effects, and that between 92.1% and 99.5% of the variability in the 15 MSLQ subscale scores was attributable to within-student phenomena, as opposed to between-instructor effects—suggesting multilevel modeling would not provide much benefit.
MSLQ Subscale Descriptive Statistics (n = 3,140).

Note. Credé and Phillips (2011) provide a summary of all reliability estimates published on the MSLQ subscales. MSLQ = Motivated Strategies for Learning Questionnaire.
Testing the Hypothesized Latent Factor Structures
A CFA model was constructed to examine the latent factor structure of MSLQ, as described by the creators as well as other alternative models. The orthogonal model of the original five-factor structure was not satisfactory: χ2(87, N = 3140) = 10,390.04, p < .001, CFI = .50, SRMR = .27; RMSEA = .19. As a result, we moved onto our comparison of the four models described above. Results indicated that Model 1, the oblique four-factor model did not produce good fit: χ2(81, N = 3140) = 5,708.14, p < .001, CFI = .77, SRMR = .11; RMSEA = .15. Model 2, the single-factor model, also produced poor fit: χ2(90, N = 3140) = 10,786.78, p < .001, CFI = .57, SRMR = .13; RMSEA = .20. Model 3, the hierarchical model described in the technical manual was also not consistent with the data: χ2(85, N = 3140) = 6,595.87, p < .001, CFI = .74, SRMR = .12; RMSEA = .15. Model 4, the technical manual model with one second-order factor also produced poor fit: χ2(86, N = 3140) = 6,882.12, p < .001, CFI = .73, SRMR = .13; RMSEA = .16. Model 1, the oblique four-factor model, demonstrated the best fit to the data, with a difference in CFI > .01 as compared with the next best fitting model (Cheung & Rensvold, 2002). Parameter estimates and effect sizes for Model 1 are presented in Table 4.
Parameter Estimates for Model 1 (n = 3,140).

Note. Cog Strat = Cognitive Strategy Use; Manag = Resource Management. Value to Expectancy: r = .70; Value to Cognitive Strategy Use: r = .69; Value to Resource Management: r = .51; Expect to Cognitive Strategy Use: r = .48; Expectancy to Resource Management = .52; Cognitive Strategy Use to Resource Management = r = .69.
Model Respecification Using the LM Test
The LM test was used to determine which parameters might improve the fit of Model 3. Results indicated that misspecification was primarily due to factor → subscale parameters. Multiple iterations of the LM test, where a parameter was added, the model then rerun with another LM test, followed by another evaluation and added parameter and so on, incrementally improved model fit. A total of 16 factor → subscale parameters were incrementally added to Model 3. All parameters suggested at each increment of the LM tests were factor → subscale parameters, though error covariances were allowed into the LM test. At the addition of the 13th new parameter, a condition code surfaced, which required the imposition of an equality constraint, where the covariance between strategy use and resource management was set equal to the covariance between strategy use and expectancy. We chose to stop model respecification when model fit approached basic acceptable limits.
Model fit with 16 additional factor → subscale approached acceptable limits: χ2(71, N = 3140) = 2,887.39, p < .001, CFI = .89, SRMR = .06; RMSEA = .11. However, because the pattern of results clearly indicated the model we were attempting to specify was, at heart, an exploratory factor analysis model, we chose not to expound upon the details of each successive approximation toward the respecified model using the LM test here, except to say that the resulting model was impractical. With so many multidimensional cross loadings, it would be nearly impossible to determine convergent or discriminant validity.
Model Respecification Using Substantive Exploration
After the failed empirical respecification, we chose to look at the data from a substantive perspective. We used extant findings and the results from Model 1 to inform our choice to remove the following subscales: Rehearsal, Organization, Elaboration, Critical Thinking, Help Seeking, Peer Learning, Time Study, Extrinsic Goals, and Test Anxiety. After these subscales were removed, we constructed a final model that consisted of three latent factors, expectancy, value, and self-regulation, with six indicators, intrinsic goals, task value, self-efficacy, control beliefs, metacognitive regulation, and effort regulation. The final model produced good fit: χ2(15, N = 3140) = 220.62, p < .001, CFI = .98; SRMR = .029; RMSEA = .10, and a final model that included subscale items also approached acceptable limits: χ2(584, N = 3140) = 9,080.8, p < .001, CFI = .87; SRMR = .066; RMSEA = .06. See Figure 2 for standardized parameter estimates and effect sizes for the final model of the latent factor structure.
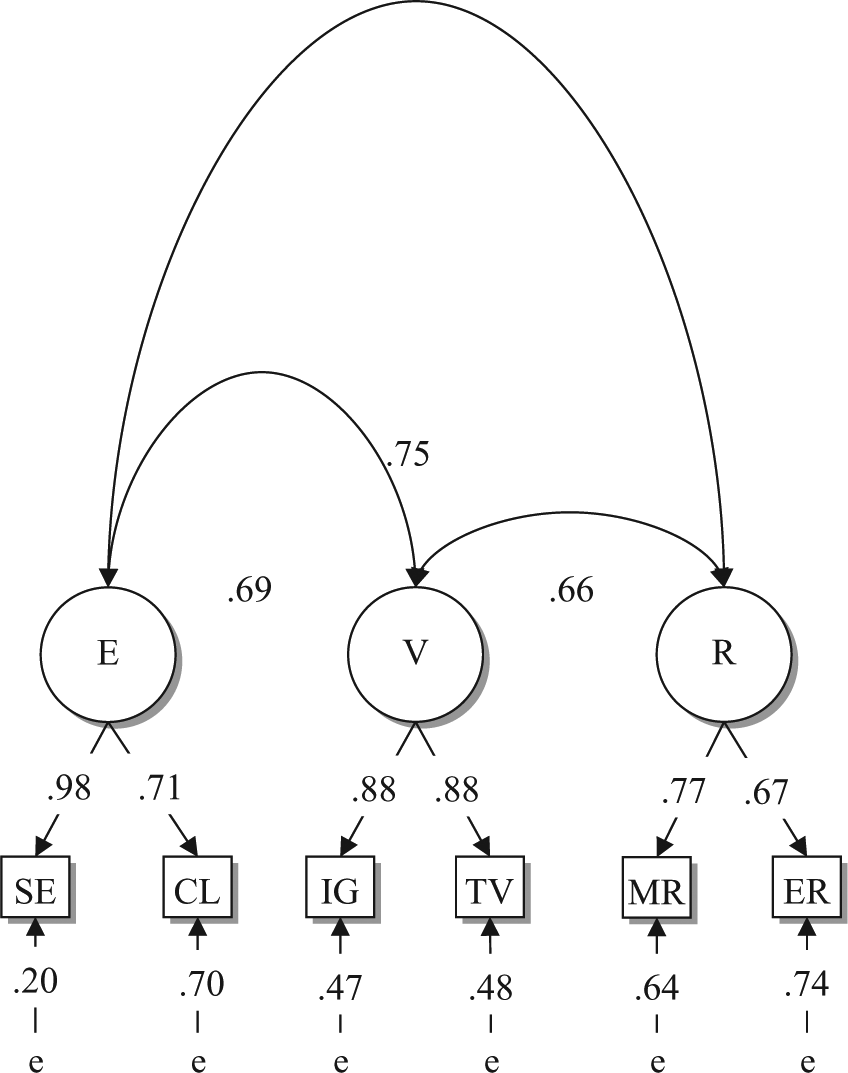
Parameter estimates for the final model.
Discussion
The results of our study suggest that a three-factor structure using six of the MSLQ subscales may be an effective approach to modeling the factor structure of the MSLQ. Two of these latent factors represent expectancy and value—constructs extremely popular and widely used in motivation theory (Wigfield & Eccles, 2000). These two latent factors were similar to their original versions, with the exception of removing two subscales. The third construct, however, is not exactly what the creators of the instrument described, but it is very much in line with existing studies of the MSLQ. Meta analyses have shown that the metacognitive and effort regulation subscales have been good predictors of academic performance (Credé & Phillips, 2011) and other measurement research has both reviewed the importance of self-regulation in academic success and identified psychometrically sound ways to combine items from these scales (Dunn et al., 2012). Combining these two subscales to create a general regulation construct was not only a good fit for our data, it may be a very useful strategy for other researchers interested in measuring self-regulation.
That said, we had to make difficult measurement decisions on our way to the final model. We removed more than half of the subscales from the instrument for one reason or another. The decision to remove these subscales was based equally on evidence from our initial analysis and our read of motivation, self-regulation, and MSLQ literature. We began with the motivation portion of the instrument. We saw that extrinsic goal orientation items produced the worst alpha in the value scale, and variance in the measured variable was not strongly predicted by the value latent factor, producing unwanted residual error. Although the test anxiety items hung well together, the indictor produced a poor factor loading on the motivation latent factor. Because both expectancy and value constructs are well established in the motivation literature (Ormrod, 2011), anxiety is considered an emotional construct as opposed to a motivational one (Pekrun & Schultz, 2007), and extrinsic goal orientation is not widely considered a dimension of value (Anderman & Wolters, 2006), we chose to keep subscales that preserved expectancy and value constructs intended by Pintrich and colleagues and remove the ones that did not—remaining consistent with motivation theory (e.g., Wigfield & Eccles, 2000). In short, we took out extrinsic goals and test anxiety subscales.
Next, we set out to examine the learning strategies section. The existing MSLQ literature in this area suggested more psychometric problems with these subscales than others in the motivation section (Credé & Phillips, 2011; Dunn et al., 2012). Moreover, literature on learning strategies in general is not as clear on the distinction between the subscales. For example, rehearsal, elaboration, organization, critical thinking, effort regulation, and so on are all considered learning strategies, but they exist at different levels of analysis in regard to working memory. For example, Baddeley (1992) argues that working memory is hierarchically organized, where an executive function (metacognition) governs two subsystems, the phonological loop and the visual sketchpad. The executive function system is responsible for self-regulation, whereas the two subordinate systems perform more basic tasks like rehearsing and organizing.
In our interpretation of this literature, we could only justify assuming that effort regulation and self-regulation would exist at the same level of analysis (executive function). This substantive difficulty was supported by evidence from a meta-analysis that suggests the regulation strategy use subscales mediate motivation and academic performance whereas the other strategy use subscales are not good predictors of study outcomes (Credé & Phillips, 2011). Accordingly, we made the decision to keep the two subscales that were clearly related to executive functioning in the model: effort regulation and metacognitive regulation. Although these two subscales were from different sections, they have recently been examined together in measurement literature (Dunn et al., 2012).
The choice to remove certain subscales was based on both substantive and empirical evidence. The resulting final model is theoretically defensible and more parsimonious than the models suggested by the instrument creators. The MSLQ affords researchers the opportunity to use a lot of subscales in a timely fashion. Although this may be advantageous in many ways, it can also create a situation where it is difficult to produce a working measurement model on which to build predictive analyses. A priori, if researchers are looking to eliminate subscales during the design phase of a research project, our results suggest that many of the strategy use subscales not related to self-regulation are a good place to start. We certainly acknowledge, though, that in other studies, other combinations of subscales may be more appropriate. However, when the results of the current study are viewed through the lens of recent MSLQ measurement work mentioned above, it seems retaining the six subscales we present in our final model may be a good choice for researchers. Suffice it to say, over the years the subscales we removed have not performed well, and we feel comfortable suggesting this model, or one like it, may fit data gathered using the MSLQ subscales in many introductory postsecondary courses where constructs such as expectancy, value, and self-regulation are relevant to academic success.
Of course, there are limitations to our study. The final model has only two indicators for each factor, which allows the model to be identified, but does leave some question as to whether the factors are adequately determined. Given the goodness of fit when the items for these six indicators were again included in the analysis, as well as the strong theoretical justification for the model, we see this as a minor limitation. In addition, our strategy for model respecification was certainly not algorithmic and cannot be replicated step by step. The final model resulted from an exploratory process, and such processes can capitalize on chance in ways that result in a model that may not be confirmed in later work. Nevertheless, what we came up with clearly retains good fidelity to how the latent constructs were initially operationalized and is a good empirical fit to the data.
To conclude, we argue, as other research has hinted at but not specifically tested, that the hypothesized latent factor structure of the MSLQ model is systemically flawed. Our traditional approach to CFA provides good evidence that this is the case. Faced with this difficulty, we provide an example alternative with three latent factors—expectancy, value, and self-regulation. These constructs are extremely popular in educational psychology and have, certainly not coincidentally, shown to be the most useful constructs from the instrument over the years. The results from this study provide clarity to the pattern of results from previous work and a cohesive approach to administering the important subscales from the MSLQ.
Footnotes
Authors’ Note
The authors would like to acknowledge members of the GeoScience Affective Research Network (GARNET), specifically David McConnell, David Budd, Ann Bykerk-Kauffman, Megan Jones, Ronald Matheney, Dexter Perkins, and Karl Wirth for their feedback and contributions to the manuscript.
Declaration of Conflicting Interests
The author(s) declared no potential conflicts of interest with respect to the research, authorship, and/or publication of this article.
Funding
The author(s) disclosed receipt of the following financial support for the research and/or authorship of this article: This research was supported by a National Science Foundation Grant REC# 1022980 awarded to, Maricopa County Community College District, and Grant REC# 1022917 awarded to, North Carolina State University.