
Abstract
This study examined whether the broad ability general speediness (Gs) could be measured via the auditory modality. Existing and purpose-developed auditory tasks that maintained the cognitive requirements of established visually presented Gs markers were completed by 96 university undergraduates. Exploratory and confirmatory factor analyses showed that the auditory tasks combined with established visual measures to define latent Gs and reaction time factors. These findings provide preliminary evidence that suggests that if auditory tasks are developed that maintain the same cognitive requirements as existing visual measures, then they are likely to index similar cognitive processes.
In the past 100-odd years of research exploring human intelligence only a select few studies have adequately explored whether known broad cognitive abilities can be identified when tests are presented via modalities other than visual (see Danthiir, Roberts, Pallier, & Stankov, 2001; Horn & Stankov, 1982; Roberts, Stankov, Pallier, & Bradley, 1997; Stankov, Seizova-Cajic, & Roberts, 2001). The abilities referred to are those identified in current taxonomies of human intelligence—including theory of fluid intelligence and crystallized intelligence (Gf–Gc theory; see, for example, Horn & Noll, 1994) and Carroll’s (1993) three-stratum theory—and the issue is of interest because the extent to which these abilities might reflect modality-specific versus general cognitive processes is not entirely clear. Moreover, it has been noted previously that an adequate description of intelligence will reflect knowledge of the basic forms in which it is manifest within each of our sensory–perceptual modalities (Horn & Stankov, 1982). This knowledge is still lacking.
There is reason to suppose that intelligence is revealed other than just via the visual system. Consider the auditory modality: It is the prime channel for communicating and acquiring information during infancy, and this reliance only shifts to the visual system at about 5 years of age (Sloutsky & Napolitano, 2003). Thus, auditory abilities are crucial for the normal development of intelligence, and children with hearing impairments, or total hearing loss, are disadvantaged because of lack of exposure to abstract concepts (Stankov, 1994). Research showing that the average IQ of deaf people is lower than that of people with normal hearing (Vernon, 2005) and of the blind (see Stankov, 1994) supports the integral role audition plays in human intellectual functioning.
Despite this obvious importance, audition has been referred to as the neglected domain in intelligence models and tests (Seidel, 2005). Stankov (1971), for example, long ago noted that prior to his PhD study there was nothing in the field of intelligence research concerned specifically with general auditory intelligence (Ga). Although previous research had explored the various abilities manifested in the auditory modality, unlike Stankov’s study, these studies were not themselves concerned with how auditory abilities position themselves within the taxonomy of intelligence or relate to existing cognitive abilities (for a review of this auditory research see Shuter-Dyson, 1968; Shuter-Dyson & Gabriel, 1981). More than two decades after Stankov, Carroll (1993) noted again that evidence on the structure of auditory abilities remained scant because most factor-analytic studies had “totally neglected the domain of auditory abilities” (p. 365). Carroll’s and Stankov’s concerns have remained unheeded, however, and Seidel (2008) recently reiterated the ongoing neglect of putative auditory cognitive abilities. Our understanding of general auditory intelligence (Ga) has progressed. However, research concerning how these auditory abilities relate to established broad intellectual factors (e.g., Gf) and other traditional measures of intelligence remains scarce.
Stankov (1994) has previously proposed that auditory abilities form three hierarchically organized layers comprising sensory, perceptual, and thinking processes. Abilities at the sensory level relate weakly with each other as well as to the higher order processes (Seidel, 2008), and they relate weakly to abilities in other sensory modalities. They are best measured using acuity tasks that determine thresholds for frequency discrimination, loudness discrimination, spatial localization, and the like. At the highest thinking level, however, the abilities are intellective in nature and the reliance on audition is incidental. Auditory speech abilities are an example of this highest level. According to Carroll (1993), speech abilities rely not on the sensory and thus modality-specific aspects of the tasks, but rather on the ability to grasp the complex and demanding relationships among elements of the problem (Stankov, 1994). In this sense, these auditory speech tasks are similar to traditional visual Gc marker tests in which performance does not rely so much on the perception of two visually presented words, for example, but rather on the cognitive processing required to decide whether they are synonyms or antonyms. According to this logic then, it would appear that broad cognitive abilities that have been traditionally measured using visual tasks might also be measurable using the auditory modality provided that the auditory tasks are designed to maintain the same cognitive requirements as corresponding visual tasks, as opposed to more modality-specific type processes.
Some of Stankov and Horn’s studies (Horn & Stankov, 1982; Stankov, 1978; Stankov & Horn, 1980) support this theory. Correlations between a select few auditory tasks and broad factors defined by traditional visual measures suggest that Gf and Gc can be measured auditorily. Listening to verbal comprehension, for example, loads moderately on Gc (Horn & Stankov, 1982), whereas tonal series and chord series have been shown to load on Gf (Stankov, Horn, & Roy, 1980). Elsewhere, there is evidence that auditory temporal discrimination tasks might possibly relate to memory functions (see, for example, Stankov et al., 1980; Zajac & Burns, in press), and indeed, the Woodcock-Johnson III Tests of Cognitive Abilities (Woodcock, McGrew, & Mather, 2001) includes auditory measures of short- and long-term memory, which are considered independent from the Ga tasks in that battery. The research literature regarding so-called elementary cognitive tasks (ECTs) indicates that there might also be a link between performance on auditory ECTs and general speed of processing (Gs). For example, studies of auditory inspection time (AIT) suggest the existence of a relationship between auditory functions measured by AIT tasks and Gs-type abilities, with the spatial version of AIT exhibiting stronger and more consistent relationships in this regard than other versions of this task (see Zajac & Burns, 2007, 2011 for a detailed review of AIT research). Similarly, visual RT (VRT) tasks relate well to Gs (Danthiir, 2005; Danthiir, Wilhelm, Schulze, & Roberts, 2005), and they also relate strongly to auditory reaction time (ART) tasks (Sen, Jensen, Sen, & Arora, 1983). Given the apparently similar processes tapped by them, it is plausible that ART might also relate to broad Gs, and there appears some preliminary evidence supporting this idea (Zajac & Burns, in press).
A pertinent issue concerning these putative relationships between auditory tasks and broad abilities other than Ga is that there have been few such reports, and they have received little attention because the studies have been primarily interested in auditory abilities themselves. Moreover, in studies that have reported such relationships, the broad abilities with which the auditory tasks correlate have generally been poorly defined, often being measured by only a single marker test. Consequently, this leaves these associations open to many different interpretations.
The purpose of the current study was to begin to fill the void in research concerning the relationship of auditory abilities to other, specific broad factors in the taxonomy of intelligence. Rather than adopting the approach of administering a battery of auditory tasks and subsequently assessing their correlations with traditional ability measures, this study aimed to explore whether auditory tasks can be purpose designed to measure a single, specific broad factor. We felt this method was advantageous because it potentially permits an understanding of the relationship of auditory abilities to a specific broad ability as well as providing a new understanding of the broad ability itself. More specifically, if auditory tasks are developed that maintain the same cognitive requirements as visual tasks, then the visual and auditory tasks should correlate well. However, if no relationships are found, it may be necessary to question the generality of the relevant broad ability and why it was not possible to measure it auditorily, for instance, “Should this broad ability be regarded as vision specific, given that only visual tests appear to define it?”
The present study focused on the broad ability Gs for two reasons: First, some existing ECTs such as ART and AIT have been suggested as measuring Gs, but they have never been systematically investigated. Second, traditional Gs tests are quick and easy tasks, and many lend themselves readily to adaptation to presentation in the auditory modality. When developing new auditory tasks, the nature of Gs must be carefully considered and preserved if the tasks are to prove successful. In short, Gs subsumes intellectually easy tasks that require rapid scanning and responding (Horn & Noll, 1994). The elementary nature of these tasks is paramount because this is what distinguishes Gs from higher level (accuracy-based) factors, where performance is a function of difficulty. Controlling item difficulty in pure tests of speed ensures that performance only reflects the rate at which participants complete the items in the test (Carroll, 1993). Thus, the rationale for this research dictated that auditory tests be obtained or designed to represent processes analogous to existing visual Gs marker tests. Therefore, some tasks have been adapted from previous work—such as ART—whereas others were newly developed. Regarding the latter, we selected visual tasks that we thought could be translated into an auditory format, thereby ensuring consistency in the cognitive requirements across modalities. Examples of these visual Gs tasks include Symbol Digit (McPherson & Burns, 2005), Number Comparisons (Ekstrom, French, Harman, & Derman, 1976), and Finding As (Danthiir et al., 2005).
The study reported herein was designed to pilot these new auditory tasks. Our primary aims were to (a) gather data regarding the test–retest reliability of these auditory measures; (b) examine the correlations between the auditory and visual tasks, specifically the auditory/visual analogous; and (c) explore the underlying factor structure of the auditory and visual tasks to determine whether they load on the same factors as opposed to modality-specific type factors.
Method
Participants
Participants were (N = 96) undergraduate psychology students of the University of Adelaide. There were 69 females and 27 males, and the mean age of the sample was 20.0 years (SD = 4.0 years). All participated as part of their 1st-year psychology course requirements.
Apparatus
The presentation of all tasks and recording of responses were controlled by one of three identical Pentium 4 class computers. Visual stimuli were presented on 17-inch LCDs. Auditory stimuli were presented via Sony MDR-XD100 stereo headphones. All auditory tones were calibrated prior to the study using a Radio Shack 33-4050 Sound Level Meter.
RT Measures
Simple ART
To begin each trial, the participant pressed the number “5” key in the numeric keypad of the keyboard. This key acted as a nonfunctional home button only and ensured that responses originated from the same position on each trial. After 300 ms a cue-tone (100 ms at 880 Hz) was presented, followed, after a silent interval of variable duration (1,300 ms, 1,700 ms, 2,100 ms, or 2,500 ms), by a target tone—a 500 ms “bell” sound centered on a frequency of 800 Hz. Participants lifted their finger off the number “5” key and pressed the number “8” key as quickly and as accurately as possible. Participants were required to complete 10 correct trials out of 10 before they proceeded to the test. The outcome measure was mean RT—time between onset of target and pressing of response key—calculated after the removal of outliers (±3 SD) and errors.
Two-choice ART (ART2)
The target tone in this task was presented to the left or right ear only. Participants responded by pressing the number “4” key if the target tone was played to the left ear or number “6” if it was played to the right ear. All other aspects of the task were identical to ART.
Three-choice ART (ART3)
During this task, the target tone was presented to the left ear only, both ears, or right ear only. Participants responded by pressing the number “4” key in the numeric keypad for the left ear, number “8” if it was played to both ears, or number “6” for the right ear. All other aspects of the task were identical to ART.
VRT
This task was functionally equivalent to ART but required participants to respond on the illumination of an empty circle, 4 cm in diameter, presented against the black background of the computer screen. The white outline of the circle was presented at the onset of each trial and acted as a cue, and the circle illuminated red after a variable duration of 1,300; 1,700; 2,100; or 2,500 ms.
General Speed of Processing Measures
Symbol Digit
A computerized coding task was used as a measure of Gs (see McPherson & Burns, 2005, for a detailed description of this task). A code table was presented at the top of the computer screen throughout the task. This comprised nine symbols arranged horizontally to which nine digits, presented directly beneath them, were paired. For each item, one symbol was presented in the center of the computer screen and participants responded by left clicking the mouse on its corresponding digit in a 3 × 3 numerical grid positioned at the bottom of the screen. Subsequent items did not commence until a correct response was registered. Participants were required to complete two practice trials correctly before they proceeded to the test. The outcome measure was the number of items correctly completed in 2 min.
Audio code (AC)
This task was developed to be an auditory analogue of the Symbol Digit task described above. A code table was displayed at the top of the computer screen for the duration of the task, comprising of pictures of eight musical instruments arranged horizontally, to which one of the numbers one through eight was paired. The instruments include a snare drum, trumpet, guitar, cymbals, piano, bell, harp, and violin. For each item, the sound of one of the instruments was presented via headphones at an intensity of 65 dB. Participants responded by left clicking the mouse on its corresponding digit in a 2 × 4 numerical response grid positioned at the bottom of the screen. Subsequent items commenced after a response was registered. Participants completed two familiarization phases: In the first, instrument names were presented and participants clicked on the corresponding instrument (two trials each) and in the second, instrument sounds were presented instead of text (two trials each). Following this, participants were required to complete four test trials for each instrument correctly before they could proceed to the test phase. The outcome measure was the number of items correctly completed in 2 min.
Chasing-digits auditory (CDA)
This was designed to be an auditory analogue of the digit–digit task used by McPherson and Burns (2005), which was found to share substantial variance with Gs marker tests. It incorporated a 3 × 3 numerical response grid positioned in the center of the computer screen against a black background. For each item, one of the digits, one through nine, was presented auditorily to participants via headphones at an intensity of 65 dB; trial order was pseudorandomized with the restriction that no digit could be presented on successive trials. The participant responded as quickly and accurately as possible by left clicking the mouse on the corresponding number in the response grid. Subsequent items commenced 200 ms following the response. Participants were required to complete 10 correct trials out of 10 before they proceeded to the test. The outcome measure was the number of items correctly completed in 60 s.
Tone comparisons (TC)
This task was developed to be an auditory analogue of Number Comparisons from the Kit of Factor-Referenced Cognitive Tests (Ekstrom et al., 1976). Trials consisted of two sequentially presented tones, which were identical or differed by either a semitone or tone. Tones were presented at an intensity of 65 dB, and participants clicked the on-screen response button “Yes” if they thought the tones were identical or “No” if they were different. Participants were required to complete five correct trials out of five before they proceeded to the test. The outcome measure was the number of items correctly completed in 90 s.
Hearing As (HAS)
This task was an auditory version of the search task, Finding As (see, for example, Danthiir et al., 2005; Roberts & Stankov, 1999). In this version, stimuli were nouns, five to eight letters in length. All words had a concreteness-of-imagery value of 600 or above, on a scale ranging from 100 to 700; the lowest value indicated maximum abstractness and the highest indicated maximum concreteness. Of the 60 words, 15 contained the letter “A,” and all of these used the long vowel pronunciation. The purpose of this was to reduce any potential spelling confusion that might occur for the short vowel sound—where the pronunciation of the “A” is not as distinct—or in the case of silent “A.” Participants were informed of this restriction.
Words were presented pseudorandomly—one at a time—at an intensity of 65 dB. To respond, participants pressed the on-screen button “Yes,” if the word contained an “A” or “No,” if it did not. Participants were required to complete five correct trials out of five before they proceeded to the test, and practice trials used different stimuli to the test phase. The outcome measure was the number of items correctly completed in 90 s.
Visual Inspection Time (VIT)
The vertical lines inspection time task was used to estimate VIT. Stimuli were presented on a video monitor at a viewing distance of approximately 60 cm. Preceding the target figure was a warning cue of approximately 520 ms; the cue was a small white plus (+) sign measuring 6 × 6 mm presented in the center of the computer screen. The target figure consisted of two vertical lines: one measured 15 mm and the other 30 mm. These were joined at the top by a horizontal line of approximately 18 mm. The shorter line appeared on either side of the target figure equiprobably. A “flash mask” (see Evans & Nettelbeck, 1993) of 375 ms immediately replaced the target figure and consisted of two vertical lines 35 mm in length, shaped as lightning bolts. Participants indicated on which side the short line appeared by clicking either the left or right mouse button, respectively. Practice trials required 10 correct trials out of 10 with stimulus onset asynchrony (SOA) of approximately 835 ms, 10 correct trials out of 10 with SOA approximately 420 ms, and 9 correct trials out of 10 with SOA approximately 250 ms. The estimation process began with SOA approximately 250 ms and followed an adaptive staircase algorithm (Wetherill & Levitt, 1965). The average SOA—or mean VIT threshold—was calculated over eight reversals of direction on the staircase, giving an estimate of the SOA with an associated probability of 79% of making a correct response.
Procedure
On arriving at the testing session, participants were seated in a cubicle in our laboratory, and they were guided through the test battery automatically by the computer. Detailed instructions and practice phases were presented prior to the onset of each task, and the first author was present to answer any questions. Participants completed the tasks in the following order: ART, CD, HAS, VIT, AC, ART2, TC, ART3, Symbol Digit, and VRT. Each RT task consisted of 60 trials, and the total testing session lasted for 1 hr and 45 min.
To obtain test–retest reliability estimates for the new auditory tasks, n = 17 participants returned 6 weeks after the initial testing session. Because of limited time, participants completed ART2 only, along with the new tests AC, CD, HAS, and TC. Test–retest reliability estimates were not obtained for the VIT task because of time restrictions and the fact that it is typically good (see Kranzler & Jensen, 1989).
Results
Data Preparation
Outliers (±3 SD) and errors were removed from individual RT data files and the average number of trials used to calculate RT scores was as follows: ART (M = 58.49, SD = 1.20), ART2 (M = 58.33, SD = 1.98), ART3 (M = 57.35, SD = 2.04), and VRT (M = 58.58, SD = 0.81). Across the remaining variables, there were three missing values and eight outliers (i.e., ±3 SD). These values were deleted and subsequently imputed using the expectation maximization algorithm in SPSS v.15.
Reliability Estimates
Table 1 presents reliability estimates for the tasks. Split-half reliability is presented where possible and test–retest estimates are provided for the auditory measures. As can be seen, reliability was generally good, with split-half and test–retest estimates being acceptable for the new auditory measures.
Split-Half and Test–Retest Reliability Estimates (n = 17)

Note: VRT = visual reaction time; ART = simple auditory reaction time; ART2 = two-choice auditory reaction time; ART3 = three-choice auditory reaction time; CDA = chasing-digits auditory; SD = Symbol Digit; AC = audio code; HAs = Hearing As; TC = tone comparisons. CDA, SD, AC, TC, HAS = items. All else = ms.
Descriptive Statistics and Correlations
Table 2 presents the descriptive statistics for the test battery. Of interest is that, although AC maintained very similar cognitive requirements to Symbol Digit, the number of items completed was markedly lower, t(95) = 18.34, p < .001, d = 1.80. The simple RT tasks showed the opposite effect, however, with ART performance being significantly faster than for VRT, t(95) = 7.62, p < .001, d = 0.66.
Descriptive Statistics for All Measures
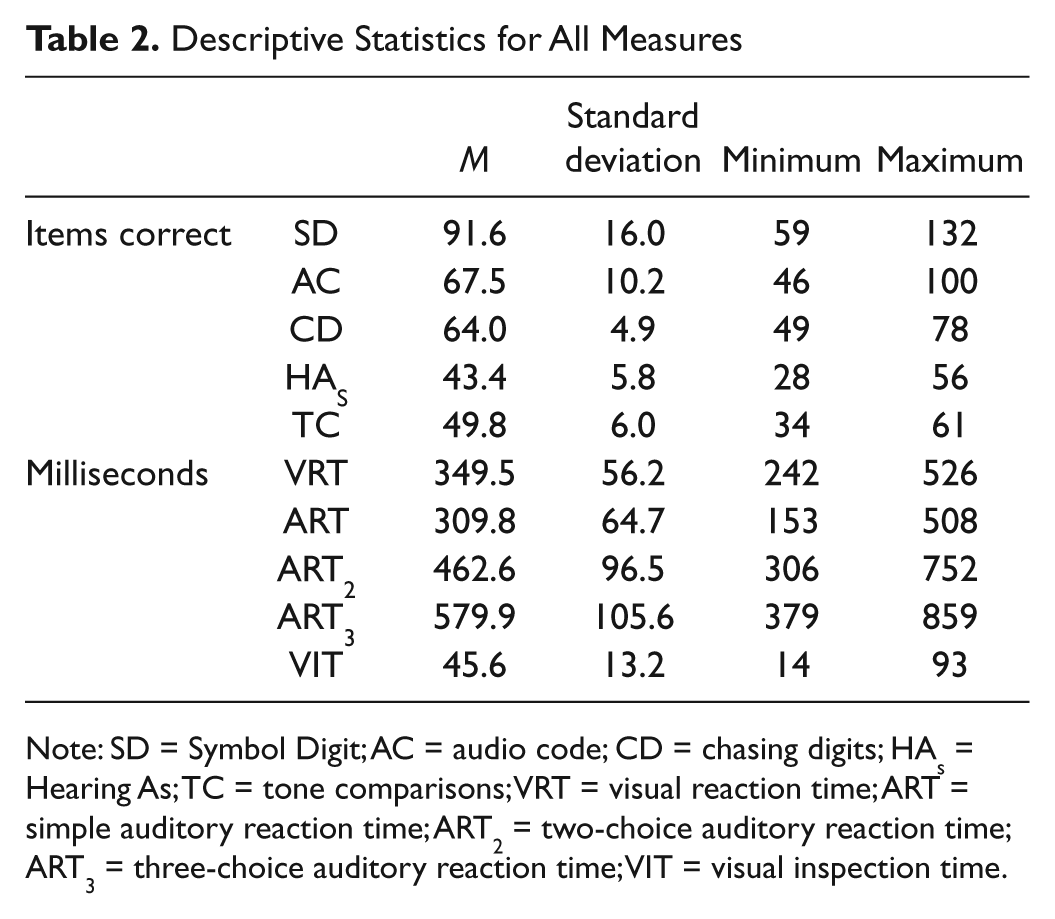
Note: SD = Symbol Digit; AC = audio code; CD = chasing digits; HAs = Hearing As; TC = tone comparisons; VRT = visual reaction time; ART = simple auditory reaction time; ART2 = two-choice auditory reaction time; ART3 = three-choice auditory reaction time; VIT = visual inspection time.
Table 3 shows the full correlation matrix for all measures. To summarize, AC and Symbol Digit correlated moderately, suggesting that they measure a similar construct. The simple RT tasks—ART and VRT—also correlated strongly. HAS, CD, and TC were developed based on existing Gs marker tests, and they related weakly to AC and Symbol Digit, and shared variance with the RT measures also. The RT tasks generally correlated moderate-to-strongly with each other.
Full Correlation Matrix
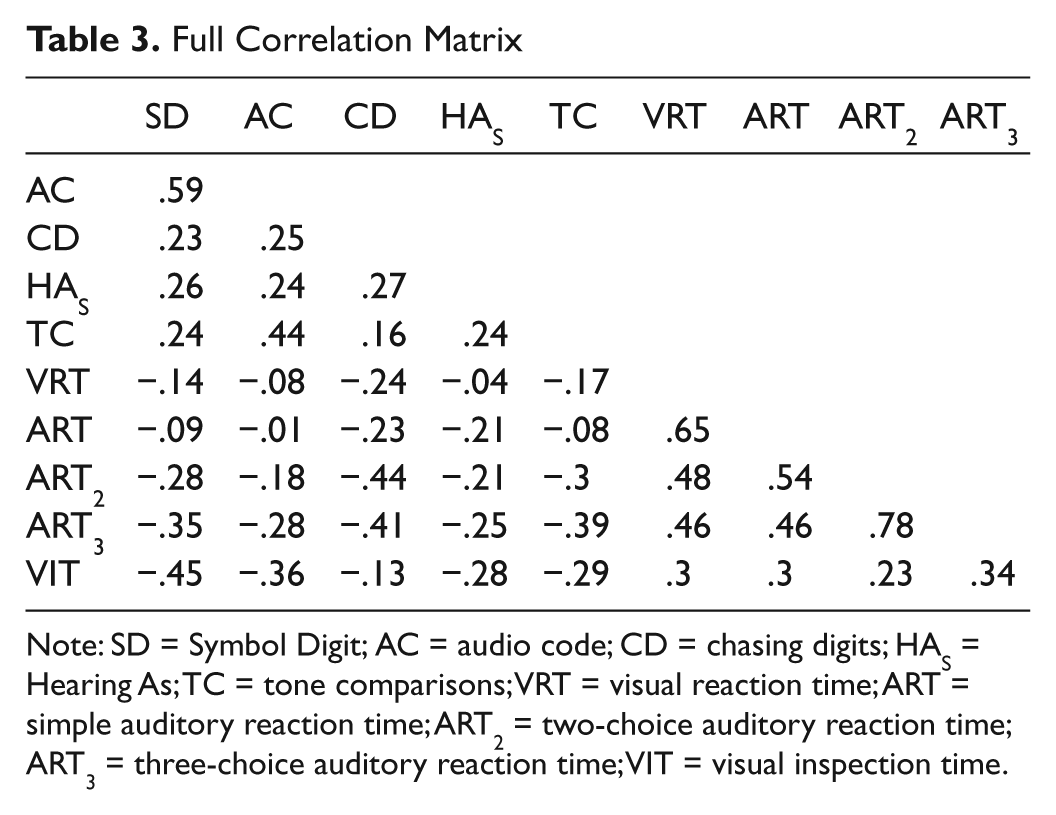
Note: SD = Symbol Digit; AC = audio code; CD = chasing digits; HAS = Hearing As; TC = tone comparisons; VRT = visual reaction time; ART = simple auditory reaction time; ART2 = two-choice auditory reaction time; ART3 = three-choice auditory reaction time; VIT = visual inspection time.
Factor Analysis
As we had developed the auditory measures to be analogous to existing visual speed tasks, we had explicit expectations about the factorial structure underpinning the test battery. Specifically, we expected that RT tasks would define a latent RT factor and that AC, Symbol Digit, HAS, TC, CD, and VIT would define a latent Gs factor. Despite these hypotheses, rather than use confirmatory factor analysis (CFA) in first instance, we erred on the side of caution and instead used exploratory factor analysis (EFA) to assess whether this expected structure would emerge naturally.
First, we explored the suitability of the data for EFA using Bartlett’s Test of Sphericity, χ2(340) = 45.00, p < .001, and the Measure of Sampling Adequacy (.75), and both showed that the data were acceptable for EFA. Next, the visual and auditory speed tasks were entered into a principal components analysis. There were two components with eigenvalues greater than 1 (3.75 and 1.69) accounting for 37.5% and 16.9% of the variance respectively. An inspection of the scree plot confirmed two dominant factors. Using the eigenvalue and scree criteria as a guide, we extracted two factors using maximum likelihood estimation with promax rotation. Table 4 presents the results of these analyses.
Item Loadings on the First Unrotated Principal Components, the Two Promax-Rotated Factors, and the Correlation Between Rotated Factors

Note: PCA = principal components analysis; ML = maximum likelihood solution; F1 = Factor 1; GS = general speed of processing; AC = audio code; CD = chasing digits; HAs = Hearing As; TC = tone comparisons; SD = Symbol Digit; VRT = visual reaction time; ART = simple auditory reaction time; ART2 = two-choice auditory reaction time; ART3 = three-choice auditory reaction time; VIT = visual inspection time.
As can be seen, the expected structure emerged well. There is a clear RT factor defined by the visual and auditory RT measures. There is also a possible speediness (Gs) factor defined by the remaining visual and auditory speed tasks. Of interest, although it was assumed that CD would share more in common with the Gs-type measures, it appears to load more strongly on the RT factor.
We tested the reliability of this EFA solution in Mplus (Muthen & Muthen, 1998) using CFA with maximum likelihood estimation. In our first model, we tried to confine CD to the Gs factor as per our initial expectations, but despite all tasks having moderate loadings, results showed that the fit of the model was not adequate, χ2(34) = 88.49, p < .001, comparative fit index [CFI] = .80, root mean square error of approximation [RMSEA] = .13, standardized root mean square residual [SRMR] = .09. Therefore, we followed the EFA solution with regards to CD as well as the theoretically sensible suggestion of modification indices to allow the residuals of ART and VRT to covary. Permitting these changes in a subsequent model resulted in adequate fit, χ2(33) = 53.13, p = .01, CFI = .93, RMSEA = .08, SRMR = .06. This model is shown in Figure 1. As can be seen, the correlation between the RT and Gs factors was moderately strong and in the expected direction. Importantly, loadings of the visual tasks—Symbol Digit, VIT, and VRT—were as strong as those for the auditory tasks suggesting that the latent factors may not be reflecting modality-specific processes.

Latent structure of auditory and visual speed tasks.
Discussion
The purpose of the present study was to pilot some newly developed auditory tasks designed to measure the broad ability Gs. The tasks were derived from existing paradigms or were purpose-developed to maintain the cognitive requirements of established visually presented Gs marker tests. To the extent that the auditory tasks were successful measures of Gs, we expected to find correlations between them and visual Gs tasks that have typically measured speed of processing.
First, we assessed the reliability of the auditory measures and found these to be generally acceptable. Of particular interest were the new auditory measures, with the strong split-half reliability estimates indicating that the constructs measured by these tests did not appear to change much during the course of completing them. This provides some evidence that item difficulty was consistent within the individual measures, an important characteristic of speed tasks because it ensures that performance reflects the rate at which examinees complete the items in the test, rather than item difficulty (Carroll, 1993). Test–retest reliability estimates were collected approximately 6 weeks after initial testing, and they were also acceptable, showing that the measurement constructs did not alter over this period.
Second, EFA suggested that two latent factors underpinned performance on the auditory and visual tasks. Based on factor loadings, these were identified as latent RT and Gs. Subsequent confirmatory analysis supported this solution, and latent RT and Gs factors shared 35% of their variance. Importantly, the two visual tests loading on Gs (VIT, Symbol Digit) had moderate loadings of a similar magnitude to the auditory measures on this factor. Similarly, VRT loaded on RT moderately and comparably with the three ART tasks. This suggests that both the Gs and RT factors might not be reflecting auditory-specific processes because, if this were so, the loadings of visual tasks on these factors might be expected to be markedly weaker than those observed herein.
As already noted, these data were collected during a pilot study of auditory tasks, and consequently, these results should be considered in light of several limitations. For example, test–retest reliability estimates were only gathered for a relatively small subsample of participants. Thus, although they appeared adequate in the present study in terms of their magnitude, they need to be replicated in a larger sample. Similarly, for the CFA undertaken herein, the present sample of N = 96 should not be considered optimal. Future investigations of these auditory tasks should increase sample size to at least N = 200 to ensure these complex procedures have sufficient statistical power (see, for example, Barrett, 2007).Based on the above analyses, which showed that auditory and visual tasks combined to define latent factors and that the loadings of visual tasks relative to auditory tasks were comparable, we have speculated that the speed factors may not be modality specific but rather reflect cognitive processes underpinning performance across all tasks. It is certainly the case, however, that visual tasks are underrepresented in this pilot study, and this is a serious limitation. The number of visual tasks was limited due to the nature of this pilot study and in light of time restrictions on participant testing. Elsewhere, it has been noted that the identification of latent factors generally requires three or more measures (Carroll, 1993, p. 52). Thus, it is entirely plausible that distinct visual speed factors did not emerge during the present analyses because we did not meet this requirement for the visual tasks. It is essential that this issue be addressed in future research by ensuring that a sufficient number of tasks from each modality are used to permit the identification or otherwise of modality-specific speed factors. An alternate method of exploring this issue would include administering more typical auditory ability (Ga) tests in conjunction with these auditory speed tasks and examining their shared variance.
Notwithstanding these limitations, the present study provides preliminary evidence that broad cognitive abilities such as general speediness (Gs) might be measurable via alternate modalities such as audition. It appears that if auditory tasks are designed to engage the same cognitive processes as visual tasks, then they should index the same broad cognitive abilities. These preliminary findings should at least encourage research into other broad abilities and the extent to which they might be measured auditorily. Such research might ultimately result in the development of more “truly balanced” measures of intelligence (Horn, 1968).
Footnotes
The author(s) declared no potential conflicts of interest with respect to the research, authorship, and/or publication of this article.
The author(s) received no financial support for the research and/or authorship of this article.