
Abstract
Introduction and Objectives:
A pediatric group with 25 clinics and 150 providers used multifaceted approaches to implement workflow processes and an electronic health record (EHR) flowsheet to improve child developmental screening. The key outcome was developmental screening done for every patient during 3 periods between ages 8 and 36 months. Identification of developmental concerns was the secondary study outcome. Screening rates and referrals were hypothesized to be optimized for children regardless of demographic backgrounds.
Methods:
During preventive visits, developmental screens targeted patients in age groups 8 to 12, 13 to 24, and 25 to 36 months. EHRs were analyzed for screening documentation, results, and referrals by patient demographics. Fifteen pediatric professionals were interviewed about their qualitative experiences. Quality improvement interventions included appointing clinic champions, training staff about the screening process and responsibilities, using a standardized tool, employing plan-do-study-act cycles, posting EHR prompts, providing financial incentives, and monitoring screening rates using control charts.
Results:
Within 25 months, screening rates improved from 60% to >95% within the 3 preventive visit age groups for a total of more than 30 000 children. Professionals valued the team process improvements. Children enrolled in Medicaid, black children, and those living in lower income zip codes had lower screening rates than privately insured, white children, and those living in higher income areas. Ages and Stages Questionnaire 3rd edition results were significantly different by gender, race/ethnicity, insurance, and income categories across all groups. Referral rates varied by race/ethnicity and zip code of residence.
Conclusions:
This project resulted in an effective and efficient process to improve child developmental screening that was valued by pediatric professionals. Analyses of patient demographics revealed disparities in services for the most vulnerable families. Ongoing quality improvement, health services research, and advocacy offer hope to improve health equity.
Introduction
During the past 20 years, pediatric and family medicine practices have been working to improve child developmental screening. Universal screening during preventive visits has enabled early detection of developmental concerns and referral for specific diagnoses, therapeutic services, and support.
Despite more than a decade of initiatives, rates of developmental screening have remained low. 1 The American Academy of Pediatrics has published a policy statement to establish a universal system of developmental surveillance and screening for the early identification of conditions that effect children’s development and achievement. 2 Developing a cohesive system to improve developmental screening is needed to optimize health outcomes for children through early intervention and referral to supportive services. 3
At our large, multi-site pediatric group, we have been interested in continually improving screening practices and ensuring equitable delivery of screening and referrals. In this article, we first describe our process for improving developmental screening. We then summarize results of key informant interviews of pediatric professionals about the process changes. Finally, we address several questions of interest to primary care practices and their community partners nationally working to improve delivery of developmental screening and health equity for vulnerable children and families. The objective of the study is to introduce the modified screening process and explore associations of child demographics with Ages and Stages Questionnaire, 3rd edition (ASQ) screening rates, screening results, and referral rates for children age 8 to 36 months seen during preventive visits. The study also describes implications of these findings to improve primary care practices, advance health equity, and guide further research.
Methods
Practice Population
The project was done at Children’s Medical Group, the primary care division of Children’s Wisconsin, a private, non-profit, free-standing pediatric health system in the Milwaukee area. The pediatric group is comprised of 25 clinics with 150 pediatricians and nurse practitioners serving urban and suburban locations in southeastern Wisconsin. Prior to 2017, the group lacked centralized guidance and clinics had wide variation in developmental screening champions, training, standardization, and monitoring. In February 2017, an improved process for developmental screening was implemented across all practices using the ASQ at patient ages 9, 18, and 30 months as recommended by the American Academy of Pediatrics. 4 The quality improvement process followed the Model for Improvement framework. 5 We asked what are we trying to accomplish, how will we know that a change is an improvement, and what change can we make that will result in improvement. We used plan, do, study, act cycles to continually improve processes.
Interventions
Quality improvement interventions included appointing clinic champions, training staff about the screening process and responsibilities, using standardized tool, employing plan-do-study-act cycles, posting EHR prompts, providing financial incentives, and monitoring screening rates using control charts. Tactics included provider and staff engagement, education, workflow refinement, data transparency, communication cascade to support full scale implementation and ongoing process review along with incentives to support sustainment. The workflow process and potential risks in the process are shown in Figure 1.

Clinic workflow for developmental screening process and risks in the process.
Data Sources
All ASQ results were documented in a flowsheet in the Epic electronic health record (EHR, Figure 2). Information entered in the flowsheet and the demographic section of Epic was used to generate data in iNSIGHT Health Catalyst warehouse. Reporting was developed from the data warehouse and published to the Children’s SQL Server Reporting System. Two reports were created to evaluate developmental screening. One measures rates of compliance to screening recommendations for a given measurement period, the other displays data showing aggregated results of screens for a given period.

Example of electronic record ASQ flowsheet and referral reminder.
Measures
The logic for the project process measure was designed to address the Model for Improvement question—How will we know that change is an improvement? National measures use a yearly calculation—measuring whether a child, turning 1, 2, or 3 years of age, had a screen in the previous 12 months. 5 The yearly measure would not have provided timely information. As screens are performed at 9, 18, and 30 months of age, an improvement might not be recognized for 3 to 6 months after an intervention was made. To overcome this limitation, we created a more complex logic to measure improvement rapidly. The population being measured was defined by children with a preventive visit in 3 age groupings: 8 to 12 months, 13 to 24 months, and 25 to 36 months. A child appeared in the denominator and numerator immediately during the measurement period for the appropriate age range when a screen was documented. A child appeared in the denominator and not in the numerator, if the child aged out of an age range during a measurement period without a documented screen in the age range. If a child aged out of an age range during the measurement period and had a screen in the age range but prior to the measurement period, they were counted in the denominator and numerator. If a child had a preventive visit during the measurement period but did not have a screen and did not age out of the age range, they were excluded from the measure. If a child was present in more than 1 age range in a measurement period, they were included in all appropriate age ranges. Thus, the measurement logic represented both an encounter and patient level hybrid measure. The report could be filtered by measurement period, clinic location, primary provider, patient insurance, race/ethnicity, and zip code of residence.
In summary, the logic to determine rate of screening by age range was:
Inclusion criteria: preventive visit in the age range in the measurement period
Exclusion criteria: no ASQ documented AND not aged out of the age range in the measurement period
Numerator: documented ASQ in an age range during a measurement period
Denominator: preventive visit in age range during measurement period with documented ASQ or with no ASQ and aged out of age range during measurement period.
This information was displayed in the primary care quality application and viewable by all providers. ASQ rates were financially incentivized for individual pediatricians as a pay for performance bonus. High screening rates have been maintained in the absence of the incentive. Screening rates were shared quarterly with each clinic. Average screening rates were chosen as a primary care balanced scorecard measure and communicated to the system board of directors.
Qualitative Data Analysis
In order to understand the pediatric professional experience with the process improvement, a medical student performed 30 to 60-min interviews with pediatricians, nurses, and practice managers about team member’s roles, their view of the strengths and weaknesses of the ASQ tool and screening process, training and motivation to perform screening, impact on the practice, and recommended changes to the process. Notes from the interviews were aggregated and summarized. A neutral research assistant performed a standardized, open-ended interview of 17 personnel from 8 diverse practices to improve the reliability of the responses and rigor of the evaluation. The student noted answers to the questions and grouped positive and negative themes for each question. With the student, the principal investigator and quality improvement director reviewed and named the themes and identified patterns for reporting.
Children’s Wisconsin and the Medical College of Wisconsin (MCW) partnered in analyzing the patients’ experiences of the developmental screening process. MCW is an affiliated private, non-profit, free-standing health science university and academic medical center. The Children’s Wisconsin Human Research Review Board deemed the study protocol to be quality improvement.
Outcomes
The key outcome goal was ASQ screening done for every patient during each of the 3 age ranges. Data was extracted from the Children’s Wisconsin warehouse, de-identified, and transferred to MCW for analysis. Data analysis was performed separately for subgroups of children ages 8 to 12 months, 13 to 24 months, and 25 to 36 months. Children with at least 1 preventive visit during each age range with complete follow-up (meaning they had since aged out of this range) were included in each analytic subgroup. Compliance with ASQ screening was defined as at least 1 ASQ screening result documented in the Epic flowsheet during the age range or a reason reported by the pediatrician for not screening. Reasons for not screening included patients with known major developmental delays, enrolled in Medicaid fee-for-service due to neurodevelopment disabilities, or enrolled in early intervention.
Quantitative Data Analysis
Child characteristics were summarized within each age group using frequencies and percentages for categorical variables and means, standard deviations, and medians for continuous variables. Demographic information included gender, race/ethnicity, health insurance, and median income for the zip code of residence. Statistical comparisons were made within each subgroup between child characteristics and ASQ compliance, ASQ results (all reassuring vs monitoring or concerns in at least 1 domain), and referral rates among children with any concerning domain. All tests were performed using simple logistic regression, fitted using generalized estimating equations with exchangeable correlation structure to adjust for clustering within zip codes. All statistical analyses were performed using R version 3.6.0 (2019-04-26) (R Foundation for Statistical Computing).
Results
Within 2 years, the percent screening compliance improved from 60% of patients by age group to greater than 95% and the process became stable and predictable (Figure 3).

Plot of percent ASQ-3 screening during preventive visits by month.
Qualitative Results
Ten pediatricians, 3 practice managers, and 2 nurses at 8 urban or suburban clinic sites participated in the interviews. Their responses reflected a universal positive view of the ASQ tool. Pediatricians were able to delve deeper into assessing a child’s development and the process kept them accountable for milestones that may not otherwise have received as much attention. They felt that the tool allowed them to better monitor a child’s developmental progress by screening them consistently at different time points. Pediatricians were better able to educate parents on the stage of their child’s development and potential concerns highlighted by the screening. Providers stated that the ASQ improved patient outcomes because the standardized screening enabled them to identify developmental concerns and address them at a critical point. The vast majority were motivated to implement the screenings not for monetary compensation or recognition but because it was a direct way to provide better care for patients.
All interviewees felt developmental screening was implemented well into a team approach. Team members were confident as to who was responsible for different roles in the screening process although each site had customized methods. Pediatricians felt that parent engagement was adequate because there were steps in the process to follow up if a screening was not completed. Incorporating the ASQ results into the EHR allowed improved tracking of scores.
A common theme regarding improving the process was parent completion of the screening tool electronically prior to the preventive visit. Although pediatricians felt that most parents completed the ASQ when mailed prior to the visit, many felt a more efficient process could be implemented with electronic data submission directly into the EHR. A notification alerting parents to complete the ASQ prior to the visit might improve efficiency and ease of adding scores in the Epic flowsheet. Moreover, professionals would have access to results prior to the visit. Pediatricians felt some ASQ questions were unclear to parents and needed further explanation and follow up. They also felt that the length of the screening tool hindered parents’ ability to complete it during a visit.
Patient Population
Between April 1, 2017 and April 30, 2019, 10 430 children age 8 to 12 months (infants), 11 257 age 13 to 24 months, and 10 129 age 25 to 36 months (older toddlers) had at least 1 preventive visit when universal ASQ screening was promoted across the pediatric practice.
Approximately two-thirds of patients aged 8 to 36 months were privately insured, one-fourth enrolled in a Medicaid health plan generally due to poverty, and 5% enrolled in Medicaid fee-for-service (FFS) generally due to a disability (Table 1). Approximately 60% of all patients were white, 20% black/African American, and 9% Hispanic/Latino.
Demographics of Children With At Least 1 Preventive Care Visit During Each Age Range.

Quantitative Results
Compliance rates were significantly different by race/ethnicity, insurance, and median ZIP code income categories across all age groups (Table 2). About 73% of children age 8 to 12 months in Medicaid FFS had an ASQ screening done during a preventive visit compared with 84% with other health insurance. Approximately 75% of children age 25 to 36 months in a Medicaid health plan or FFS had a screening done compared with 84% of privately insured. Black children had lower screening rates than others, especially age 25 to 36 months when 75% of black and 83% of white patients were screened. Children residing in lower income zip codes also had lower screening rates.
Associations Between Demographics and ASQ Compliance Within Each Age Group.

ASQ overall screening concerns decreased from 15% at age 8 to 12 months to 12% at age 25 to 36 months. Monitoring and concerning results were most prevalent for gross motor (30%) at age 8 to 12 months, communication (22%) at age 13 to 24 months, and fine motor (18%) at age 25 to 36 months (Table 3).
Summary of ASQ-3 Screening Results by Age Group.
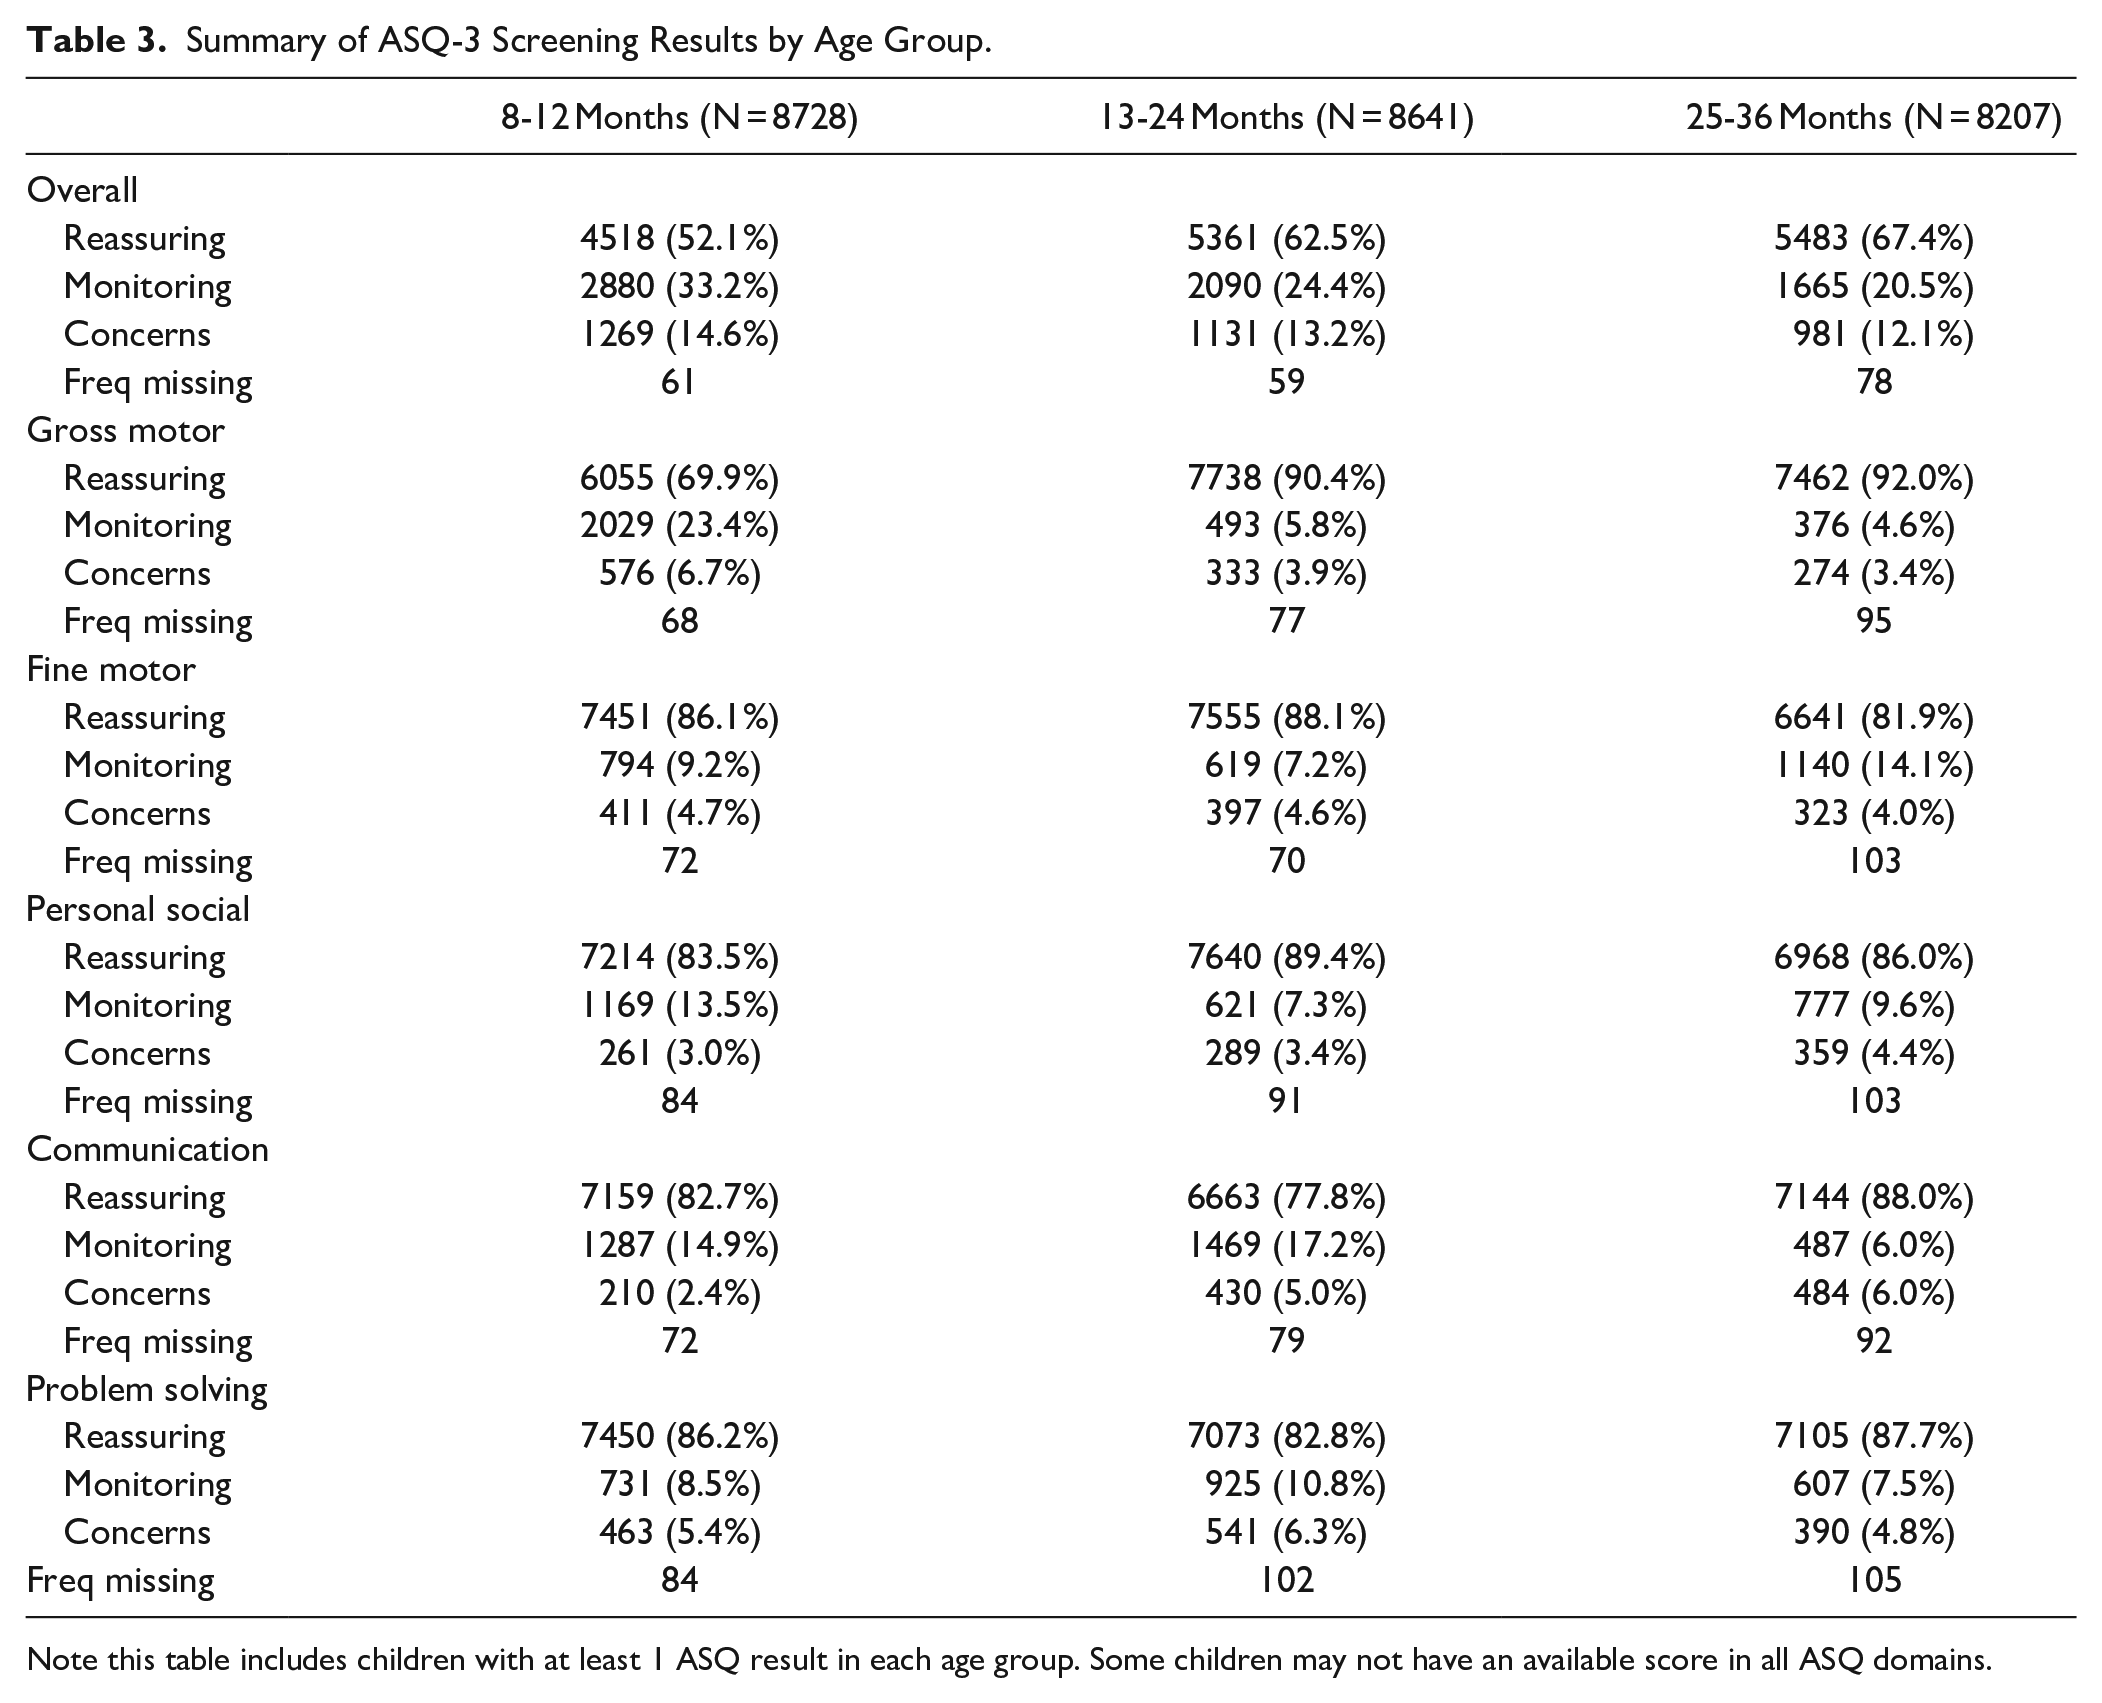
Note this table includes children with at least 1 ASQ result in each age group. Some children may not have an available score in all ASQ domains.
ASQ results were significantly different by gender, race/ethnicity, insurance, and median ZIP code income categories across all age groups (Table 4). Boys with increasing age had a higher prevalence of overall monitoring/concerning results than girls. Most children in Medicaid FFS had monitoring/concerning results. At age 8 to 12 months, children in Medicaid health plans had the highest prevalence (64%) of reassuring results. By ages 25 to 36 months, privately insured children had the highest (71%) reassuring results. 48% of white children had reassuring overall results at age 8 to 12 months and improved to 70% by age 25 to 36 months. At 25 to 36 months, nearly 40% of black/African American and Hispanic/Latino children had monitoring/concerning results. With increasing age, both white and Hispanic children had increases in reassuring results, while Black children had decreases. From 8 to 12 months to 25 to 36 months, children residing in the highest income zip codes improved from 47% to 71% reassuring overall results, while children in the lowest income areas persisted at approximately 60% reassuring results.
Associations Between Child Demographics and ASQ-3 Overall Reassuring Results.

At ages 8 to 12 months, children living in the lowest income areas had the highest referral rate (26%) for concerns and the lowest rate (16%) for continuing current early intervention therapy (Table 5). At ages 13 to 24 months, black/African American children had the highest referral rate (39%) for concerns and the lowest rate (15%) for continuing current therapy. Regardless of age group, there were no significant differences in continuing current therapy and referral rates by child gender or health insurance (Table 5).
Associations Between Child Demographics and Referral Rates for ASQ-3 Overall Concerning Results.

This table includes all children in each age group with any ASQ-3 result of “Concerning.”
Discussion
Developmental surveillance and screening are important activities to integrate into pediatric primary care teams. 4 During a 25-month period, more than 30 000 diverse children aged 8 to 36 months had at least 1 preventive visit when universal ASQ screening was promoted at a large, multi-site pediatric group. Our pediatric practice achieved excellent (>95%) developmental screening rates for children age 8 to 36 months during preventive visits using demonstrated effective quality improvement processes.6-16 Specific improvements included: appointing a champion of an interprofessional project team; training clinicians and staff about a consistent screening process with specific responsibilities; using the standardized ASQ-3 screening tool; employing a Model for Improvement framework; posting EHR prompts; providing financial incentives; and monitoring screening rates using control charts. Pediatric primary care practices can implement these practices to improve quality of care.
Fifteen professionals at 8 sites were interviewed and reported appreciation for the team-based developmental screening process and ASQ to enhance pediatric preventive care. It has become well integrated in practice. Nationally pediatricians’ reported use of a standardized developmental screening tool has tripled from 2002 to 2016, and more pediatricians are making referrals for children with concerns in developmental screening. 10 The EHR flowsheet enabled efficient and reliable documentation of screenings which could be easily reviewed at subsequent visits. Pediatricians recommended increased electronic data entry by parents to improve efficiency.
Developmental screening rates and results varied by child demographics. Children enrolled in Medicaid, black children, and children living in lower income zip codes had lower screening rates than privately insured and white children and those living in higher income areas. A broad array of factors within and beyond the health care system drive disparities in health and health care. These disparities are driven by social and economic inequities. 17 Overall developmental screening concerns decreased from 15% among infants to 12% for older toddlers with higher rates among boys than girls. The gender differences are consistent with other studies. 18
Our developmental screening results by child demographics are consistent with other published findings.19,20 In our study, the highest rates of reassuring results were infants in Medicaid health plans and older toddlers with private insurance. Nearly 40% of older toddlers of color and those living in lowest income areas had monitoring/concerning results compared with 30% of white children and those in higher income areas. Children residing in the highest income zip codes had a higher percentage of reassuring results at 25 to 36 months of age than children in the lowest income zip codes. This is consistent with other studies finding higher rates of developmental delay for children in poverty becoming apparent by age 2 years. 20 Higher income and white children are more likely to be immunized and receive other preventive services such as developmental screening than lower income and black children. 21 Neighborhoods matter for children’s experiences, education, norms, health, development, and outcomes. 22
Racial, ethnic, and language disparities have been well documented in early childhood developmental and behavioral evaluations. 23 African American children growing up poor with toxic stress are at greater risk of academic, behavioral, and health problems. 24 Extensive data shows the punishing reach of racism, especially for black boys. In our study, black/African American children ages 13 to 24 months had the highest referral rate (or continue current therapy) for concerns and the lowest rate for no response/repeat screen. Low-income and children of color are less likely to receive early intervention services. 25 With this awareness, our pediatric group may have over-compensated by referring these patients with developmental concerns for therapy services, especially at central city clinics that serve more vulnerable families. While we did not track actual referral follow-up in this study, we plan to do so in the future. After families are referred for Birth to 3 evaluation, therapy or community support services, interagency systems are needed to monitor and ensure children with developmental concerns can easily access needed services. 26 Cross-sector coordination, particularly between health and early childhood education, is essential to advancing health equity. It will be important to determine family-centered, culturally, and linguistically relevant tools and desired ways of receiving early intervention services as prior studies have found black children are less likely to receive these services than children from other racial and ethnic groups. 27
Further research, advocacy and continuing education will improve the ability of pediatric professionals to form effective partnerships with community agencies to address the social determinants of health when caring for children who live in poverty. 28 Principles and strategies have been identified to guide policy, practice and advocacy to help infants, toddlers and families at higher risk for poor outcomes. 29 Both high quality medical care and community policies and systems to address social determinants of health are needed to ensure child well-being. 30
This study has implications for further research. We did not study utilization of preventive visits by patient demographics; we intend to do so to understand access to and use of preventive services by child demographics. This project did not evaluate follow up practices which are usually not as strong as screening practices. 27 We are establishing partnerships with county Birth to 3 programs and early childhood education centers to strengthen collaboration including data sharing. To advance developmental screening processes, added efforts are needed to enhance referral systems, improve early intervention programs, and provided better tracking of child outcomes. 30 Local speech, physical, and occupational therapy services are excellent but financially constrained. Addressing social/emotional needs is more challenging in traditional early intervention programs. We plan a pre/post time trend analysis of efforts to reduce disparities in screening processes, testing, and referral rates. We also plan to establish data sharing agreements with county Birth to Three programs for feedback about referred patients.
Conclusion
This project resulted in an effective and efficient process to improve child developmental screening that was valued by pediatric professionals. Analyses of patient demographics revealed disparities in services for the most vulnerable families. Children enrolled in Medicaid, black children, and children living in lower income zip codes had lower screening rates than privately insured and white children and those living in higher income areas. Nearly 40% of older toddlers of color and those living in lowest income areas had monitoring/concerning results compared with 30% of white children and those in higher income areas. Ongoing quality improvement, health services research, and advocacy offer hope to improve health equity.
Footnotes
Acknowledgements
We gratefully acknowledge Seth Workentine, MD, for leading a literature review of how to improve childhood developmental screening processes.
Author Contributions
Dr Meurer conceptualized and designed the study, performed literature reviews, drafted, reviewed, and revised the manuscript. Dr Rohloff conceptualized the process improvement, designed the study, reviewed, and critically revised the manuscript. Mr Kanter designed the data extraction and reviewed and critically revised the manuscript. Ms Kotagiri contributed to the design, conducted the interviews, summarized those findings, reviewed, and critically revised the manuscript. Ms Rein conducted the data analyses and created the tables and reviewed the manuscript. Dr Gundacker performed literature reviews, analyzed, and interpreted the data, discussed the findings, reviewed, and critically revised the manuscript. Dr Tarima designed the study, interpreted the data analyses, reviewed, and critically revised the manuscript. All authors approved the final manuscript as submitted and agree to be accountable for all aspects of the work.
Declaration of Conflicting Interests
The author(s) declared no potential conflicts of interest with respect to the research, authorship, and/or publication of this article.
Funding
The author(s) disclosed receipt of the following financial support for the research, authorship, and/or publication of this article: Drs Meurer and Tarima, Ms Rein and Kotagiri were funded by the Research and Education Program Fund, a component of the Advancing a Healthier Wisconsin Endowment at the Medical College of Wisconsin (MCW). Dr Rohloff and Mr Kanter were supported by Children’s Wisconsin. Dr Gundacker was supported by the MCW Department of Pediatrics.