
Abstract
Objectives:
The aim of this article is to summarise core quality improvement (QI) methodologies and concepts to assist urology teams in conducting well-designed improvement projects.
Materials and Methods:
We provide an introduction to the methodological foundations of QI, including the model for improvement, plan-do-study-act, lean and six sigma and present some useful QI tools such as process modelling and pareto charts with examples of how they might be applied to urological care. We also introduce the concept of measurement for QI and describe how this differs from the more traditional measurement approaches used in research.
Results:
The key to successful QI work undoubtedly lies in the careful planning and appropriate selection of the available QI tools and methods, alongside pragmatic approaches to measurement that yield enough data to spot meaningful variation in outcomes.
Conclusions:
To support these core methods, QI leadership and stakeholder engagement will be critical to embedding QI into urological care and ensuring that improvements can be sustained once QI projects come to an end.
Level of evidence:
Not applicable.
This is the second instalment in a collection of three articles introducing the practice of quality improvement (QI) in urological care. In the first article, we introduced the concept of QI, its roots in engineering and other industries, its relationship to other improvement approaches such as audit, and the UK institutions supporting QI work more broadly. 1 In this article, we take a deeper dive into core QI approaches, methodologies and tools, focusing on the question of how to make an improvement. We aim to equip readers with an understanding of where to start when embarking on a QI project (QIP), how to get the most out of the project, and how to analyse and present QI data to make informed practice decisions.
QI: methodological foundations
The model for improvement (MFI) and its plan-do-study-act (PDSA) cycles represent the scientific method that underpins the practice of QI in healthcare and form the basis of the methodological approach undertaken for the majority of QIPs.
The MFI is a framework that helps to develop, test and implement changes which are intended to lead to an improvement; put simply, it helps you to plan your QIP from the outset to maximise your chances of success2,3 (Figure 1). The model consists of two components of equal importance:
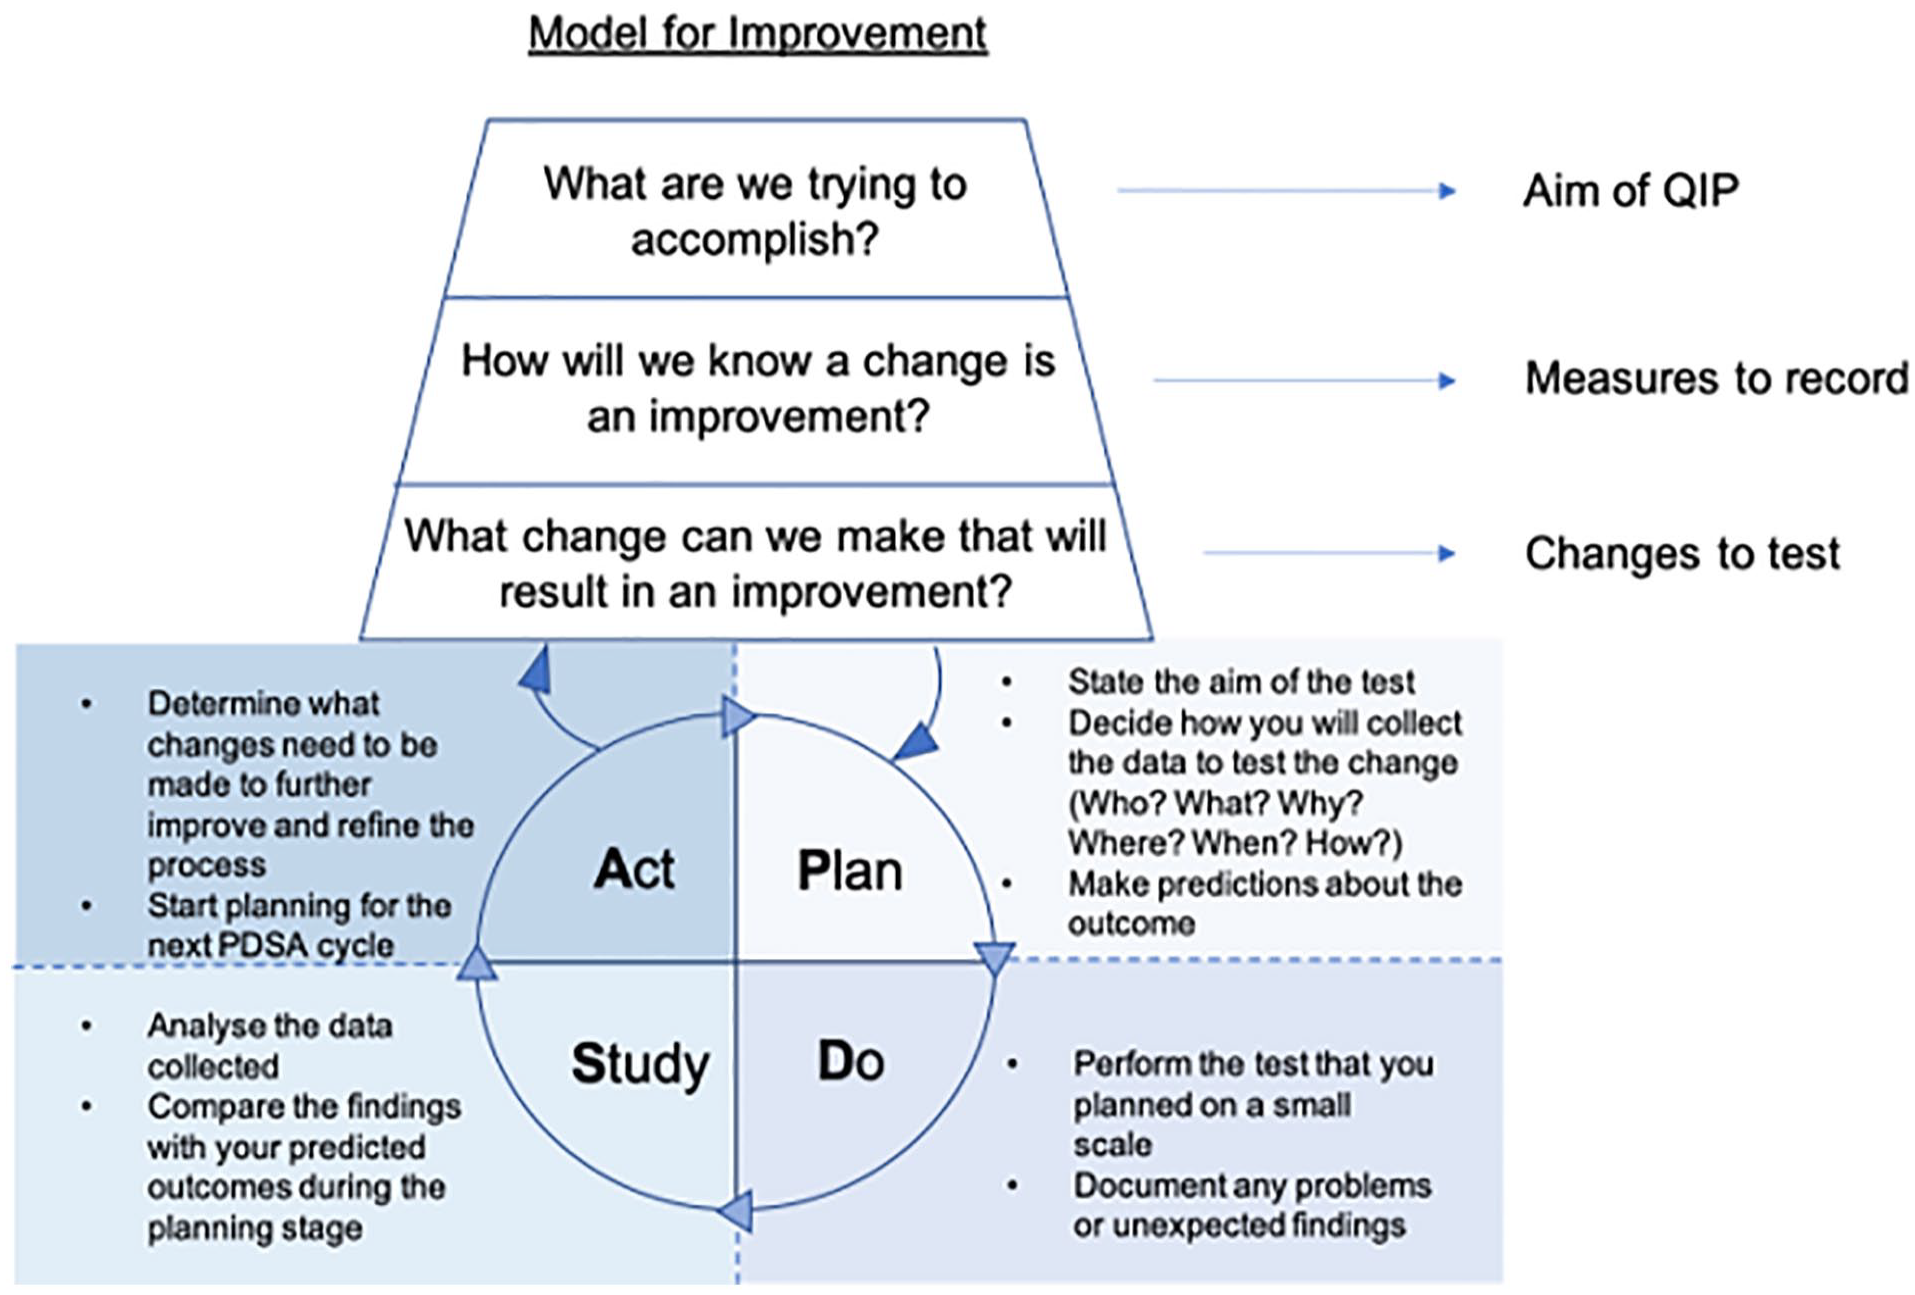
The two components of the model for improvement.
Component 1: three fundamental questions that should be asked at the beginning of every QIP
Q1. What are we trying to accomplish?
Setting an appropriate aim is essential at the start of every QIP; this brings collective focus and allows the desired outcome/s to be effectively monitored. The formulation of a project aim can be guided using the SMART concept. 4 This states that aims should be:
Specific: They should be well-defined and clear to all individuals who have a role in the programme or plan. Aims should include details such as what you want to achieve, where, when and with whom.
Measurable: You should be able to measure progress towards your aim to understand whether you have been successful.
Achievable: Aims should be within reach for your team or programme. Think about a level of improvement that is both significant and achievable.
Relevant: Your aims should be aligned with broader goals of significance and importance to your team or organisation.
Time-bound: Aims should be linked to a deadline that is not so soon as to prevent success, or so far away as to encourage procrastination.
For example, the statement ‘we aim to reduce our rate of post ureteroscopy sepsis’ is not effective as it fails to establish a level of improvement, give a timescale or state the population involved. A more effective statement would be: ‘we aim to reduce the rate of post-operative sepsis by 80% in patients undergoing ureteroscopy within the next six months’. This aim is measurable (rate of sepsis) and answers the questions: ‘How good?’ (80%) ‘By when?’ (6 months) and ‘For whom?’ (patients undergoing ureteroscopy).
Q2. How will we know a change is an improvement?
In complex systems such as the healthcare system every improvement requires change, however not every change leads to an improvement. Without objective data, we cannot reliably determine whether we are improving the system or not. Thus, the next step is to define what specific measurements are needed to determine if a change leads to an improvement. We might need to specify multiple outcome measures, including both quantitative and qualitative measures, to evaluate the system’s performance and to detect an improvement. We should consider what kind of information our measures provide us with, and whether we have a suitable mix of measures to reveal the ‘full story’ regarding why an intervention has or has not been successful (see Table 1 for a summary of different types of measures). We should ensure we gather adequate baseline data (i.e. before any change is implemented) such that an improvement can be demonstrated. And we should think about how frequently data should be collected to pick up meaningful trends that might indicate an improvement; in general, regular and consistent measurements are required. 10 Even when an improvement is not demonstrated, the data we have collected can give useful insights about the system which helps the improvement team to generate new change ideas and identify further opportunities for improvement. What’s more, continuous measurement is crucial to ensuring that improvements are not short lived but are sustained over the long term.11,12
Types of measures for quality improvement.
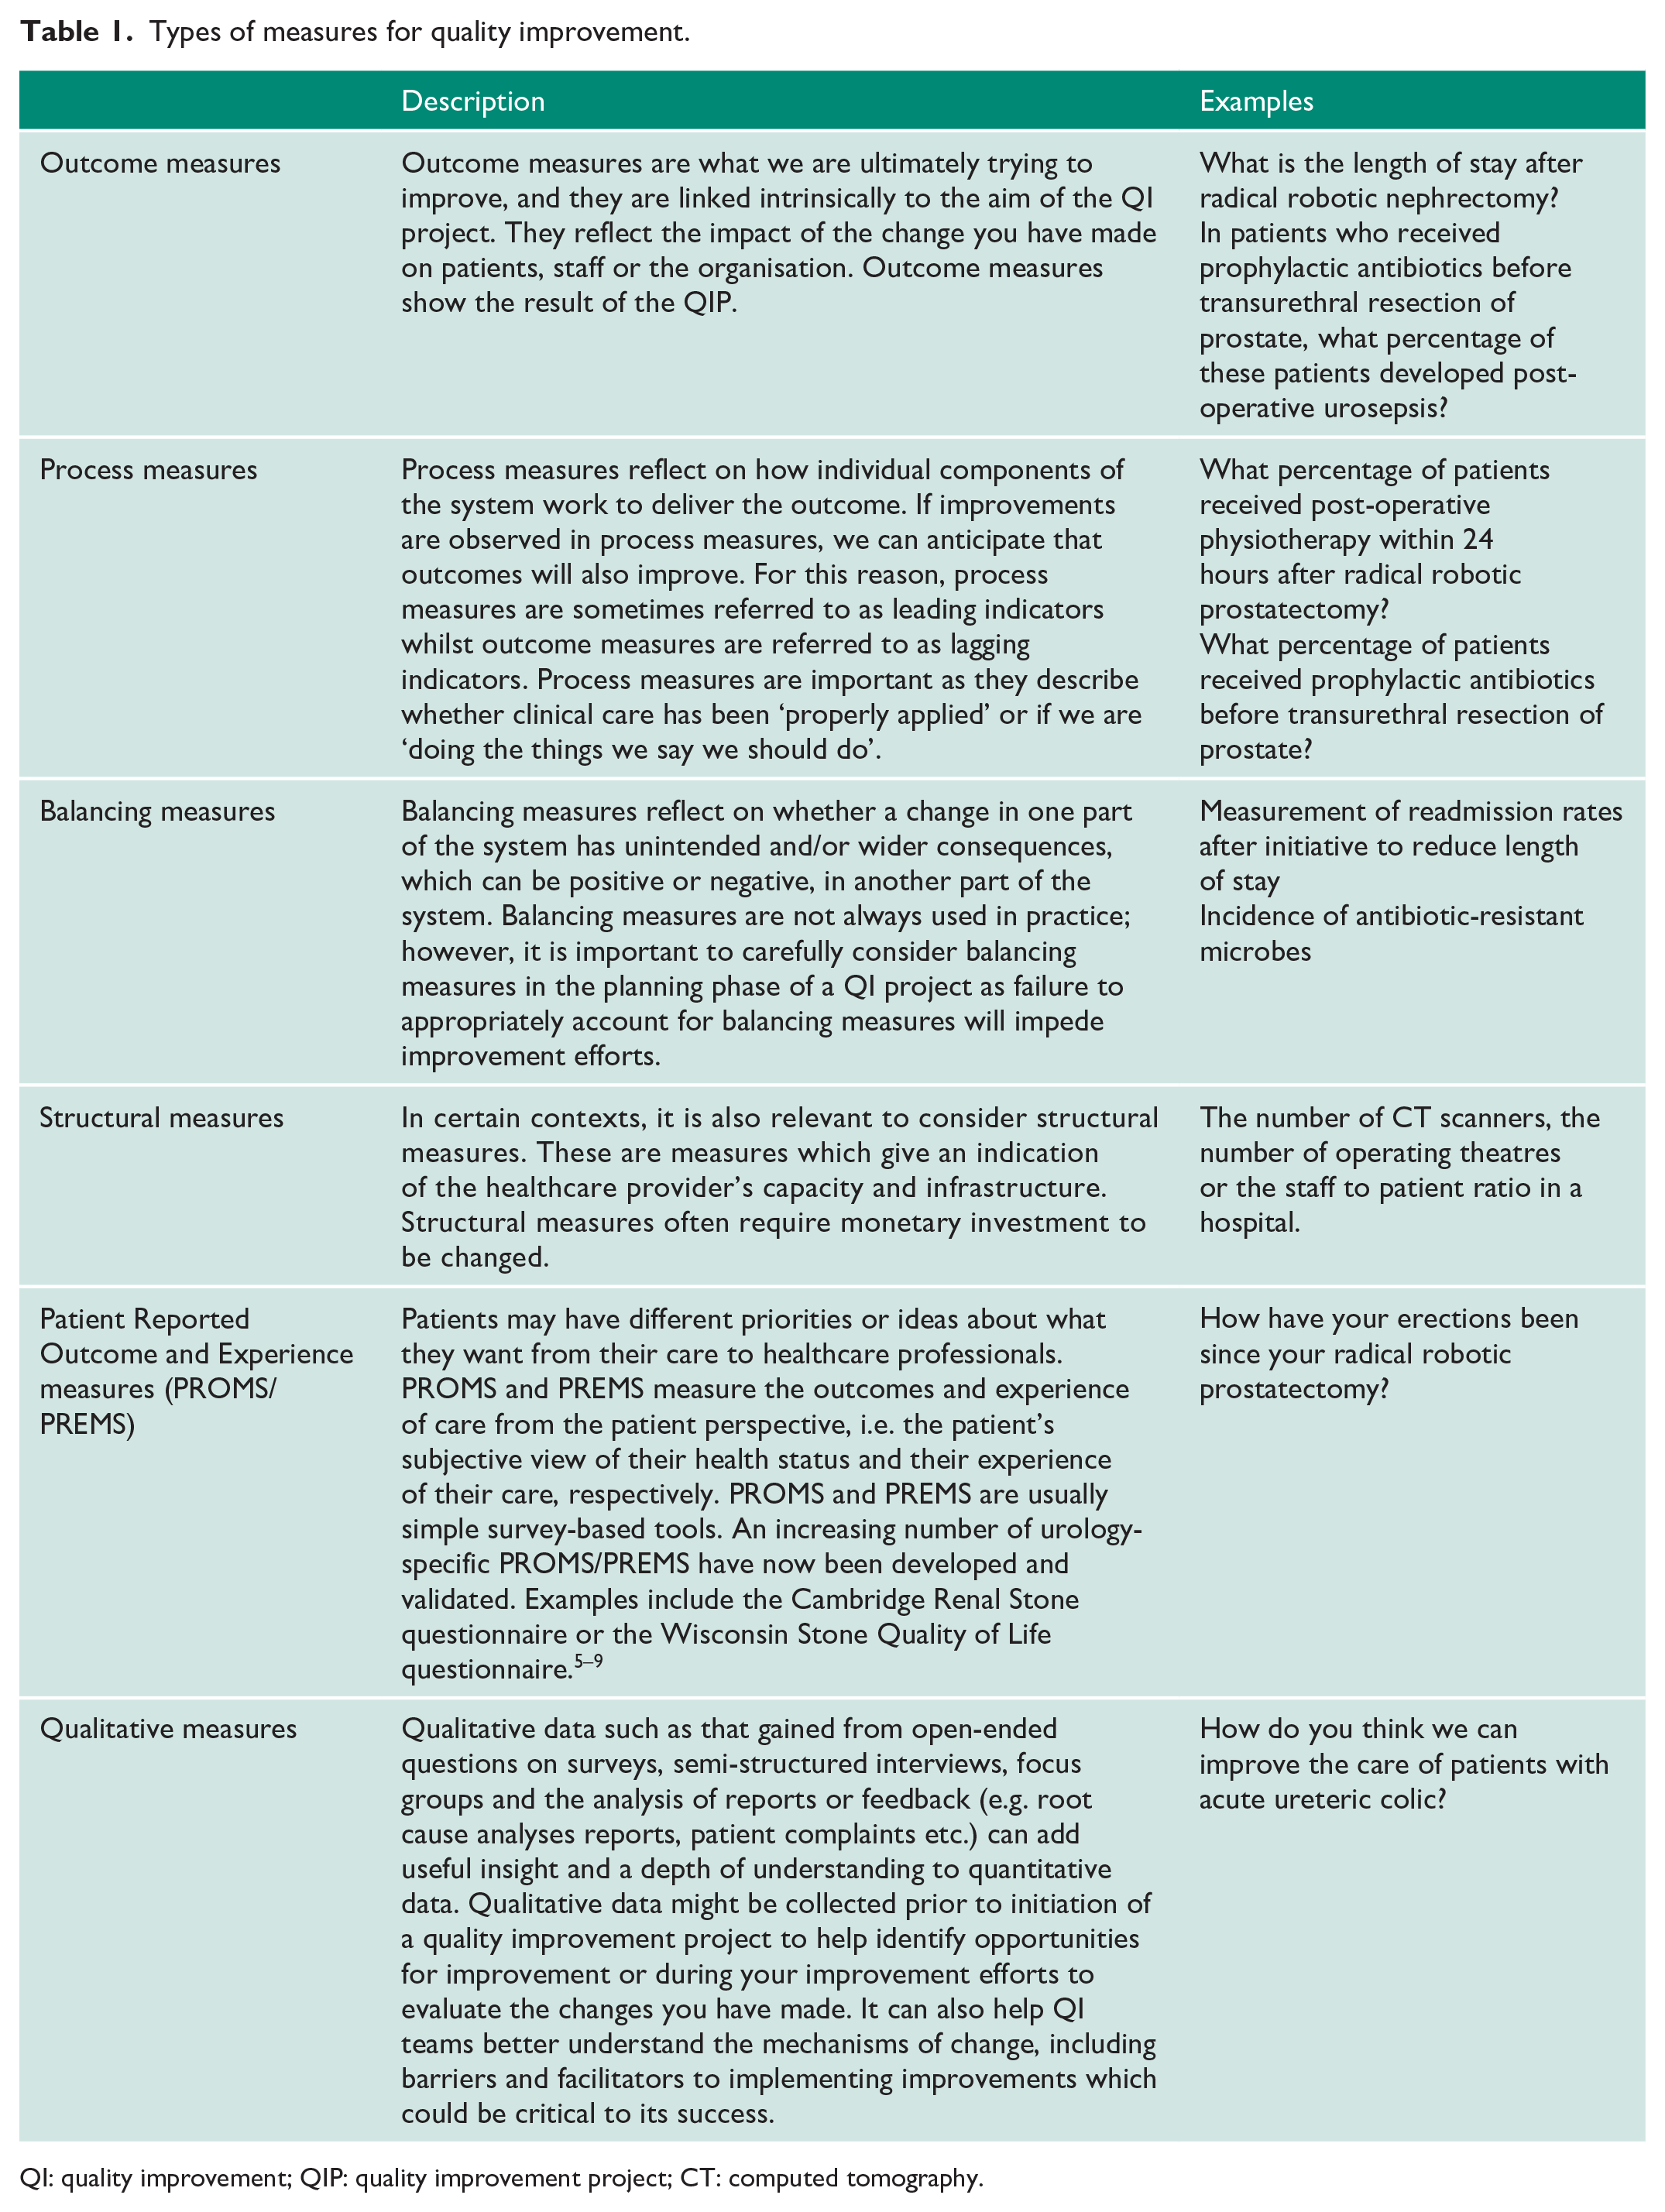
QI: quality improvement; QIP: quality improvement project; CT: computed tomography.
Q3. What change can we make that will result in an improvement?
This final step involves the identification of the changes (or interventions) you will make to help you achieve your aim. It requires creative thinking and discussions with the relevant individuals involved in the care pathway at hand, including healthcare professionals (doctors, nurses, administrators, etc.) and patients. These individuals are referred to as ‘stakeholders’ in QI work. The importance of stakeholder engagement, and patient empowerment in particular, will be discussed in our final article. Ideas may also come from outside of the system from others who have made successful improvements.
As an example of a change, Balai et al. 13 described the implementation of the Emergency Stone Clinic. In collaboration with key stakeholders, a weekly consultant led specialist clinic was implemented to manage patients with ureteric stones. This led to an improvement from 2.9% to 90.5% in patients with conservatively managed ureteric stones being seen within 4 weeks. In those who required definitive treatment, patients receiving their procedure within 4 weeks improved from 26.2% to 51.2%. 13
Component 2: a series of PDSA cycles
The PDSA cycle enables us to quickly test changes on a small scale, evaluate the outcomes and then make iterative adaptations as necessary before testing again, possibly with a larger or broader test group. This repeated testing and learning avoids spending long periods of time planning changes and finding out they are flawed or result in unintended consequences once implemented at scale. By repeating the cycle and making iterative improvements, we move closer to achieving our aim with each step. We conduct PDSA cycles in everyday life such as taking a different route to work or using a different mode of transport. We evaluate whether these changes saved us time, money or improved our comfort. The outcome of these changes determines whether we continue doing them or whether we make further adjustments with an aim for added improvement. 14
Plan
During the first step of the PDSA cycle, we develop a plan to test the change/s we are going to make to achieve our aim. This should include a clearly stated predicted outcome, which can be compared with the results obtained. The success of a PDSA depends on a robust plan; therefore, it is worthwhile investing time during this stage.
Ask the questions:
Who? Who is going to collect and analyse the data?
What? What data do we need to collect?
Why? Why are these data points important?
Where? Where will we get this data?
When? When will the data be collected?
How? How will the data be collected and analysed?
Answering these questions will help plan a successful test and ensure the appropriate information is in place prior to initiating the change (e.g. adequate baseline data).
Do
The second step of the cycle usually involves performing the test on a small scale. A change is made which affects a small cohort of the overall system. The people within the system then collect data. These members observe the performance of this new change and consider new ideas for further improvement. Detecting and documenting problems and unexpected findings enables us to make further modifications down the line if needed.
Study
In this step of the cycle, the data are analysed and compared to the predictions made during the planning stage, to assess whether the change led to an improvement. The data are summarised that is commonly achieved using figures such as run charts which display data over time. The theory about the change can then be updated, for example if it’s working, how it’s working, if it needs adapting. A test that did not achieve the intended outcome is an opportunity for learning and further refinement rather than a sign of failure.
Act
In the final stage of the cycle, we apply what we learnt from the cycle and think about refining the changes for further improvement – is it ready to adopt and test on a larger scale, should we adapt it, or should we abandon it altogether? This initiates the planning phase for the next PDSA cycle. The idea is that the cycles are linked and each test provides us with new information regarding what worked well and what did not. After a few PDSA cycles, we would have established what changes would lead to an improvement of the service and we can implement the change across a whole unit or department. The end goal is to make our change(s) permanent and integrated as part of the standard process.
Additional core QI approaches
Lean
Originally developed for manufacturing in The Toyota Production System, Lean has now been widely adapted and applied to healthcare settings with the aim of identifying the least wasteful ways to provide better quality, safer healthcare to patients, with no delays.15–17 The Lean philosophy is about streamlining the patient journey to improve flow, increase productivity and eliminate waste – it’s centred around being able to do more with the available resources. Lean uses tools to break down processes and analyse their constituent parts to detect inefficiencies in the delivery of care – identifying and eliminating steps in the process that don’t add value for the customer. The customer, or end-user, is anyone who uses something produced in a previous step of the process, so this could be the patient, a team, or a particular member of staff. Waste is anything other than the minimum amount of equipment, space, staff time, etc which are essential to add value to the product or service. The following types of waste have been identified in healthcare settings:
Correction: repeating things due to faulty processes or incorrect information.
Waiting: inability to progress with work due to waiting for information, people or equipment.
Transportation: moving materials unnecessarily
Over-processing: performing unnecessary processing steps that don’t add value
Inventory: too much work or stock at one time (e.g. excess stock in store cupboards), or people/information waiting in a queue.
Motion: unnecessary motion or searching, or things not being easily accessible.
Overproduction: producing more than is needed or earlier than is needed.
Five principles of lean can be applied to any process to reduce waste:
Define value – identify the end-user and establish what they value – what it is, when they need it and how. This may challenge the way things are currently done.
Map the value stream – this is the core set of actions required to deliver value to the customer/end-user, including identification of the steps that add value and improve quality (and therefore elimination of steps that lead to waste).
Create flow to the end-user – you then align your value adding steps into processes to facilitate smooth flow of information and care delivery.
Establish pull – the goal is to create a service where the end-user pulls products or services as needed, that is the service responds to demand with the resources needed for it, rather than providing services or products, in an uncoordinated way and for which there may be no immediate need.
Seek continuous improvement – develop and amend processes continually in pursuit of the ideal.
Lean should not be seen as a quick fix to cost-cut, but rather a long-term philosophy that has relevance at multiple levels of the health system, right through from fine-tuning front-line processes to informing policy-making. As processes become ‘leaner’ productive resources can be allocated to new value creating work. At the frontline level, the use of Lean may be particularly beneficial for improvement work centred around patient journeys and pathways which may be longer than necessary. 5 The Royal College of Pathology has supported its use in pathology departments nationally to improve efficiency.
Six sigma
Six sigma is a data-driven problem-solving methodology developed by Motorola in the 1980s. The term six sigma originates from statistical modelling, where sigma is a measure of variability. To achieve six sigma, a process must operate within 3 standard deviations (or sigma) above or below the mean in a normal distribution. In other words, when a process operates at the six sigma level it does not produce more than 3.4 defects per million opportunities (in engineering or manufacturing terms) – it is 99.99996% defect free. The Six Sigma approach to improvement is accordingly focused on fostering continuous efforts to reduce variation, detect and eliminate defects and improve reliability, accuracy and quality, with customer satisfaction as the driving goal. It utilises the DMAIC framework which works on the basis that all processes can be Defined, Measured, Analysed, Improved and Controlled.18,19 This framework can be used to structure QIPs as follows:
Define
In this step, state the problem, identify the patient group involved and their requirements, and state the project goals.
Measure
Gather data to understand the current situation in more detail and to provide a baseline for improvement efforts.
Analyse
Identify discrepancies between current practice and what you are trying to achieve, that is, identify defects. Determine the root causes of these discrepancies and identify opportunities for improvement. This will allow you to identify what kinds of errors occur and which are the priority to address (see Pareto chart).
Improve
Determine possible solutions to address the root causes and identify those that will be easiest to implement with the most potential for improvement. Decide on and implement a suggested change and use data to evaluate the results.
Control
Standardise processes and apply a monitoring regime to ensure changes are kept in place and the improvement is sustained – continual evaluation is crucial.
Lean six sigma
An emerging trend in healthcare improvement is to marry the principles of the Lean and Six Sigma approaches, recognising the strengths and weaknesses of each method. The resulting ‘Lean Six Sigma’ hybrid approach combines the Lean focus on reducing waste with the Six Sigma focus on reducing variation, often achieved by introducing Lean first to increase efficiency followed by Six Sigma methods for fine-tuning. The combination of these two methods helps to develop streamlined processes with high-quality results.20,21
QI tools
Supporting these over-arching approaches to QI are a host of QI tools that can be selected according to the goals of your specific QIP. The list of QI tools is ever growing and we have summarised those which might be of use in the Urology context in Table 2. To demonstrate the application of these tools, we’ve selected two of them – process mapping and pareto charts – and provided Urology-based examples below. (For an exhaustive list of QI tools see NHS England. 29 )
Key QI tools.
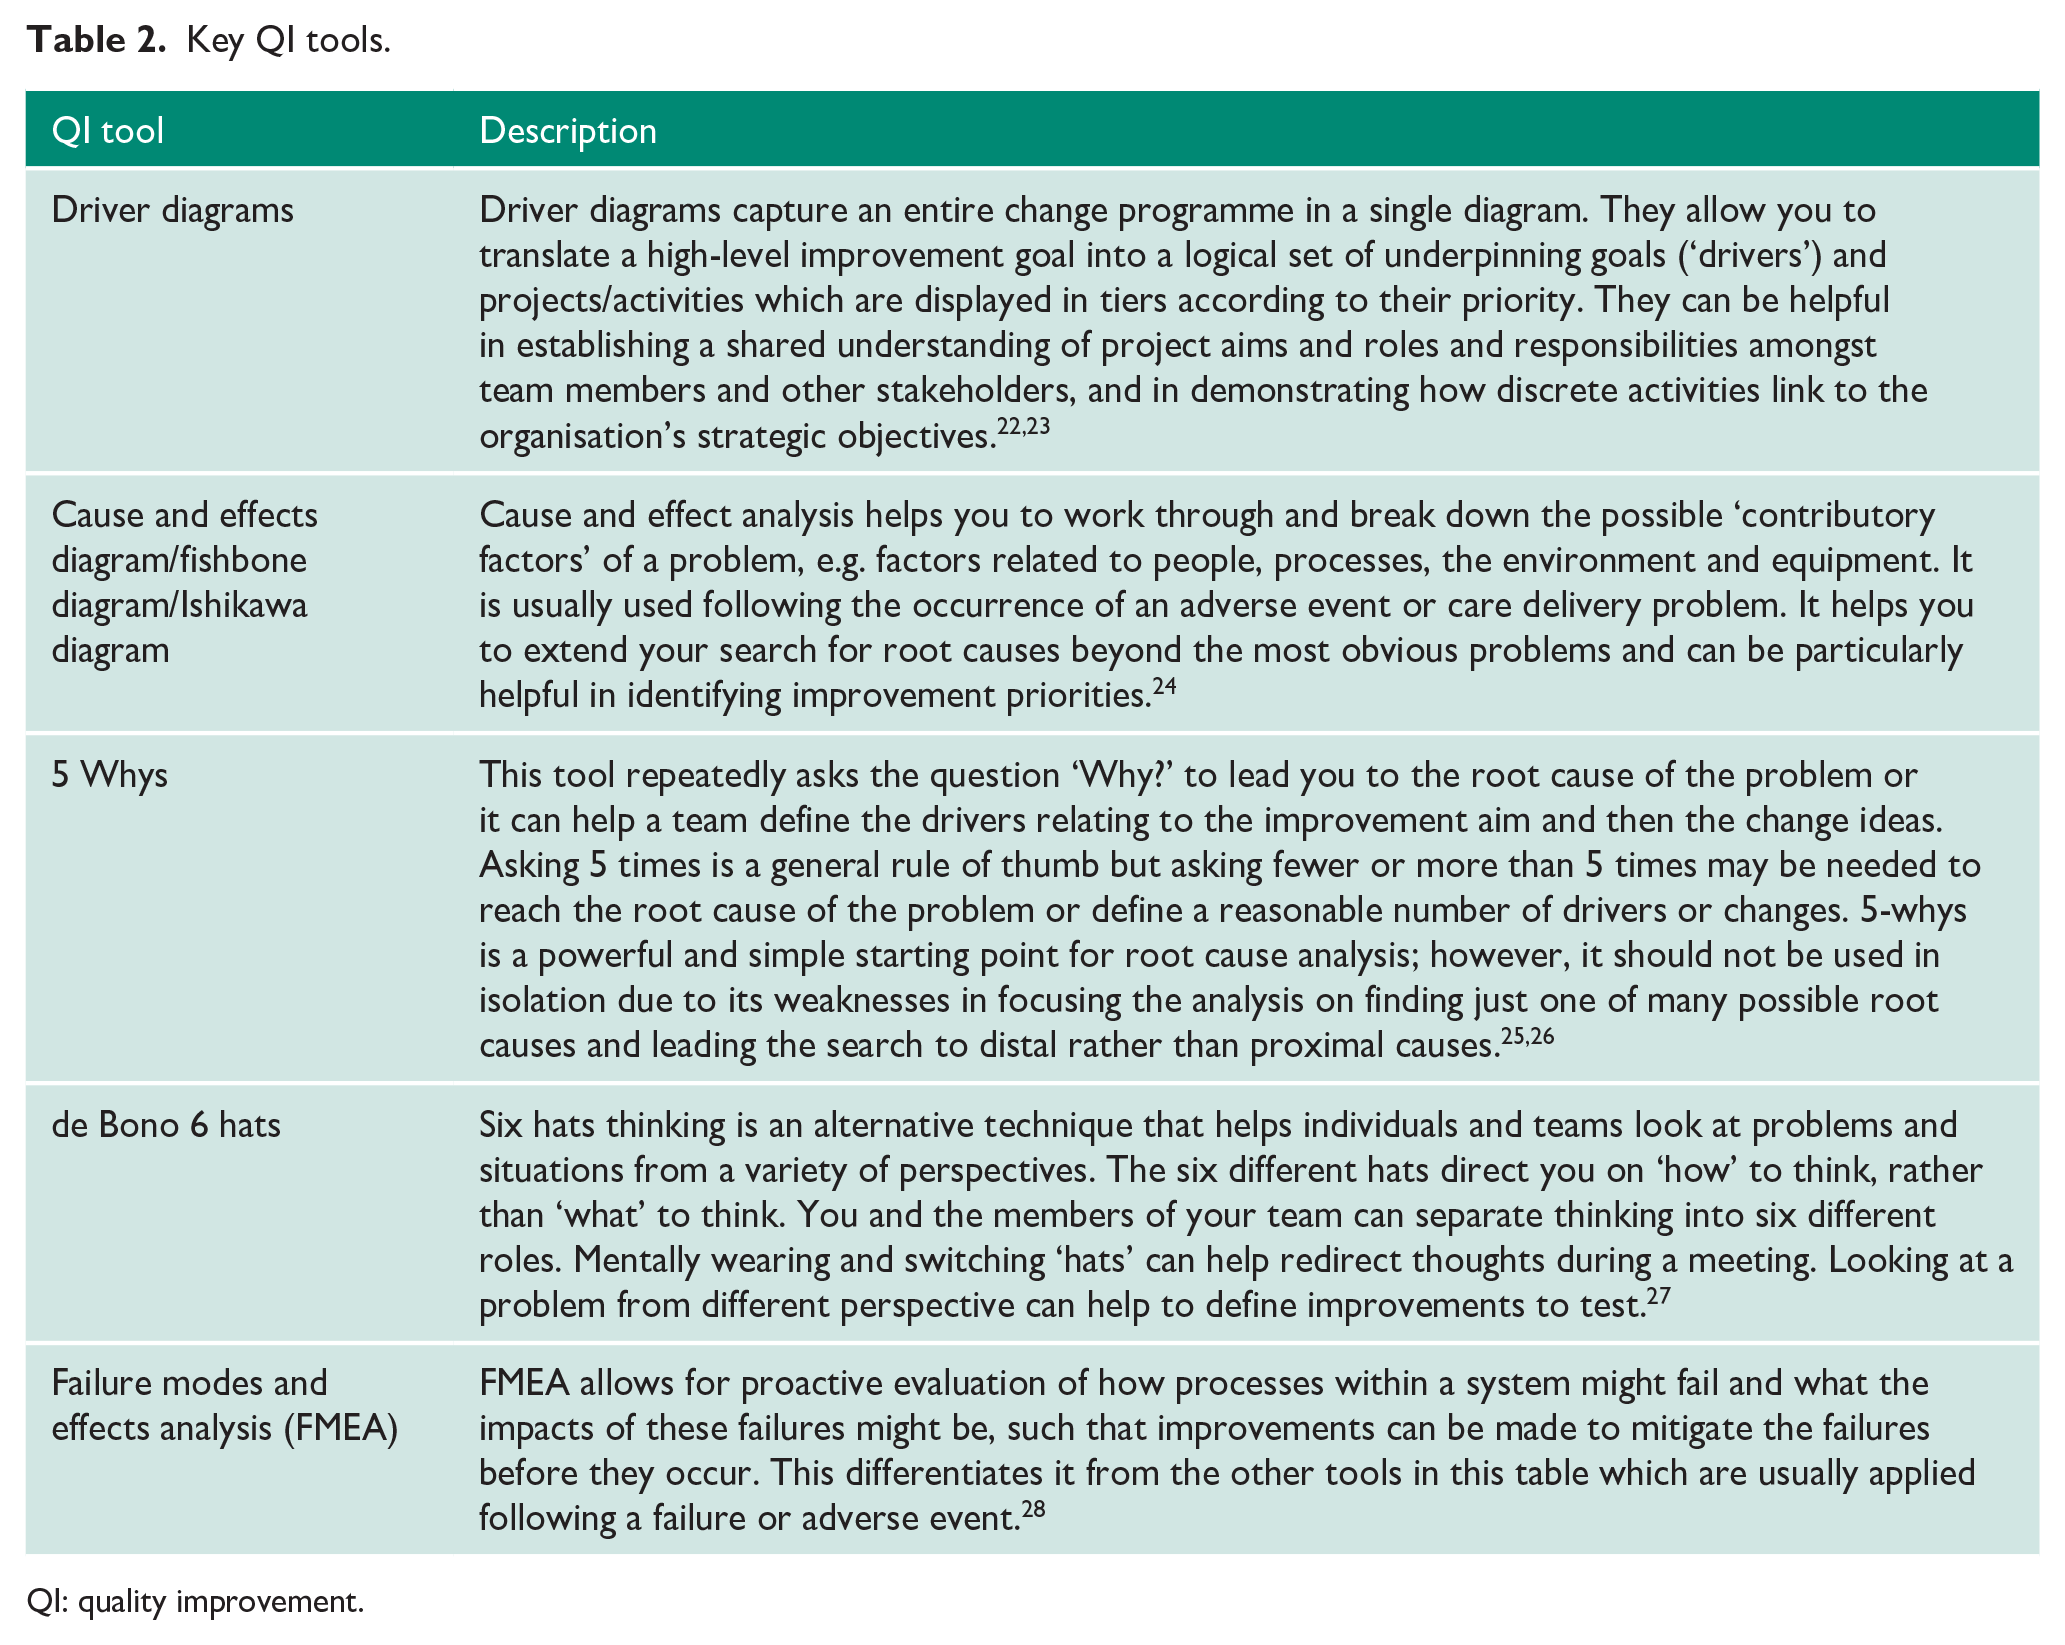
QI: quality improvement.
Process mapping
Process mapping is a tool that’s commonly used to assist in the analysis and breakdown of care pathways and processes and is often used as part of approaches such as Lean to identify wasteful steps that can be removed from the system. It is often used to map a patient’s journey to help understand the reality of care and identify areas where quality can be improved. It may highlight unnecessary steps or duplication and stimulate ideas for improvement. To be most effective, process mapping should involve staff associated with the clinical process and patients for user insight. If done correctly and effectively, improving and integrating processes one by one will gradually lead to an improvement of the whole system.30–32
When embarking on process mapping it is important to think about what you want to map and determine your start and end point. It is possible to map the patient’s whole journey from entering the Emergency Department (ED) to discharge, but it will be very time-consuming and mostly irrelevant to your clinical setting.
The process map of an example patient journey is depicted in Figure 2. The patient presents to ED with renal colic but does not require emergency intervention. Steps where patients were dissatisfied with their care were highlighted as possible areas for improvement. In the example, instead of requesting a follow-up scan at the first outpatient urology appointment, it can be requested at the time of consultation with the Urology Specialist. This scan can then be reviewed at the first outpatient appointment and a decision can be made regarding whether the patient can be discharged or requires definitive treatment. This cuts out the need for second outpatient appointments and reduces the time of the patient journey.
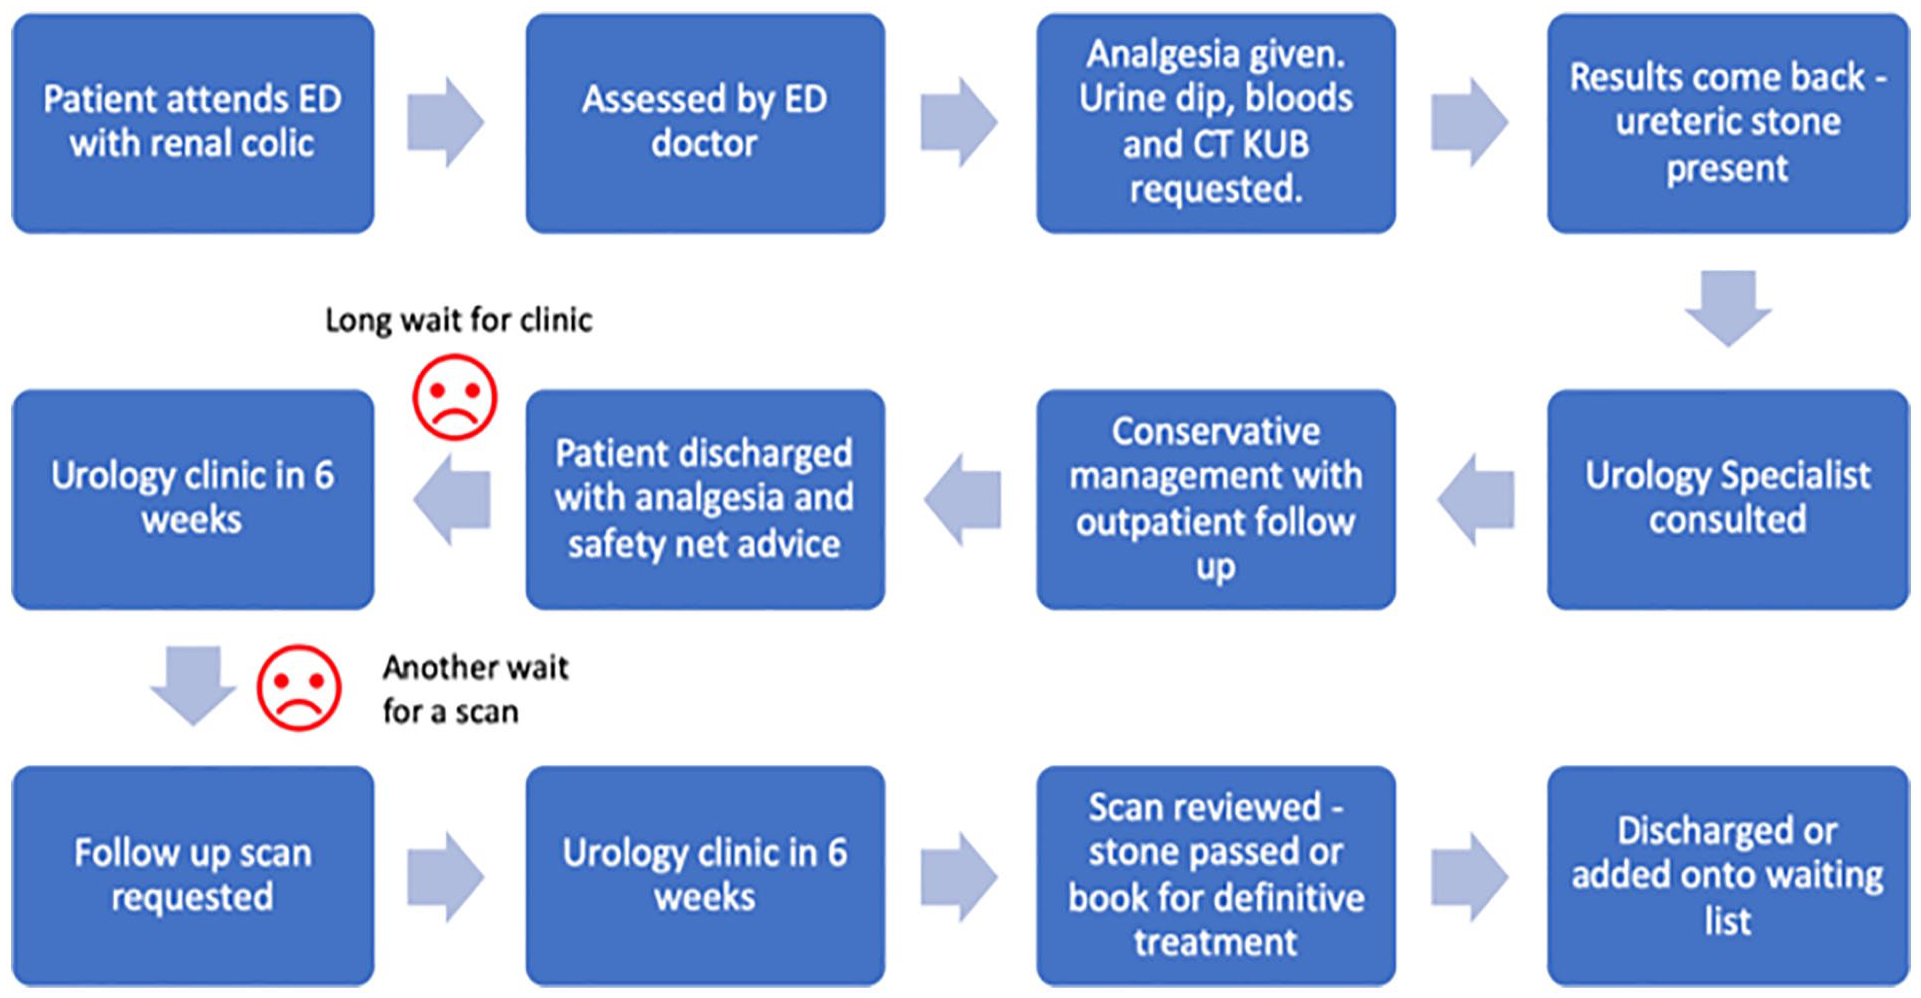
Example process map in urology context.
Pareto charts
Joseph Juran developed the Pareto principle, or 80/20 rule, in the context of quality control after he observed that for many outcomes; approximately 80% of consequences come from 20% of causes. It was named after an Italian economist Vilfredo Pareto who observed that 80% of the land in Italy was owned by 20% of the population.
Juran then adapted this principle of identifying the few important causes of an event from the less significant ones, as most organisational effects resulted from a few causes. This then led to the Pareto chart which is a bar chart where causative factors leading to defects in a process are placed in descending order of frequency on the x axis. The y axis shows the frequency of factors. The chart enables the team to assess which causes result in the largest proportion of problems. It helps the team to prioritise on improving factors that will make the most significant impact on the system. 33
The example in Figure 3 was constructed using data from a study by O’Dwyer et al., 34 looking into same day cancellations of elective urological operations. 34 It shows that the first three causes contribute to about 90% of same day urology day case cancellations. Therefore, the team can focus their efforts on these reasons to make the biggest impact in reducing same day cancellations with their service improvement work.
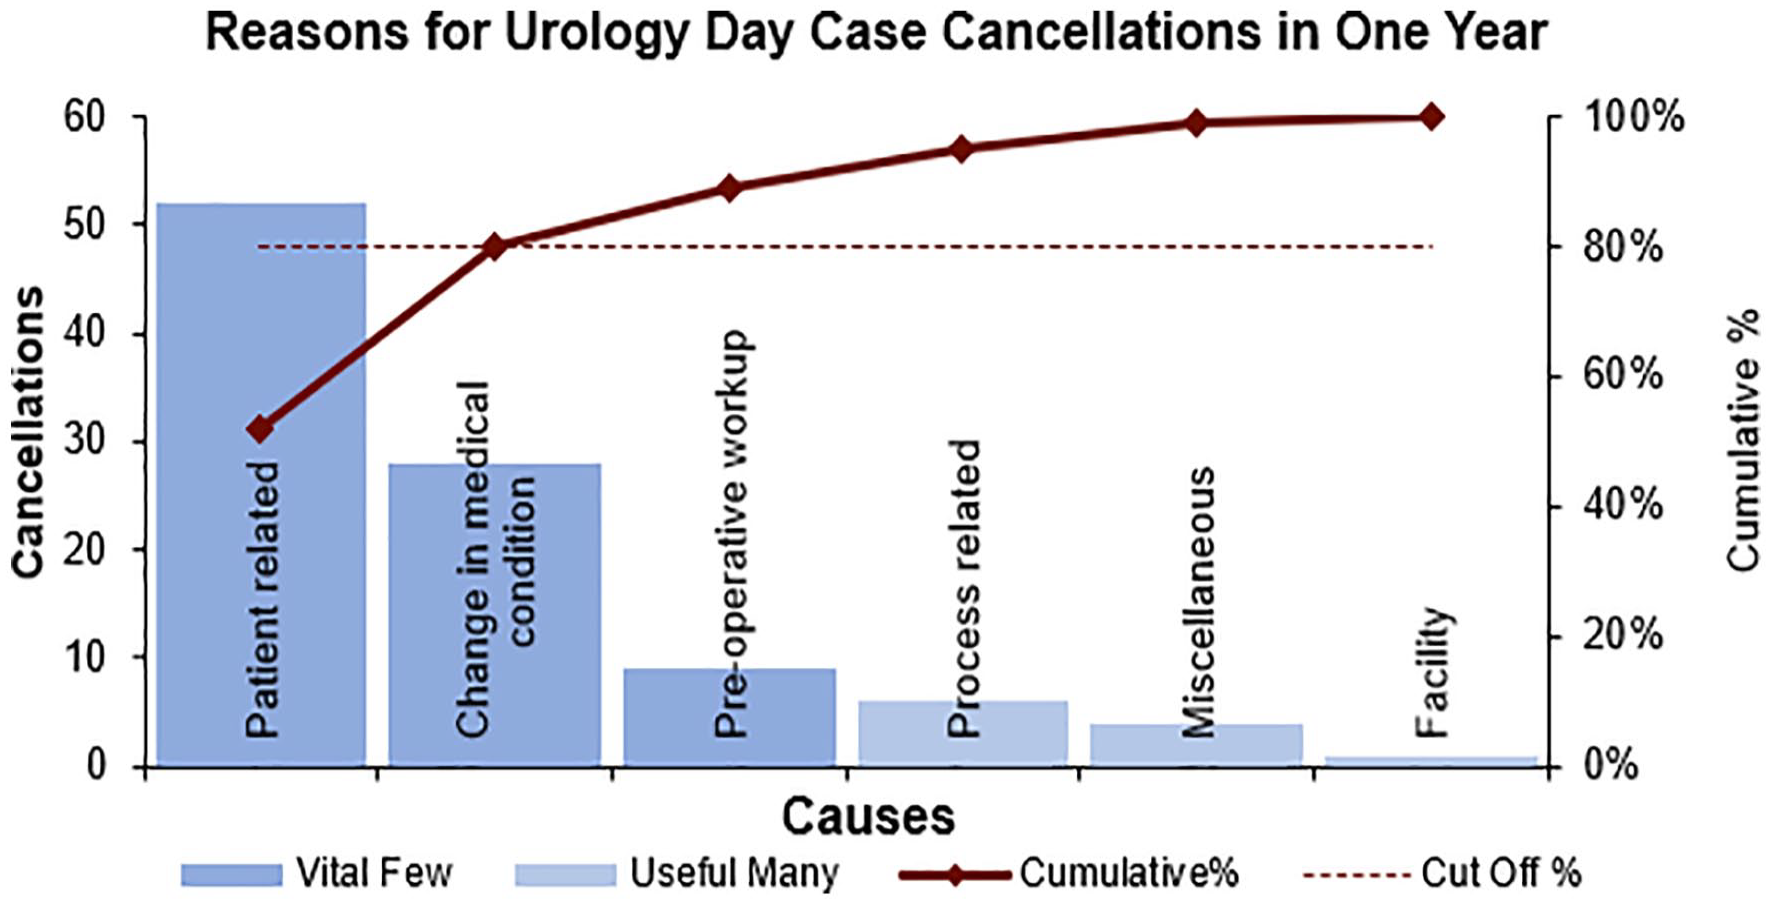
Example Pareto chart in urology context.
Principles of measurement for QI
As we have seen, measurement is a crucial component of QI. It is important to appreciate that measurement for QI is significantly different from measurement for clinical research in its aims and methodology (Table 3). Traditionally clinicians and researchers in health sciences have been trained to collect and analyse data in carefully controlled experimental conditions or in large-scale clinical trials, with the aim of discovering new knowledge through the application of the scientific method. In contrast, the aim of QI is not to make novel discoveries, but to improve quality, safety and value by bringing new knowledge and insights into daily practice. QI methodology, therefore, emphasises rapid testing of hypotheses in the field, and early application of new knowledge. 14 QI teams do not aim to measure every variable but aim to gather ‘just enough’ data to gain necessary insight about the performance of the system. Measurement in QI also differs from measurement for clinical audit. In clinical audit, local practice is compared against nationally agreed standards or guidelines and data are collected specifically for the purpose of comparison to these standards or guidelines for the purposes of quality assurance. Measurements for clinical audit are taken over a defined period and give a snapshot of local practices at that time. The same measurements are then repeated later to complete the audit loop. Clinical audit data are static and are usually presented in the form of bar charts or pie charts. Static data demonstrate performance at a fixed time point and therefore does not give sufficient detail about how specific changes impact performance. In contrast, data for QI are measured on a continuous basis and presented as dynamic data in the form of run charts or control charts which display the metric of interest on the y-axis and importantly, the progression of time on the x-axis (often referred to as time-series data). Annotations are added to the run chart to indicate when changes have been made to the system and improvement teams can easily visualise how the changes affect the measurement of interest (Figure 4). 35
Measurement for QI versus measurement for research.
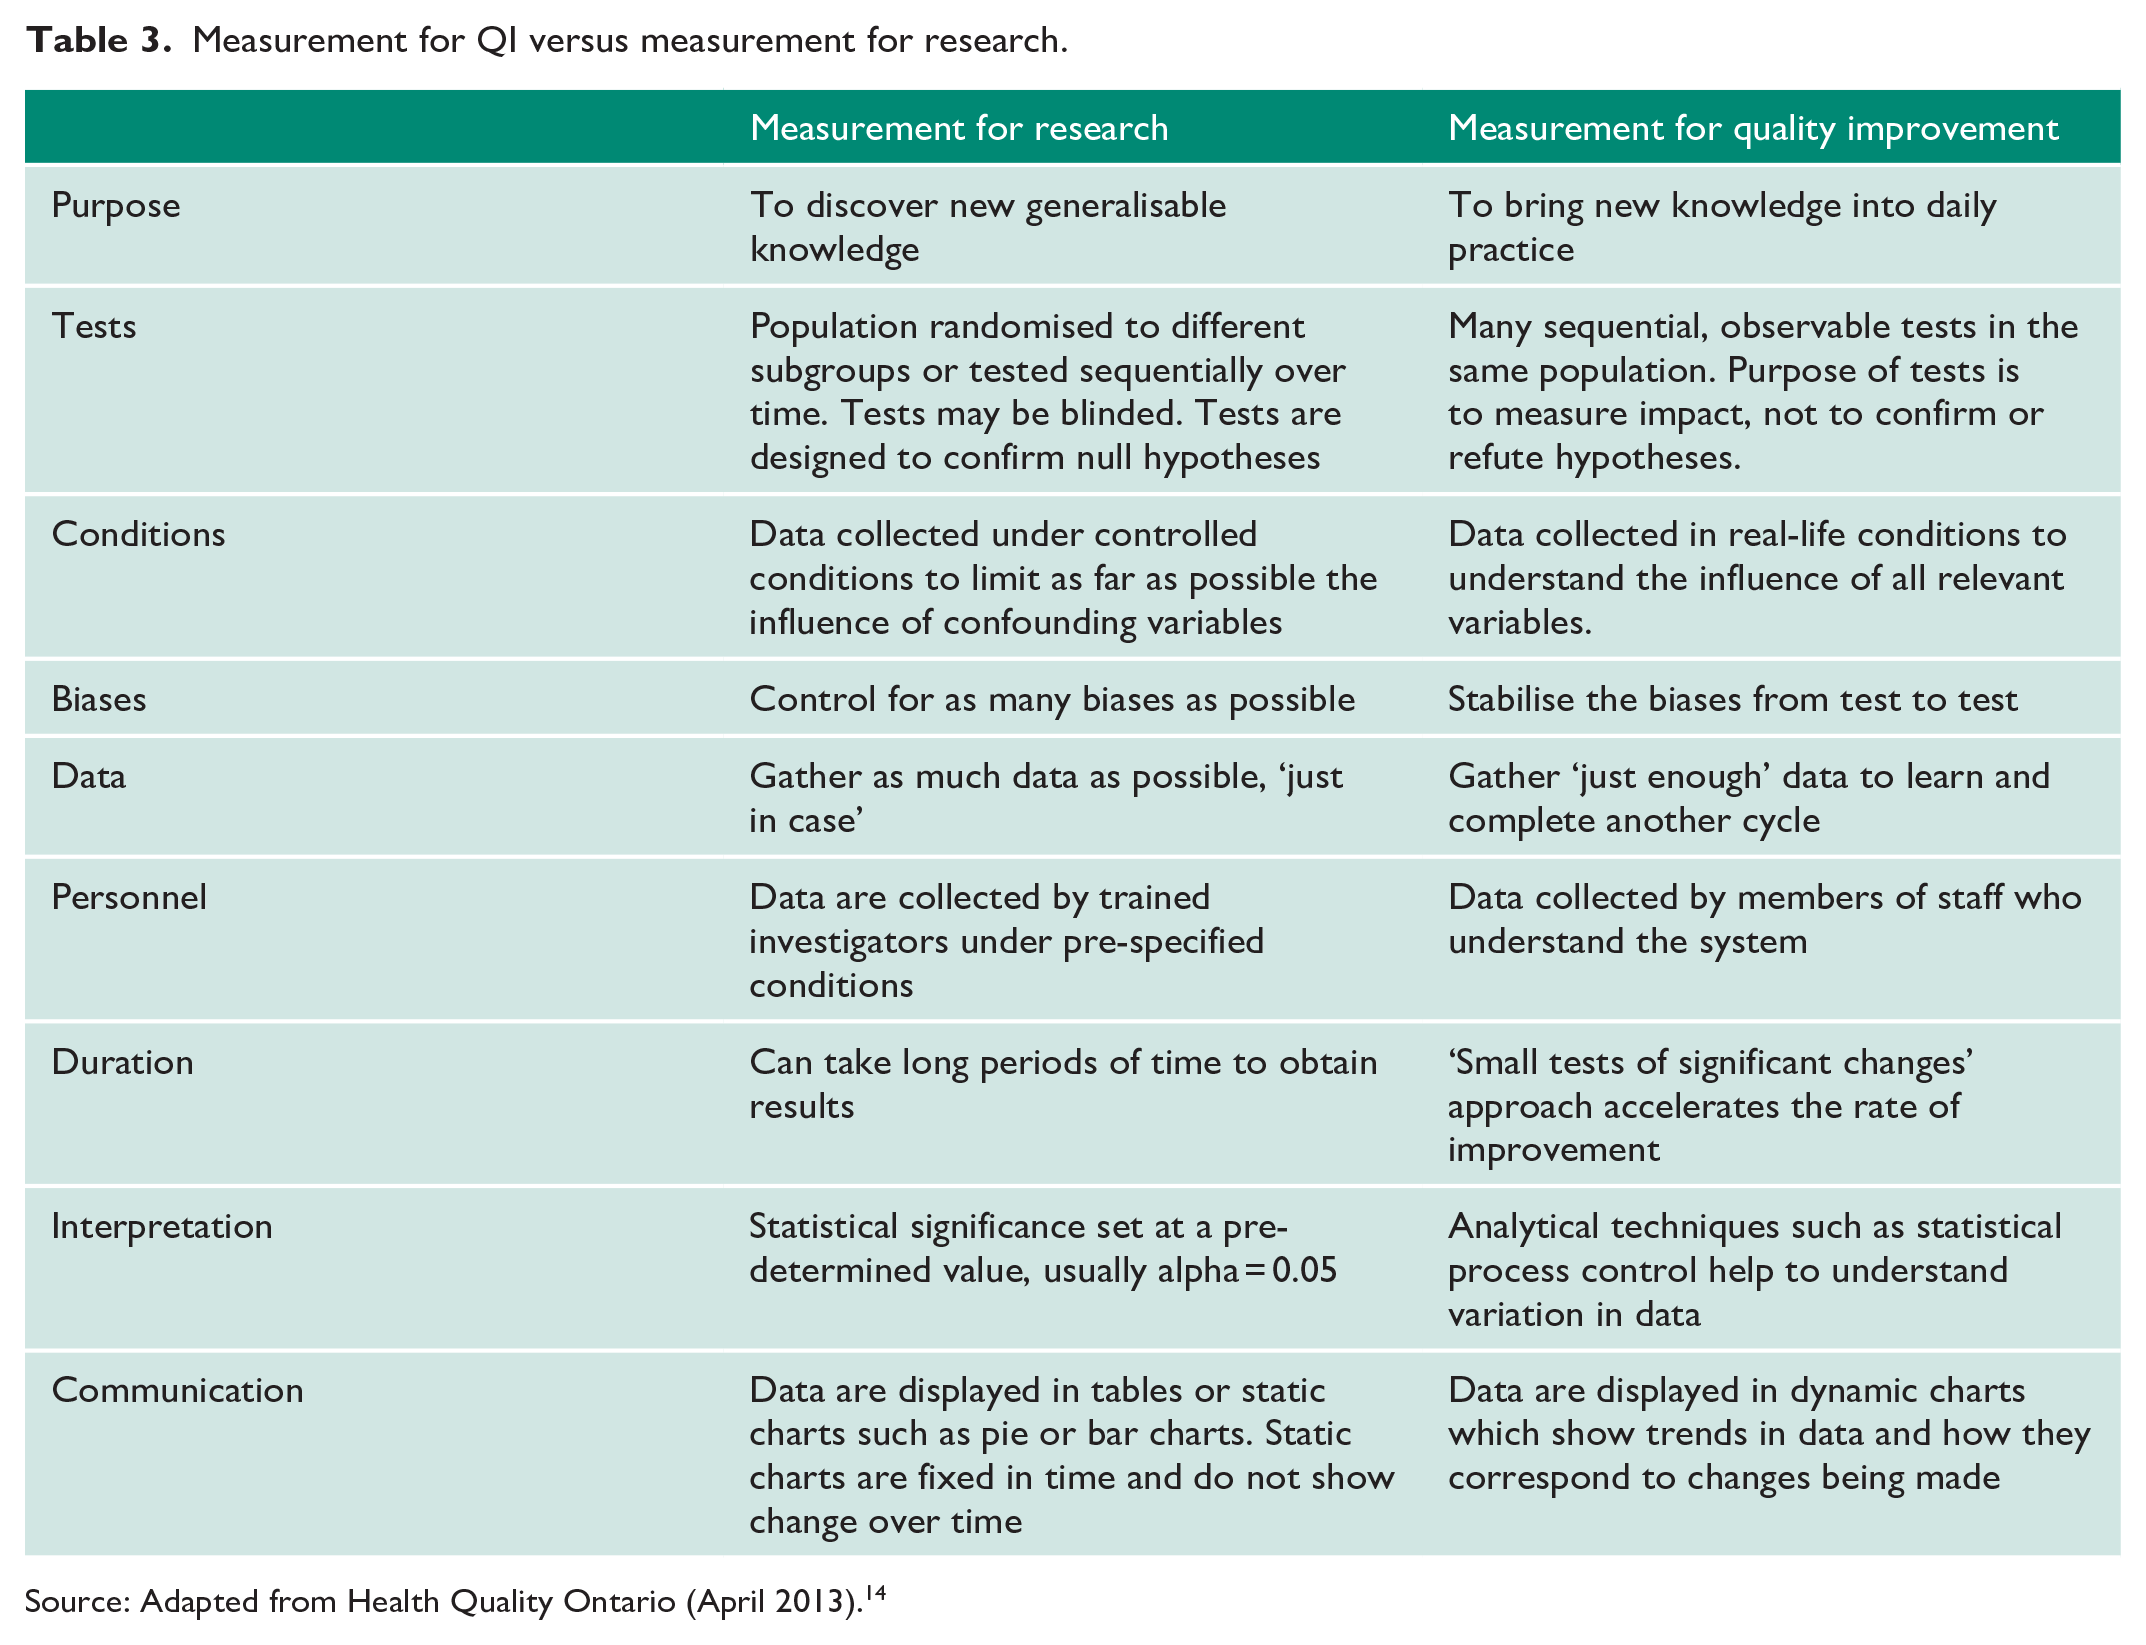
Source: Adapted from Health Quality Ontario (April 2013). 14
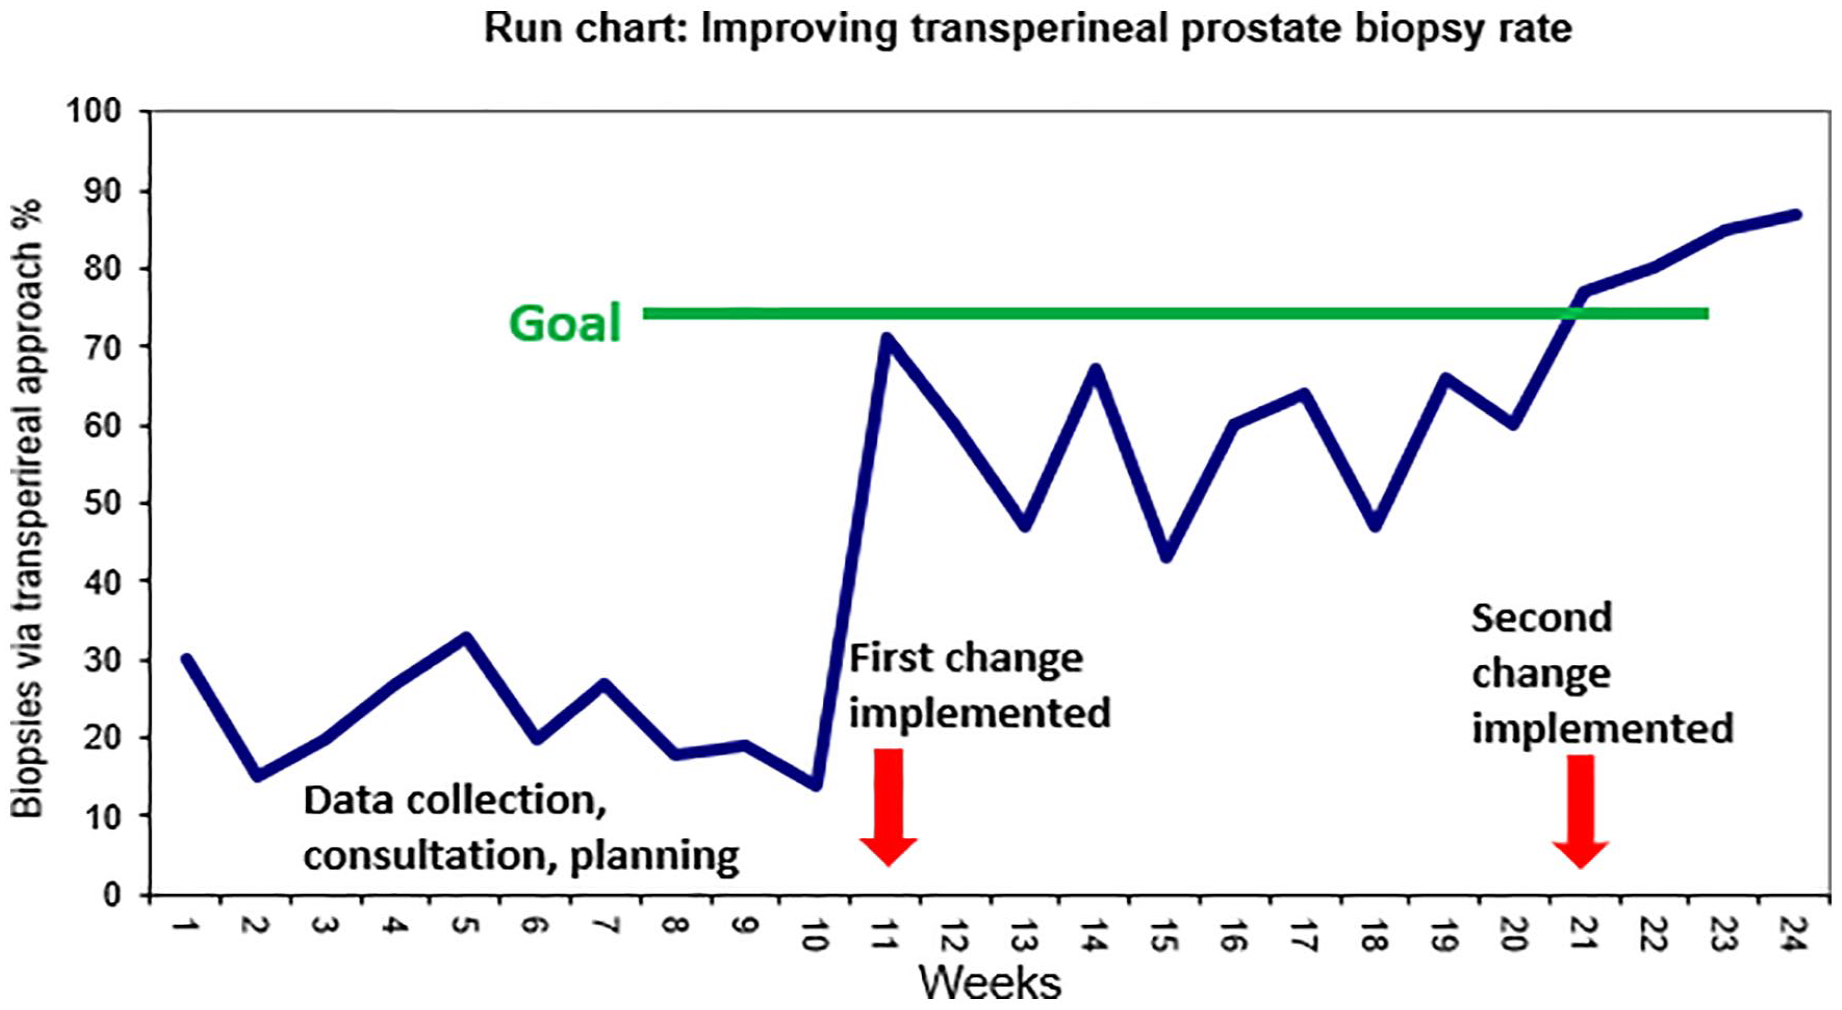
Example of a run chart demonstrating percentage of prostate biopsies performed via transperineal approach.
Presenting and interpreting dynamic data
Run charts
When constructing run charts, a minimum of five data points are needed for baseline data, and five data points after a change have been introduced. Increasing the number of data points increases our ability to detect a change in the performance of the system.
Interpreting run charts
One of the advantages of run charts is that they are a powerful tool for communicating improvement simply by visual inspection. However, if we rely on visual inspection alone, our biases will cause us to infer an improvement when no improvement has in fact occurred. There are four simple rules that can be applied to the run chart to determine if a signal for change is indeed present (Figure 5). The first step is to calculate and display the median as a horizontal line on the run chart (the median is used rather than the mean because it is not affected by extreme data points and it the point at which half of the data points are expected to be above and below, which allows us to apply the rules). The initial median line is ideally calculated from baseline data. Once baseline data have been plotted and the change is introduced, a visual inspection is completed to see if any of the four rules apply. If not, the baseline median should be ‘frozen’ and extended into the future on the x-axis. The tests of change can be applied once more with new data against the baseline median. If one of the four rules does apply following a change, a new discrete median line can be plotted. This indicates that data are non-random and a change to the system has occurred. This change to the system could be as a result of deliberate action in the context of a PDSA cycle or could be due to an external factor (which can sometimes cause an astronomical point). Process knowledge is required to interpret the run chart. 36
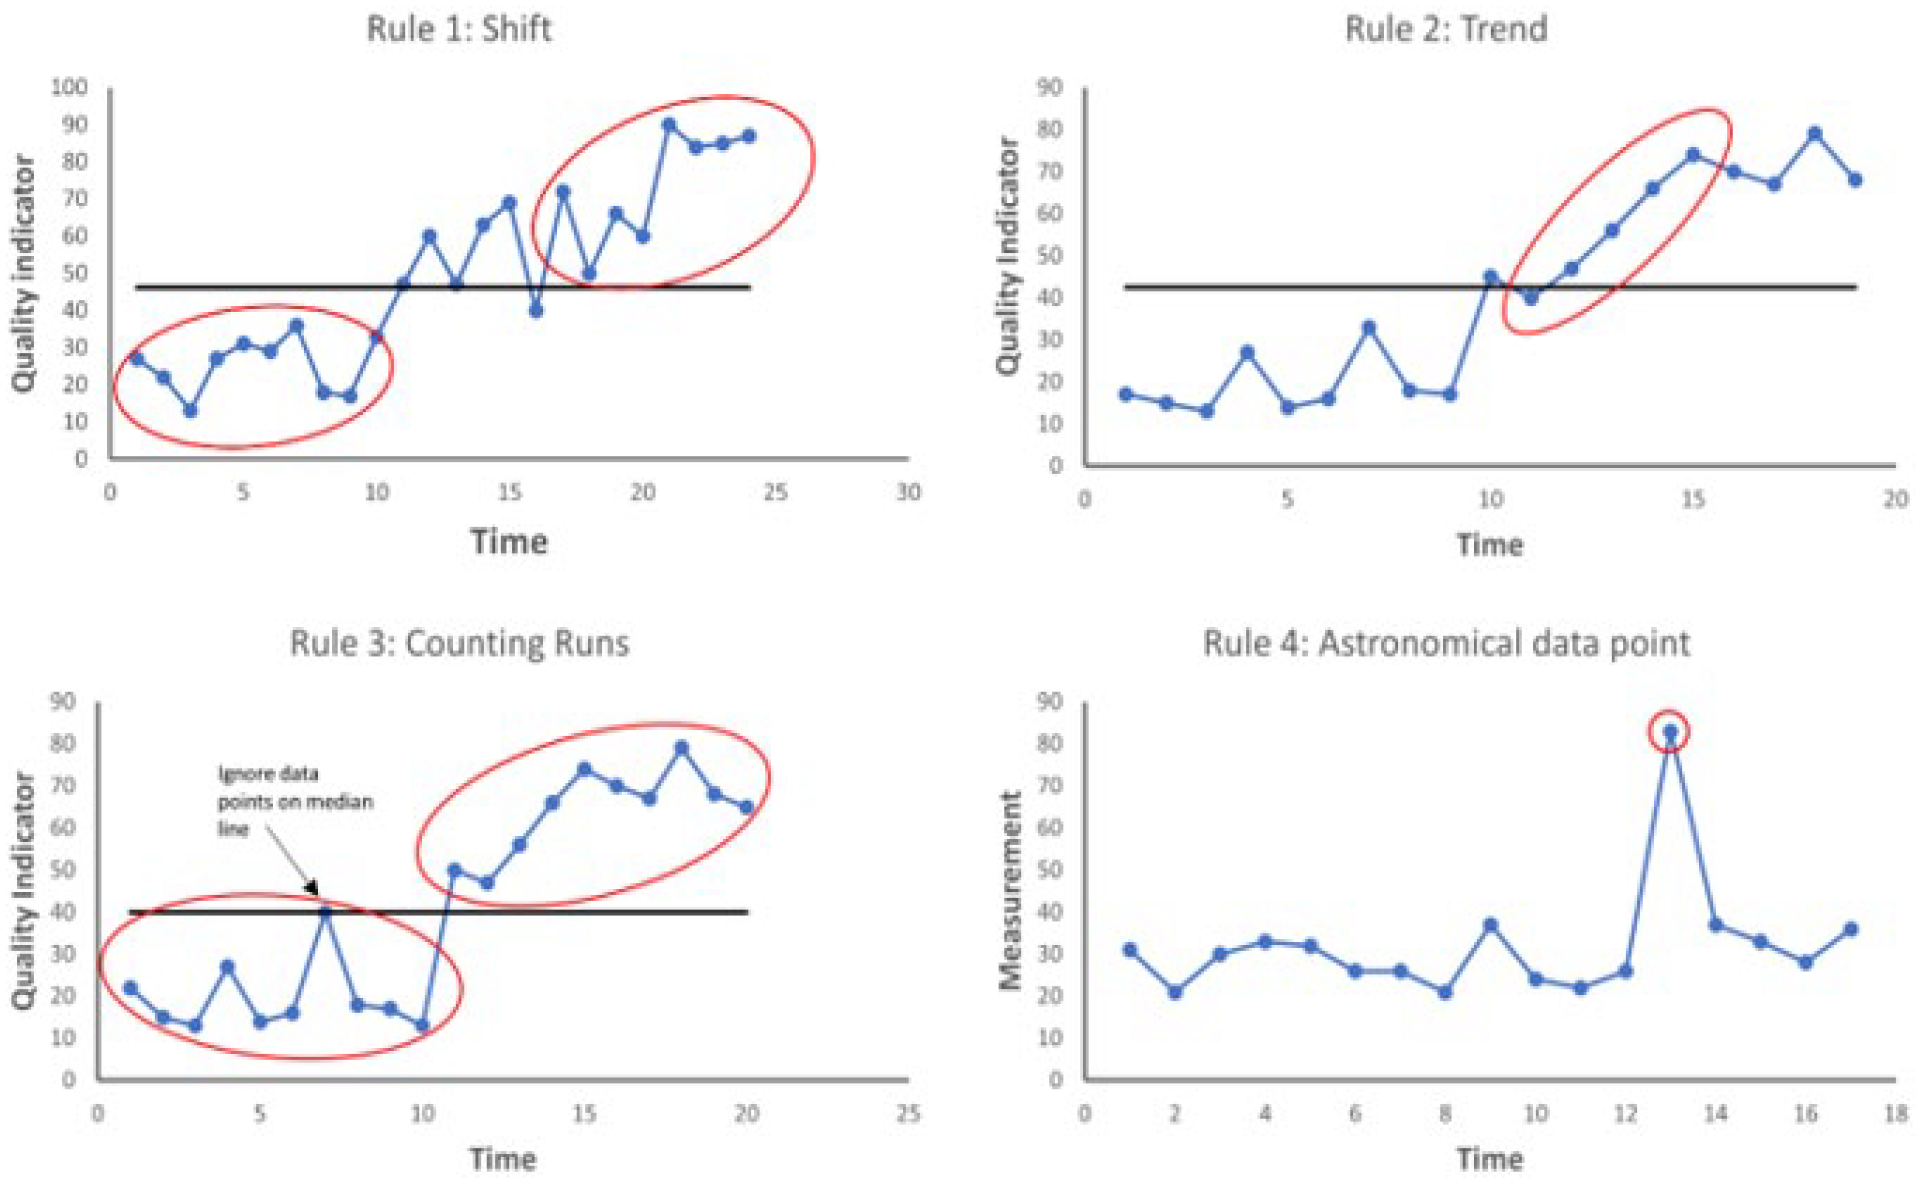
Rules to identify non-random change on a run chart. Rule 1 – A shift: 6 or more consecutive data points above or below the median. Rule 2 – A trend: 5 or more consecutive points increasing or decreasing (independent of the median line). Rule 3 – Too many or too few runs: A run is consecutive points on the same side of the median line – a reference sheet is used to determine whether the total number of runs is within the range that might be expected by chance. Too many or too few runs suggest the system has changed in a meaningful way. Rule 4 – Astronomical data points: these stand out on visual inspection and can indicate process changes or other important causal factors.
Statistical process control charts
Statistical process control (SPC) charts were first used in the manufacturing industry with the aim of improving efficiency and predictability and ultimately performance of the system by identifying and removing unwanted variation. SPC charts are also known as Shewhart charts in honour of their creator, Walter A Shewhart. SPC charts are similar to run charts but with some important differences. The main reason for using an SPC chart is to understand what is the ‘norm’ – that is, the range of outcomes the process would deliver if the process is stable – and what is outside the norm.
As alluded to previously, one of the problems with measurement is that natural variation exists in all processes. For instance, serial measurement of a person’s blood pressure or heart rate will reveal minute to minute variation even if there has been no external stimulus for change. Similarly, there is also inherent variation in the complex system of healthcare delivery, for instance, turnaround time for investigations and waiting list times will naturally fluctuate around an average. In order to better understand the performance of a system, improvement teams will want to know whether variation observed in data is due to common causes or special causes. Common causes are those which are inherent to the system and occur as a result of natural variation. A system which has only common cause variation is said to be stable or ‘in control’ because the performance of the system is predictable. Special cause variation is unexpected variation that results from unusual occurrences. A system which has special cause variation is unstable or ‘out of control’ because the system is unpredictable or going through a process of change (or improvement). SPC charts are able to detect the occurrence of both common-cause and special-cause variation. 37
When constructing an SPC chart, time is displayed on the x-axis and the measurement of interest in on the y-axis. A minimum of 20 data points is needed and the centre line represents the mean (in contrast to run charts where the centre line is the median). Statistical software can automatically calculate the upper and lower control limits based on input data, which are also displayed on the chart as lines (Figure 6). It is important to note that these upper and lower control limits, which are also called sigma limits, are calculated differently to standard deviations used in research. Data fluctuating within these limits is a result of normal or ‘common cause’ variation. Data points which fall outside these control limits indicate special cause variation. A run of 7 or more points above or below the centre line (a shift), or a run of 7 or more points consecutively ascending or descending (a drift) indicates special cause variation. There are two further rules for identifying special cause variation which are beyond the scope of this article. Special cause variation is usually automatically identified when specialist software or SPC tool such as that offered by National Health Service (NHS) improvement is used to construct the chart. We can also use SPC charts to determine if a change is improving a process and use them to ‘predict’ statistically whether a process is ‘capable’ of meeting a target.
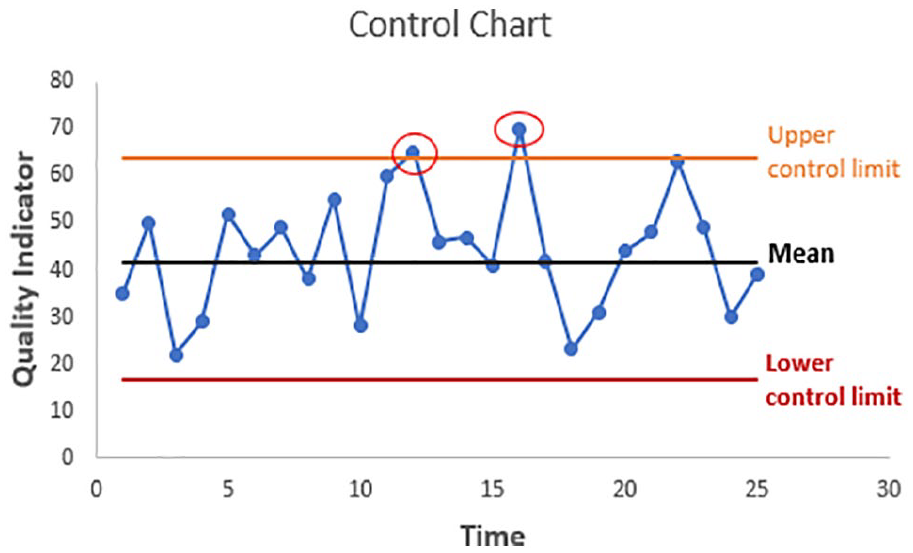
SPC chart: red circles indicate points which lie beyond calculated control limits.
In a system or process which is stable, improvement teams can make changes to the system or process to try to improve performance. In a system with special cause variation, the factor causing special cause variation should be identified and removed to bring system under control if the variation is detrimental to the system. If, on the other hand, the factor causing special cause variation improves the performance of the system, the factor should be examined to see if it can be incorporated into the system’s processes. By using these charts, we can then understand where the focus of work needs to be concentrated in order to make a difference.38–40
Conclusion
We have summarised the core principles of QI methods and measurement and have used urology-based examples to demonstrate these principles where possible. The key to successful QI work undoubtedly lies in the planning and appropriate selection of the available QI tools and methods. This process will be different to planning research or participating in audits, with a focus on seeking usefulness, not perfection and collecting the right data at the right time to demonstrate meaningful trends in measures over time and to distinguish between expected baseline variation and variation indicating an improvement or otherwise to a system. It is critical to appreciate, however, that even the most perfectly planned and executed QI project will fail to result in sustainable improvement if the right team with the right mix of stakeholders to drive the project is not been identified and included in the project from inception, with project goals aligned to strategic organisational priorities. In our final article of this series, we discuss the foundations of QI management with a focus on how to embed QI in the daily practice of Urology departments.
Footnotes
Authors’ note
Stephanie Russ is now affiliated with King’s College London, UK.
Conflicting interests
The author(s) declared no potential conflicts of interest with respect to the research, authorship, and/or publication of this article.
Funding
The author(s) disclosed receipt of the following financial support for the research, authorship, and/or publication of this article: This article series and the EQUIP research programme are funded by The Urology Foundation. The Urology Foundation gratefully acknowledges further funding from the Schroder Foundation.
Ethical approval
Not applicable.
Informed consent
Not applicable.
Guarantor
J.G.
Contributorship
A.O. and T.T. drafted the manuscript which was then reviewed and amended by the remaining authors. All authors are members of the EQUIP steering group which spearheaded the work leading to this special series of articles.