
Abstract
Objective:
To demonstrate a method of evaluating accuracy of developmental screening modeled on the evidence-based medical literature.
Method:
A retrospective review was performed on 418 children screened with the Denver II by a trained technician. Two models for analyzing screening data were examined, using predictive values and likelihood ratios (LR+ and LR−).
Results:
The technician, working at 20% time, screened 44% of eligible children. There were 129/418 (31%) children with Suspect Denver II results, 115/418 who were referred, 81/115 (70%) who were evaluated by Early Intervention, and 64/81 (79%) who qualified for services. The uncorrected positive predictive value for the Denver II alone (44%) was insufficient to meet the preset standard of 60%, but the LR+ of 4.16 indicated a significant contribution of test information to improving predictive value. Combining test results with information from the parent–technician conference to achieve a referral decision resulted in an uncorrected predictive value of 56%, which rose with correction for children referred but not evaluated to 72% (LR+ 10.33). Negative predictive values and likelihood ratios of a negative test and a non-referral decision achieved recommended levels. Parents who expressed concern were significantly more likely to complete recommended evaluation than those who did not (82% vs 58%, p < .01). Results were in the same range as in published studies with other screening tests but showed three areas for improvement: screening more children, more carefully supervising some referral decisions, and getting more children to evaluation.
Conclusion:
Levels of predictive accuracy above 60% can be obtained by combining different types of information about development to make decisions about referral for more complete evaluation. Systematic study of such combinations could lead to improved predictive accuracy of screening programs and support attempts to close the gap between referral and evaluation.
Keywords
For at least 20 years, the medical literature has emphasized the use of predictive values (PVs) and likelihood ratios (LRs) in evaluating accuracy of diagnostic and screening tests in clinical practice. 1 This approach has been largely ignored in the developmental screening literature, where accuracy of developmental screening has traditionally been addressed as a question of test “validity” assessed by calculating sensitivity and specificity. While that information may be helpful in selecting a screening procedure, it is not very helpful in answering questions about how well a clinical program is working. In clinical practice, the question is “How well is this screening program working in this clinical setting, with this population, with this test, these referral and follow-up procedures, and these definitions of eligibility?” Specific characteristics of the setting will vary from one program to another: For example, a successful program where the prevalence is high and the standards for eligibility are liberal may not work in a community where prevalence is low and eligibility is more restricted. What is needed is a methodology that can be applied in and adapted to various different settings.
Altman has summarized the position adopted in the evidence-based medical literature to answer these questions. He states,
We need to know the probability that the test will give us the correct diagnosis. Sensitivity and specificity do not give us this information. Instead, we must approach the data from the direction of the test results, using predictive values.
2
Those tell us the probability that either a positive or negative screening test will lead to a diagnosis. The clinician must decide what are acceptable standards for those values and then determine whether his actual results meet those standards.
Camp 3 has described a model for evaluating developmental screening based on this alternative approach. Three terms are used extensively in this model: prevalence, PV, and LR. Understanding the meaning of “prevalence” is essential. It is often assumed to mean the percentage of delayed children in the general population rather than recognizing that it is also applied to the sample under study. The latter is important in evaluating a specific program because it represents the role that chance or the pretest probability plays in arriving at the PV in a specific sample. Positive predictive value (PPV) represents the percentage of children in the sample with positive screening results who have the disorder in question and is the same as post-test probability. The traditional meaning of negative predictive value (NPV) is the percentage with negative screening results who do not have the disorder; more useful in our context is the percentage of children who do have the disorder (1 − NPV), which we will refer to as PV of a negative. LR represents the ability of a screening test to increase PV.
The first step in Camp’s model is to set standards for what will be acceptable levels for PVs—the thresholds above and below which no further information will be sought before making a decision. In developmental screening, she suggests setting the threshold for the PPV at 60% or better, even though Aylward, 4 for example, would accept 50%. LRs (LR+ and LR−) use the information represented by sensitivity and specificity to describe the ability of a screening procedure to improve the post-test probability over the pretest probability. Camp suggests a LR for a positive test (LR+) of 2.0 or higher. For the threshold below which no further information needs to be obtained before making a decision, that is, the PV of a negative (1 − NPV), she suggests accepting the practice common in medicine of using 10% or less. She also asks that the LR of a negative (LR−) be below .50 to indicate that negative test information improves the PV of a negative over chance. She asks this because the prevalence is below 10% in many studies of developmental screening. If the observed values do not meet these standards, further evaluation steps include correction for verification bias and adding additional information. Those steps help the clinician decide what needs to be done to improve the PV to the desired level.
Because Camp’s model includes examining the data for evidence of under-referral as well as over-referral, and not all children get evaluated, some method for estimating errors of under-referral needed to be developed. This latter is particularly important because it is seldom addressed in reports of developmental screening. Although the question of missing delays is often belabored, it is usually assumed that the question can be answered simply by accepting large numbers of over-referrals.
In interpreting a screening test, it is important to consider other information along with the test result. Previous writers have recommended this. Frankenburg et al. 5 wrote that “the Denver II is a screening test, the results of which should be integrated with everything else that one knows about the child.” Lipkin and Gwynn 6 “recommend the incorporation of parent-completed questionnaires or directly administered screening tests into the process of surveillance and screening. However, their results should be combined with attention to parental concerns and the pediatrician’s opinion, rather than replacing them.”
In previous studies, clinicians chose not to refer some children with abnormal test results7,8 and did refer some children with normal test results.8,9 These clinical judgments presumably considered more than the test result. One study compared the results of a screening test and clinicians’ ratings as separate procedures, 9 but there has been little study of ways in which a clinician combines test data with clinical data to make a decision.
An important problem in other studies has been children who are referred but not evaluated (RNE). In a community-based program, after an average of seven contacts with the family, only 43% of children (mostly Latino and African-American with low family incomes) received services after referral for developmental evaluation or other services. 10 In two clinic-based programs, the proportion of referrals evaluated was 51% 8 and 33%. 11
The goal of this study was to demonstrate a method of evaluating accuracy of developmental screening modeled on the evidence-based medical literature. Our questions were as follows:
What numbers and what proportions of children were screened, showed evidence of delay, were referred, were evaluated, and qualified for services?
Did screening and referral results meet previously recommended criteria for PVs and LRs?
How did the program combine screening results with clinical information in deciding whether to refer? Did combining the information strengthen prediction?
How did prediction change when we corrected for children RNE (verification bias)?
How many children with evidence of delay were not referred or not evaluated?
What proportion of children referred got to evaluation?
How did the program compare to other ones in the literature? How could it be improved?
Methods
Study population
Children screened in this study were attending two community health centers in Colorado. Screening aimed to identify young children who might qualify for Early Intervention (EI) through the local school districts. (EI refers to Part C of the Individuals with Disabilities Education Act.) Clinicians referred children for screening routinely at age 2 and at older ages if they had not been screened. They referred children under 2 years if they were concerned (18 cases). There were 422 children who kept appointments for screening between 22 August 2005 and 11 January 2008. Four children were dropped (2 for missing charts, 2 for Denver IIs not done), leaving 418 for review.
Previous surveys (2003 and 2005) of 179 parents from different families in the main clinic showed that the median family income was 81% of the federal poverty level and parents’ median educational attainment was ninth grade. Among the last 95 children in this study, half of whom went to a second clinic, parents’ educational level was also ninth grade. The primary language at home was Spanish (75%), English (13%), both languages (8%), and other (4%).
Parents’ speaking Spanish, English, or both languages was not associated with significant differences in the proportions of children referred, evaluated, or qualifying for services.
Because the health center did the study for quality assessment, following the Health Insurance Portability and Accountability Act (HIPAA) confidentiality standards, parents were not asked to sign informed consent.
Measures
Denver II
The Denver II is the 1992 revision of the Denver Developmental Screening Test. There are English and Spanish versions of the Denver II, each containing 125 items in four developmental domains. An examiner administers an age-appropriate sample of items, although some can also be passed by parental report. The number and pattern of items failed yield a result of Normal (Within Normal Limits (WNL)), Suspect, or Untestable. Each item is scored as pass, fail, or refused. Items that can be completed by 75%–90% of children at the child’s age but are failed are called cautions; those that can be completed by 90% of children but are failed are called delays. A normal score means no delays and no more than one caution; a suspect score means one or more delays or two or more cautions; a score of untestable means enough refused items that the score would be suspect if they had been delays. 12
The Denver II was administered during a separate appointment by a trained technician who was bilingual and who had completed the recommended training for paraprofessionals 12 under the supervision of the senior author. The technician had 40-min appointments and could spend time listening to parents and explaining her findings. In a parent–technician conference, she considered all information available, including the Denver II results, the child’s history, her own observations, and the parents’ opinions. If she decided to refer and the parents agreed, she faxed the score sheet of the Denver II and all identifying information to the local EI agency.
The EI program in the school districts started with a home visit by a bilingual Mexican teacher, offered transportation if needed, offered evaluations in Spanish or English in a single office visit, and followed up on cases. EI evaluated children within 6 weeks, determined eligibility, and implemented services. Policies and procedures of EI and other agencies fostered communication and follow-up. Communication between the clinics and EI was easy because it involved just a few people and they all knew one another.
Chart review
We reviewed the 418 medical charts between May 2008 and December 2010. Using a special form, two public-health nurses and the senior author reviewed all charts independently, and the senior author reviewed and entered all data.
The main information recorded during chart review was whether a child was referred to EI, was actually evaluated by EI, and, if evaluated, qualified for services (including monitoring in one case). That decision was made by the EI teams of the two local school districts, each consisting of five professionals. The senior author contacted the school district to obtain a report if there was none in the chart.
Parents of 13 children with Suspect Denver II results refused a referral to EI. Those were counted as RNE. Seven children were already receiving services at the time of screening. Three of them with Suspect Denver II scores were counted as referred, evaluated, and qualified for services; three with Untestable scores were counted as not referred but evaluated and qualified; one child, not delayed but receiving services solely because of prematurity, was counted as normal, not referred, and not qualified. Eight children with Suspect or Untestable scores were rescreened with normal results.
When children were not referred to EI despite Suspect or Untestable Denver II results, the technician wrote comments about why the children were not referred. The senior author reviewed the test items and those comments and then noted his agreement or disagreement with the decision not to refer. This information was used to estimate the number of possibly delayed children in these two groups who might have been missed.
Data analysis
The number of children qualifying for EI services was the major outcome variable of interest. PVs for both positive and negative screening results are reported as the percentage of children with a given screening result who qualified for services. The goal of screening is to maximize the PV of a positive screen and minimize the PV of a negative screen.
LRs (LR+ or LR−) were used to evaluate the ability of the screening information to raise or lower the PV over chance. These were calculated by changing probability percentages to odds using the formula p/(1-p) and then calculating the ratio of post-test odds (PV) to pretest odds (prevalence). Note that LR is always positive. The + and − signs refer to the screening result.
For evaluating the significance of LRs, we used the standards described by Furukawa et al. 13 If the LR+ is between 2.0 and 5.0, positive screening results “generate small (but sometimes important) changes in probability”; if between 5.0 and 10.0, they “generate moderate shifts.” If LR− is between .20 and .50, a negative screening result contributes a “small (but sometimes important) shift” in reducing the PV; if it is between .10 and .20, it contributes moderately.
Camp’s recommended threshold for an acceptable positive screening result, stated above, was a PPV of at least 60% and an LR+ of at least 2.0. For a negative screening result, her recommended threshold was that a negative screen lead to a positive result (1 − NPV) in 10% or fewer of cases and that the LR− be below .50. When the PV is unacceptable, but the LR meets the minimum standard, adding information often improves accuracy to acceptable levels.
We calculated PVs and LRs for two methods of defining positive and negative screening results. One method used the Denver II alone using a Suspect score as a positive screening result and a Non-Suspect (Untestable and WNL) score as a negative screening result. The second method combined Denver II results with information from the parent–technician conference. When this resulted in a referral to EI for further evaluation, the screening result was considered positive. Classification as a non-referral was considered a negative screening result.
Two types of corrections were also examined arising from the fact that only ~20% of the total population of 418 was evaluated by EI. The first correction was for verification bias. This correction is recommended when children are referred but some fail to be evaluated.14,15 Verification bias can be corrected statistically using a weighting procedure to estimate how many children would be expected to qualify for services if all of those referred had been evaluated. Failure to make this correction assumes that all non-evaluated referrals were normal. Some authors assume that the proportion of children qualifying among those not evaluated is the same as among those evaluated; we used Camp’s 3 more conservative assumption that the proportion of children qualifying is the same among those not evaluated as among those referred. The formula used to correct the number of children qualifying was (number of known qualifiers) + ((number of known qualifiers/number referred) × (number of RNE)).
The second correction was to estimate the number of non-referred children who might have qualified for EI services. We examined the reasons Suspect and Untestable children were not referred to identify those whose screening was incomplete or who the senior author thought should have been referred but were not. Treating these children as though they were RNE, we estimated the number who might have qualified if they had been referred. These were added to the number of non-referred children known to qualify for EI services to achieve a corrected estimate of the number missed by non-referral.
Results
Overall results
Table 1 shows the numbers of children with each type of Denver II result. Overall, 51% (212/418) of children had a normal Denver II, 31% (129/418) Suspect, and 18% (77/418) Untestable. There were 115/418 (28%) referred to EI. Of those, 70% (81/115) were evaluated by EI, and 79% (64/81) qualified for EI services. The total number who qualified for EI services (referred plus non-referred) was 67, which yields a prevalence of 16% (67/418).
Overall results.

WNL: Within Normal Limits.
Developmental status of these children is unknown because they were not evaluated by Early Intervention.
Speech therapy accounted for 69% of services for which children qualified. The speech sector of the Denver II by itself would have identified 77% (49/64) of those who qualified. Children under 18 months qualified in more cases than older children for occupational or physical therapy.
Accuracy of the Denver II alone
PVs and LRs are shown in Table 2 for the Denver II alone. Normal and Untestable children are reported together as Non-Suspect. The PV of a Suspect Denver II was 44% (57/129) with LR+ = 4.16; the PV of a Non-Suspect Denver II was 3% (10/289) with LR− = .16. Correction for verification bias was achieved by recalculating prevalence, PV, and LR after adjusting the number qualifying to include a percentage of children who were RNE. The adjusted number qualifying was calculated as ((number qualifying/number referred) × number RNE) + number qualifying. Using values in Table 1, this was ((57/96) × 28) + 57 = 73.6 for a Suspect Denver II. Corrected results are also presented in Table 2.
Accuracy of Denver II alone.
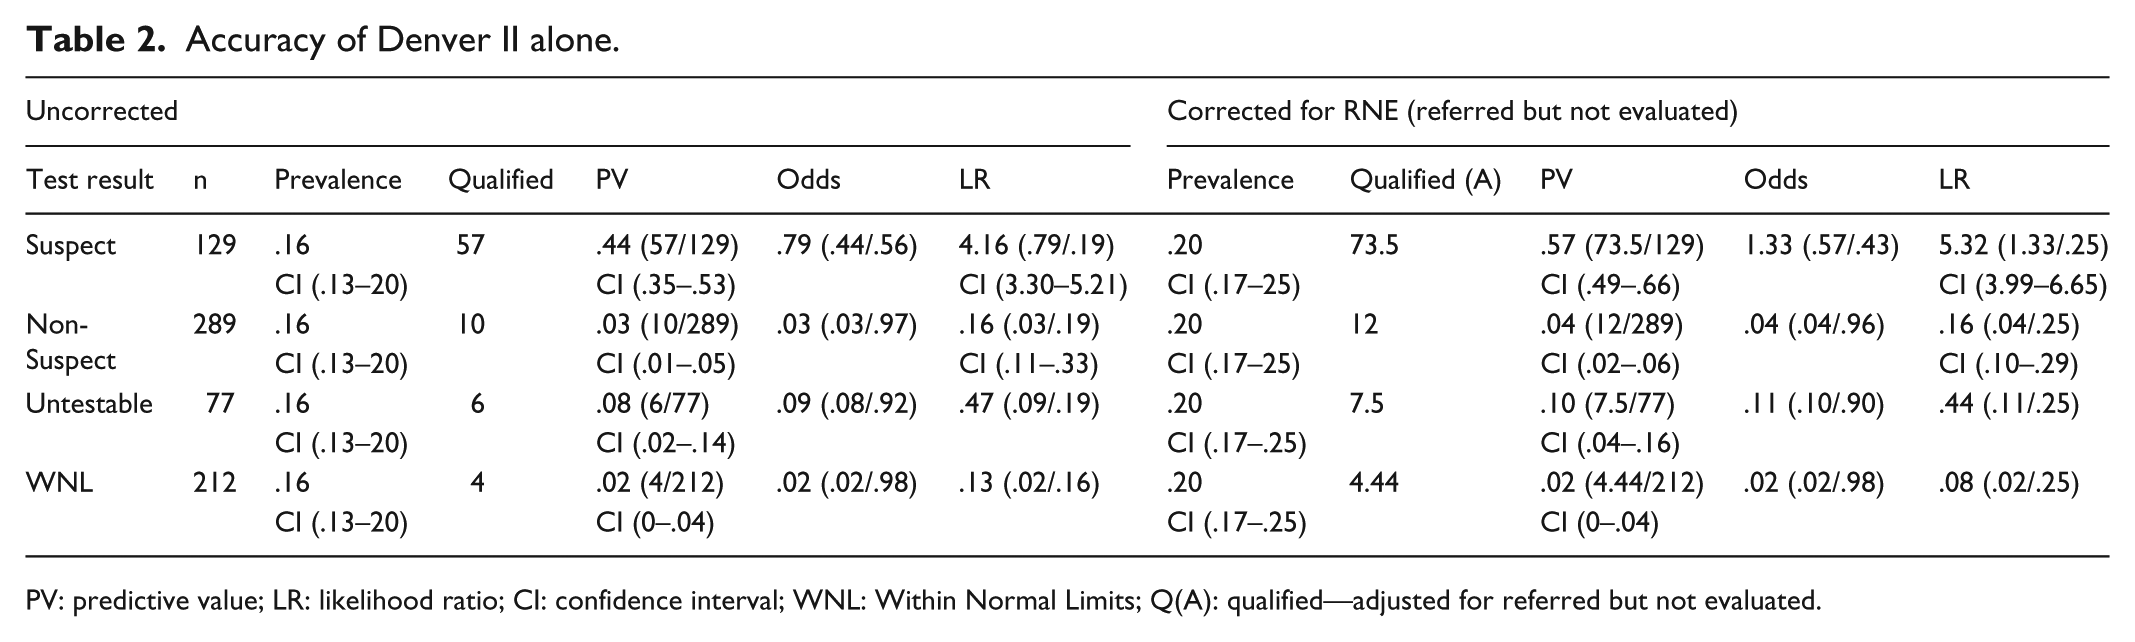
PV: predictive value; LR: likelihood ratio; CI: confidence interval; WNL: Within Normal Limits; Q(A): qualified—adjusted for referred but not evaluated.
With correction for verification bias, the PV of a Suspect Denver II rises to 57% (confidence interval (CI): .49–.66) with LR+ = 5.32 and a Non-Suspect Denver II rises to .04 with LR− = .16. The PV for a Suspect Denver II still falls short of the 60% goal but the 95% CI contains the goal. Both the corrected and uncorrected PVs of a Non-Suspect Denver II (4%) and LR− (.16) meet the preset standards.
Accuracy of the decision to refer
Table 3 shows the PVs and LRs for referrals, which reflect the combination of the screening test with other information from the parent–technician conference. The raw PV of a referral was 56% (64/115) with LR+ = 6.68. After correction for verification bias, the PV of a referral became 72% (82.5/115) with LR− = 10.3. The 95% CIs for raw and corrected PVs overlap, indicating that the differences are not statistically significant. Table 3 also shows the PV and LR for the combination of each Denver II score and parent–technician conference. Referral of a child with a Suspect Denver II yields an uncorrected PV of 59% (57/96) with LR+ = 7.57 which corrects to 77% (73.5/96) with LR+ = 13.4, both above the goal of 60%. Referral of a child with a Non-Suspect Denver II (PPV = 37%) falls short of the acceptable threshold but is not low enough to dismiss the need for referral.
Accuracy of the decision to refer.

Q: qualified; Qa: qualified—adjusted for referred but not evaluated; PV: predictive value; LR: likelihood ratio; CI: confidence interval.
Accuracy of the decision not to refer
In Table 3, the PV for a non-referral is 1% (3/303) with LR− = .05, both meeting Camp’s standards for dismissing the need to refer. These results assume that all of the non-referred children would have failed to qualify for services. In some ways, this is a reasonable assumption because there was no evidence that any other children in the population were identified as delayed during the later chart review. Nevertheless, we sought to determine how estimates of children missed by non-referral would affect the PVs and LRs.
The 303 children who were not referred included 33 children with Suspect Denver II scores and 67 with Untestable. Three of the Untestable children were already receiving services, and screening was insufficient in three Suspect and eight Untestable cases. The senior author questioned the technician’s decision not to refer 13 cases (10 Suspect, 3 Untestable). In the remaining 73, the senior author agreed with the technician because evidence of delay was minor or transient (20 Suspect, 53 Untestable—see Table 4). The total number of possible additional referrals among children with suspect scores was 13; among untestables, the number was 11.
Reasons considered acceptable for not referring.

We then estimated the number of children who might have qualified for services among the subgroups. We treated the 13 children with suspect scores as though they were RNE. Multiplying 13 by 59% (the unadjusted PPV of a referred Suspect Denver II) indicates that 8 might have qualified. A similar procedure indicated that 4 children might have qualified from the 11 Untestable children who had not been evaluated (11 × 37%, the PV for a referred non-suspect child). Using the rule of three, 16 we estimated that a maximum of three additional children might have qualified from among the WNL group, bringing the total number of potentially missed children to 15/303. Adding the new 15 to the 3 non-referred Untestables already receiving services brings the potential total to 18.
Table 5 shows the PVs (1 − NPV) and LRs for non-referrals before and after adjusting for hypothetically missed children. The overall PV of a non-referral rises to .05 with LR− = .16, which remains acceptably low. However, the PV (.18) and LR− (.79) for a non-referred child with a Suspect Denver II are unacceptably high. In Table 5, the PV of a non-referred Untestable rises to 10% with LR− = .45, barely meeting the preset standards for acceptability. The majority of these cases were children whose screening was insufficient because parents failed to return for rescreening.
Accuracy of the decision not to refer.
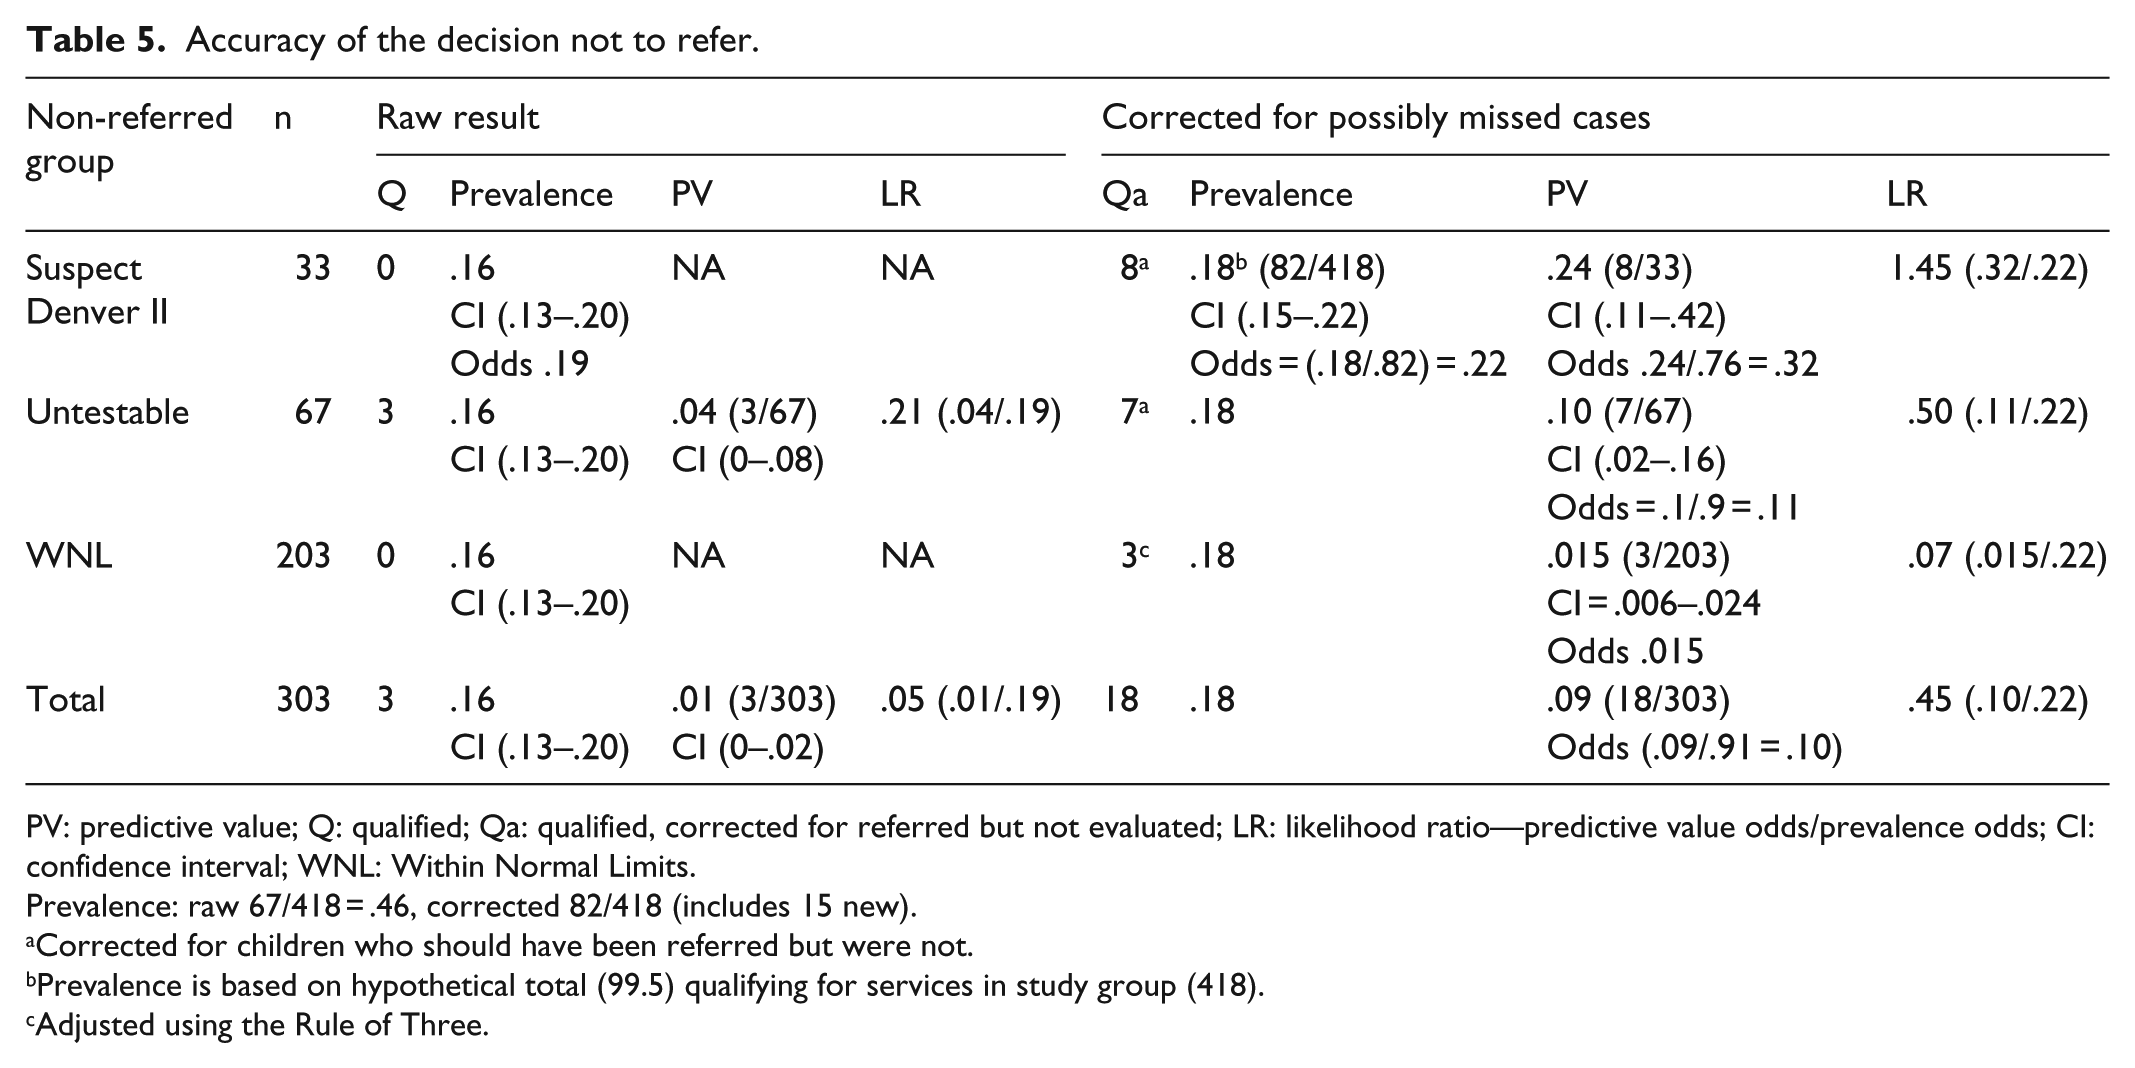
PV: predictive value; Q: qualified; Qa: qualified, corrected for referred but not evaluated; LR: likelihood ratio—predictive value odds/prevalence odds; CI: confidence interval; WNL: Within Normal Limits.
Prevalence: raw 67/418 = .46, corrected 82/418 (includes 15 new).
Corrected for children who should have been referred but were not.
Prevalence is based on hypothetical total (99.5) qualifying for services in study group (418).
Adjusted using the Rule of Three.
Analysis of reasons for non-referral also provided information about whose decisions led to children not being evaluated. As noted above, the technician chose questionably not to refer 13 children and follow-up was incomplete in 3, resulting in a total of 16 children who probably should have been evaluated. Parents failed to return for rescreening (8), refused referral (10), and accepted referral but failed to keep the appointment (24) for a total of 42 who probably should have been evaluated. Review of children’s charts showed that some parents expressed concern about development during the well-child visit. Of those who did, 82% (37/45) completed evaluation of their children; of those who did not, 58% (41/71) completed evaluation (p = .01).
Cost
The technician earned US$5096 in 2005. Including costs of materials, we estimate the costs of the project at US$5169 a year, US$13,579 for the 29 months of the study, US$32 per Denver II, and US$212 per child qualified. This estimate omits the indirect costs of supervision, medical records, the appointment system, and other items. The medical director of the clinic said she supported the program because of its results and its low cost. The Colorado Medicaid program does pay for developmental screens; we estimated that its reimbursements could have paid the technician’s salary.
Discussion
PVs and LRs for Denver II alone
Traditionally, studies of developmental screening in clinical settings report only the percentage of children who were evaluated who met a gold-standard criterion for delay. In this study, this was 79%, which compares favorably with results of studies with the Ages and Stages Questionnaires (ASQs). 17 In those studies, that percentage varied from 34% 18 to 55% 19 to 63% 8 to 68%11 to 77%. 9 11
This value is an overestimate of the PV of a positive test when it fails to take into account children who were not evaluated. A more appropriate estimate of the PPV is the percentage of children with positive screening results who qualify for services. In this study, this value was 44% (61/129) for the Denver II alone, which is in the same range as reported for other screening tests administered to children aged 15–36 months. For example, PPVs of 38% 17 and 33% 8 have been reported for the ASQs, 46% for the Parents’ Evaluation of Developmental Status (PEDS). 20 The uncorrected LR+ of a Suspect Denver II was 4.16; the corresponding figures calculated from other studies were 4.93 and 5.0 for the ASQs and 3.76 for the PEDS. All of those values that fail to correct for children RNE will now be underestimates of PV and LR, as in this study, because of verification bias.14,15
PVs and LRs for combined results—referral
Even with correction, all the tests have the same limitations, namely, a minimal to moderate LR+ and a PPV below .50 in most populations. Evaluating the strength of test evidence of delay and basing referrals on both information from the screening test and information from the parent–technician conference provides nearly acceptable PVs without correction (PPV 56%, LR+ 6.68) and values above the acceptable threshold with it (PPV 72%, LR+ 10.3). In two other clinic-based studies using the ASQs, the PPV of a referral was 33% (86/261) 8 and 23% (26/115). 11 Correcting for children RNE, the figures rise to 50% (130/261) and 39% (45/115), respectively. Although some have argued that all children with any hint of delay should be referred, 6 clinicians seldom do so, 7 and they sometimes successfully identify delayed children despite normal test results.8,9 The current findings demonstrate the value of combining information as urged by previous writers.5,6,21 Systematic study of how to combine information from different screening tests and/or other information should improve our ability to develop clinical decision rules that improve PV. Those in turn would support vigorous efforts of both clinicians and parents to follow up on recommended referrals.
Identifying subgroups failing to meet overall standards
Even when the overall performance of a program meets standards for referral and non-referral, some subgroups may fail to do so. Identifying and analyzing the reasons for failure in those subgroups can lead to further improvement. In this study, two subgroups stood out as needing additional attention. In the subgroup of 19 children with Non-Suspect Denver II, referred because of information from the parent–technician conference, 7/19 (37%) qualified for services. This PV failed to reach the threshold for successful referral, but it was too high to dismiss the possibility of delay. A clinician seeing these data might still decide to refer those children, creating some over-referrals but not very many. An alternative would be to gather more information about each child, for example by rescreening later or administering a different screening test.
In the other subgroup, non-referred children with Suspect Denver II, corrected PV (24%, 8/33), and LR− (1.45) were too high to accept non-referral. The majority (10/13) of children in this group would have been referred if the senior author had reviewed decisions not to refer at the time they were made.
Follow-up after screening
The proportion of children referred who got to evaluation in this study was 70% (81/115). This percentage is at the high end of the range reported in other studies, where the percentage has varied from 33% 11 to 51% 8 to 76%. 18 Three factors probably increased this number: the ability of the technician to spend time with parents, careful follow-up, and communication between her and EI. In addition, significantly more parents who expressed concern during the well-child visit followed through than did parents who did not express concern. A recent report showed reasons parents decide not to follow through: misunderstanding the pediatrician, preferring to wait and see how the child develops, considering themselves expert in their child’s development, and facing practical challenges like reaching people on the telephone. 22 The matter deserves further study, especially among parents who appear unconcerned.
Proportion of children screened
Despite success in screening outcomes, the program reached only 47% (242/512) of the targeted 2-year-olds who had a well-child visit during the project period in the main clinic and 19% (373/1935) of all children in the age range 6–76 months. Previous studies using the ASQs have screened varying proportions of eligible children: 25%, 18 54%, 9 62%, 23 and 93%. 11 The number screened in this study was low because the technician worked only 20% time. When a child had a well appointment and she was not working, a Denver II appointment was made later on and parents were less likely to come. If her time had been expanded to full time, her salary would have cost more, but she would have had perhaps half time available for other work.
Implications for other screening programs
Although the Denver II was used in this study, the purpose of this article was not to justify its use. However, aspects of the Denver II often criticized, for example, date of norms (1992) and a Colorado standardization sample, did not adversely affect its usefulness in these Colorado clinics. Indeed, viewed from the standpoint of PVs and LRs, the current results with the Denver II equal or exceed published reports from comparable studies using parent questionnaires. The convenience of parent questionnaires makes them ideal for maximizing the number of children who get screened in routine pediatric settings. Although less efficient, screening tests involving direct observation such as the Denver II are still particularly useful when one is not confident that answers to questionnaires are dependable. Choice of test usually rests on such factors.
A more general problem is that despite a significant overlap in what is measured by the different screening tests, each procedure contributes something unique. This is a common problem in differential diagnosis where different types of information must be combined to reach the correct diagnosis. 24 Study of how different types of information can be combined to predict a given outcome can lead to development of clinical decision rules such as the Ottawa ankle rules for deciding when to order an X-ray for an injured ankle. 25
This study demonstrates that combining the results of the Denver II with information obtained during the parent–technician conference can improve PPVs to acceptable levels without significantly increasing under-referrals. Presumably, similar results could be obtained with other screening tests with systematic study. Such study of how to combine information from different screening tests and/or other information should improve our ability to develop clinical decision rules that improve efficiency. Those in turn would support vigorous efforts of both clinicians and parents to follow up on recommended referrals.
Limitations of study
A major limitation in evaluating success of a clinical program is that the quality of outcome data is not the same for all children. Using a lack of evidence of delay in later chart review as evidence of normal functioning is questionable. There is, however, precedent for this in the medical literature. 13 We also recognize that the efforts to adjust for children RNE are, at best, informed guesses. Although not ideal, both procedures provide useful information.
Summary
The approach to evaluation described here clarified successful aspects of the screening program and identified areas for improvement. The program achieved higher levels of predictive accuracy when screening test results were combined with other information from the parent–technician conference. A clinician in these clinics could expect that 59% (minimum) to 77% (corrected) of children with a suspect score on the Denver II and a confirmatory family conference would qualify for EI services. Likewise, he or she could expect that, at worst, fewer than 10% of children not referred would qualify for services if they were evaluated.
Evaluation showed three areas for improvement: (1) Failure to return for rescreening and to obtain evaluations of children referred to EI, primarily due to parents not following through, emerged as a major problem for this and most screening programs. (2) Closer supervision of the technician’s decisions not to refer children with Suspect results could have increased referrals and increased confidence in the decision not to refer. (3) Having the technician available full time would have enabled her to see children at all well-child appointments. Further systematic study of combining information is recommended to improve efficiency of developmental screening programs.
Footnotes
Acknowledgements
The authors thank Lydia Sofia Delgado for performing the Denver II; Mona Reeves, RN, Ginny Strange, RN, and Sonia D. Martinez for gathering data; and Sara Harper, RN, for analyzing the data. The latter three volunteered their time.
Declaration of conflicting interests
The authors declared no potential conflicts of interest with respect to the research, authorship, or publication of this article.
Funding
A small private grant of US$500 supported the work of nurses in collecting data. The authors received no other financial support for the research, authorship, or publication of this article.