
Abstract
In the Multiple Sorting Task (MST) participants sort entities into their self-defined categories. The descriptions they provide of their categories provide qualitative data. Multi-dimensional scaling of sorting generates quantitative results. Relating the qualitative descriptions to the quantitative output creates integrated mixed methods. As part of the study of conceptions of public space an online MST was developed using Zoom and Miro, supported by Email and Smartphone where necessary. Twenty adult participants performed the MST with 20 pictures of public spaces in Stockholm. Results demonstrate the viability of the novel digital MST. The MST’s benefits, challenges, and applications in its digital form as an integrated mixed-methods are presented.
Introduction
Card sorting is a well-established research method in various social science and technology studies as either quantitative, qualitative, or mixed methods (Conrad and Tucker, 2019; Yeh, et al., 2014). This method helps to elucidate people’s mental models for complex concepts, benefitting research that investigates subjective and contextualized accounts. While traditionally this method is carried out through in person face-to-face open-ended interviews (Canter et al., 1985; Rosenberg and Park Kim, 1975; Spencer, 2009; Trotter and Potter, 1993), there are some recent online card-sorting tools and analysis matrices developed, that is, www.usabilitest.com/card-sorting and www.optimalworkshop.com/optimalsort (Conrad and Tucker, 2019) allowing for uploading visual material (e.g., pictures) through paid services. This means that online freely available sorting that can be used by diverse social groups remains a challenge as researchers often bear the cost for using those services and products. The current societal shift in digitalization in part triggered by the COVID-19 pandemic presents a challenge, need, and opportunity to further develop online sorting methods. Recent advances in digital applications have also enabled their expanded use in data collection through online interviews and workshops within mixed methods research paradigm (Alexander et al., 2019; Riha et al., 2021). This study explores online sorting using existing web-based software and digital applications that are free of charge for research participants and have widespread use in many fields. This paper presents the development of a digital multiple sorting procedure using pictures to understand 15 young and 5 older age participants’ conceptions of public space in the city of Stockholm, contributing to the literature on mixed methods for cognitive structure, applying digital tools.
Recognizing sorting as a mixed methodology for exploring concepts
The sorting research method, also known as card sorting or pile sorting, is a longstanding method used in an array of social science and technology studies, including psychology, anthropology, education, nursing, management, consumer service, information technology and software design, and so on (Canter, 2016; Conrad and Tucker, 2019; Rosenberg and Park Kim, 1975; Spencer, 2009; Trotter and Potter, 1993). There are different variations of the sorting method among different disciplines and for specific research objectives, as discussed for example in Conrad and Tucker (2019) and Yeh, et al. (2014). The sorting research method typically involves a procedure of (1) identifying the cards or objects to sort, including researcher-generated cards (Baxter et al., 2015; Schmettow and Sommer, 2016), participants-defined cards (Lyon et al. 2016; Saunders, 2015; Skillen, 2019; Spencer, 2009) or mixed-models of cards (Conrad and Tucker, 2019); (2) respondents sort the cards into groups or piles, usually on the basis of similarities; (3) recording the sorting results (data transformation); and (4) analyzing the data of the sorting results. Notably, different terminologies within sorting method are used in various fields and not all sorting method are mixed-methods inquiries. Furthermore, some sorting studies have addressed the need for age-appropriate adaptions and verbal explanations of the rationale for sorting (e.g., Cooper, 2002).
The Multiple Sorting Task (MST) is an interactive interview-based sorting procedure, first developed in the field of environmental psychology to assist individuals to articulate their perceptions of complex concepts such as architecture styles, room, place, and so on. Therefore, it is appropriate for exploring the conceptions of public space. This builds upon traditions in environmental psychology studies to incorporate visual material (i.e., colored pictures) within the general sorting method (Budhwar, 2000; Fiore et al., 2003; Groat, 1982; Wilson, 1996; Wilson and Mackenzie, 2000). The use of pictures is similar to photo elicitation and other visual methods and techniques (Fearon, 2019; Kleih et al., 2022; Philip et al., 2021), which helps to obviate possible language or culture barriers in studying ambiguous and/or stigmatized subjects. In the MST procedure, the participants are asked to sort pictures into groups in such a way that all pictures in one group are similar in some significant ways and different from those in other groups. This implies that the cognitive process of identifying differences is informed by the act of recognizing similarities. Furthermore, the MST procedure does not have specified numbers of categories nor descriptors of categories but respondents generate their own. It is thus different from Q-sort methodology (Ramlo, 2016; Stephenson, 1953) which often has specified categories with an incremental scale (Pitt and Zube, 1979).
As a mixed-methods MST fits the “qualitative-quantitative continuum” rather than “qualitative-quantitative dichotomy” as Ramlo (2016) has elaborated on Q methodology. MST is distinct from a process such as Yeh et al. (2014), which focuses on degrees of similarities and differences between concepts, using sorting in a quantitative fashion. In contrast, because the MST is drawn from Personal Construct Theory (Kelly, 1955) and has roots in clinical object sorting (e.g., Lovibond, 1954), it emphasizes the “constructs” that people use, not only similarities. The analysis of these conceptualizations is enabled using non-metric multidimensional scaling (Schiffman et al., 1981). The mixed-methods nature of MST is evident in its integration of qualitative descriptions and the application of a quantitative statistical analysis technique—Multidimensional Scalogram Analysis (Lingoes, 1973).
Beyond sorting in-person
Motivated by the challenge and opportunity of MST, the current study explores digital tools that would enable an online MST, thus adding to the mixed methodology. Two key criteria are considered for this development: (1) face-to-face communications that allow real-time responses; (2) easy access for all. The former ensures mutual understanding of the data, whereas the latter values access and inclusiveness of digital methods. This is important because the digital literacy skills (Alkali and Amichai-Hamburger, 2004) required for participating in research online can lead to potential “digital exclusion” (Helsper and Reisdorf, 2017; Seifert, 2020). A model that combined web-based applications, allowing virtual meetings and picture-sorting activities becomes the digital MST. This comprises the virtual meeting app Zoom and the digital whiteboard app Miro. It is advantageous for the experiment that both apps have wide coverage of users, different versions, for various devices and systems (e.g., Android, iOS).
The current study illustrates and tests the viability of the mixed-methods MST procedure applied online, including a comparison of the results of digital MST and non-digital MST. The following sections provide a demonstration of the processes of a digital MST, using Zoom and Miro, involving 15 young adults and 5 older adults, investigating the conception of public spaces in the city of Stockholm. Data collection, data transformation, and integrated qualitative and quantitative data analysis using Multidimensional Scalogram Analysis (MSA) are considered as well as a comparison of the digital MST and non-digital MST (from the previous publication). This is followed by discussions of the benefits of the digital MST, its best use, challenges and possible expanded applications to further test the digital MST.
Methods
The study used a multiphase convergent mixed-methods design (Fetters et al., 2013) to explore the development of a digital MST procedure. Figure 1 illustrates the four consecutive stages to develop the digital MST procedure.
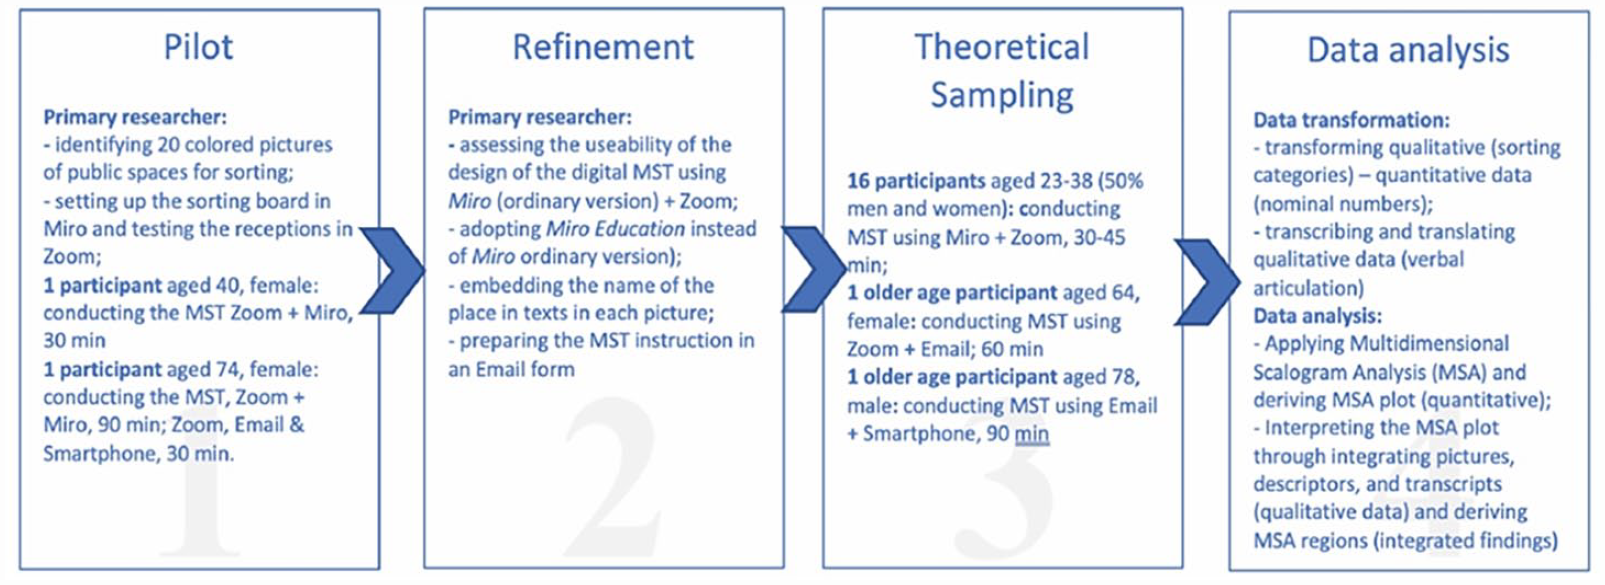
Convergent mixed-methods study design: Developing a digital MST procedure.
Study setting
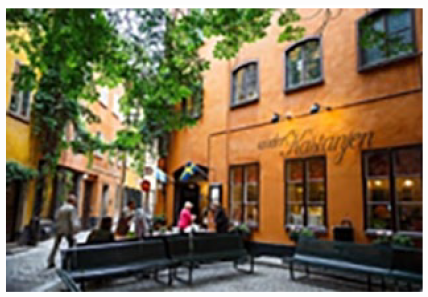
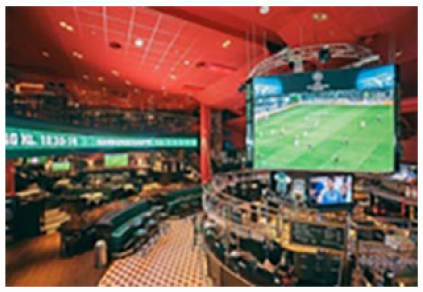
There are two key components to set up the digital Multiple Sorting Task (MST) procedure: (a) a set of pictures for sorting; (b) an online environment in which the participants conduct the MST. For pictures, 20 colored pictures of public spaces in Stockholm, consistent with a previous study using non-digital MST (authors’ published study), were used in the present study. The use of pictures is not only validated for architectural and landscape studies (e.g., Andersson, 2011) but also established in exploring complex and sensitive issues in broader social sciences, known as “photo elicitation,” within visual and mixed methods research (Kleih et al., 2022; Peroff et al., 2020). The picture representations of public spaces, which refers to physical places and spaces that are publicly accessible (Madanipour, 2013), feature three facet elements—physical, action, and cognitive (Scott and Canter, 1997) in the present study. They were prepared in two formats: (a) a collection of 20 places in one image which allows the participants to see all the places on the screen at once; (b) 20 individual pictures of public spaces so that the participants could see and manipulate the individual picture freely on screen. Alphabet letters from A to T were assigned to the 20 pictures respectively.
The online environment for the MST procedure was created using a combination of web-based digital applications. Zoom and Miro were used as a primary model for the digital MST procedure (see the example of a pre-designed sorting board in Miro in Figure 2). Zoom was chosen to perform in-person meetings online for its ease of use and prevalence (Boland et al., 2022). The embedded functions in Zoom, such as “share screen,” “record,” and “chat”, were of great value for data communication and data transformation. The digital whiteboard app Miro was used for the sorting activity as the application was designed not only to allow customized board design using visual material and texts but also to enable multiple users to interactively work on the same board simultaneously (e.g., researcher and participants can see each other’s cursor and edit the board simultaneously). Alternative applications such as Email and Smartphone were used in a few cases to assist older age participants to conduct the digital MST procedure after technical challenges were encountered while using the primary model.
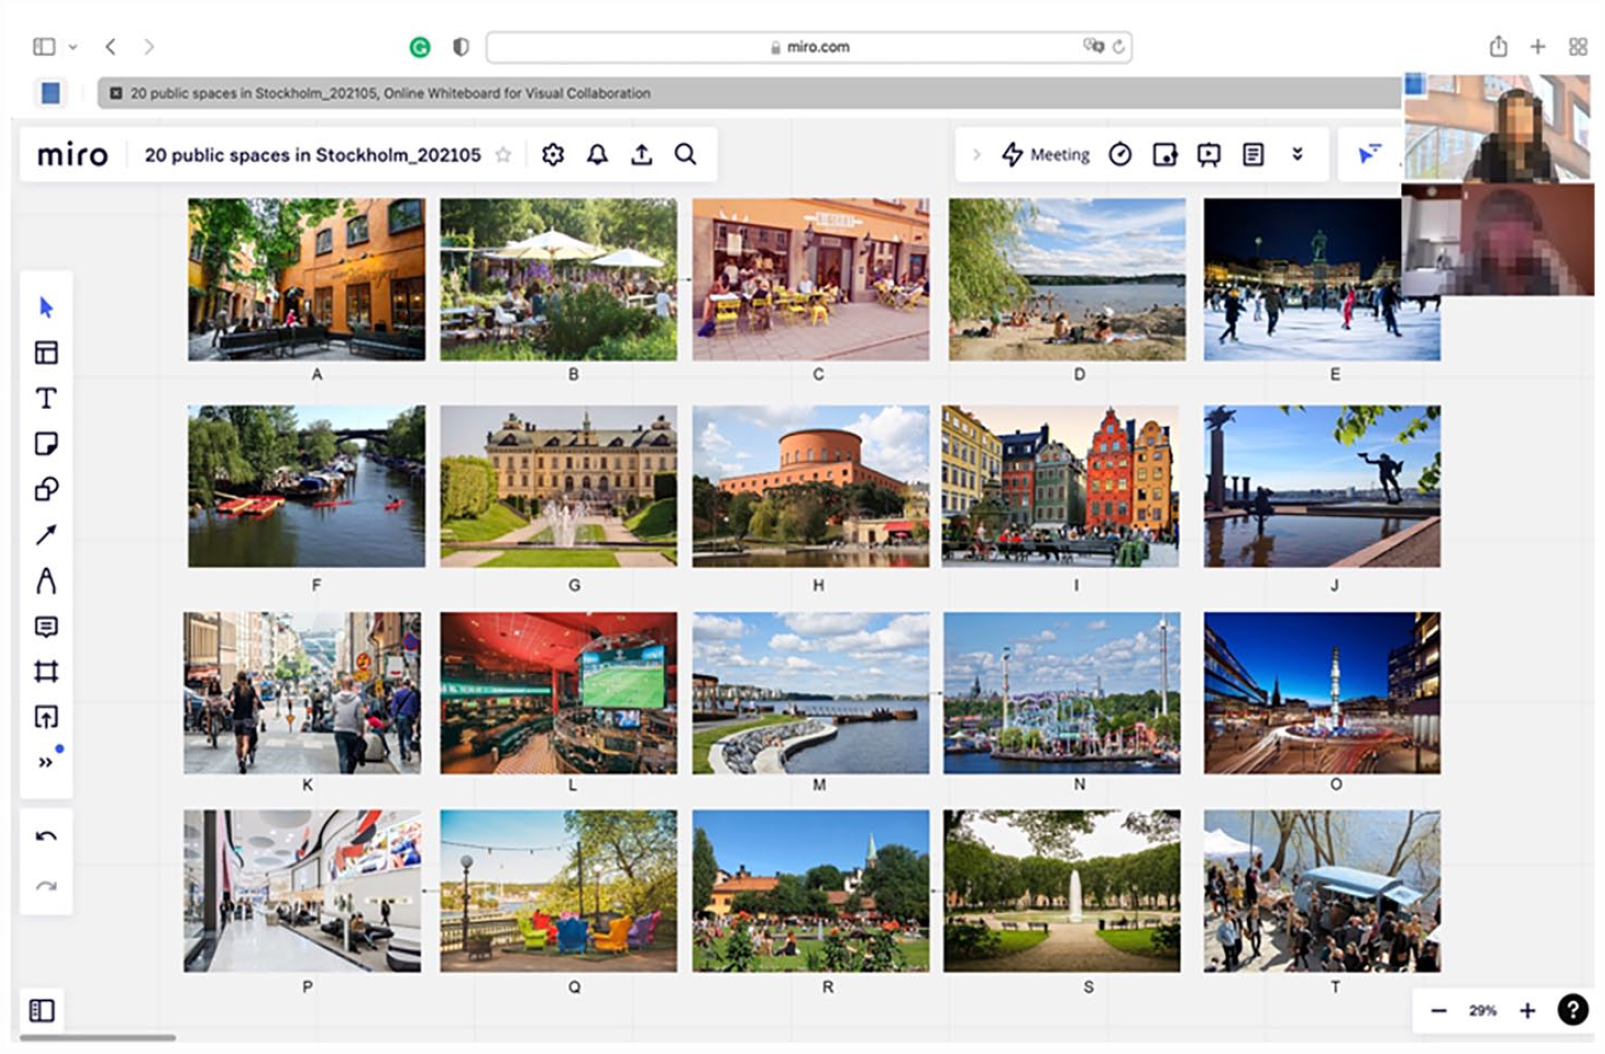
Pre-designed board in Miro for the digital MST procedure (user entry interface), Zoom interface is shown on the upper-right corner of the screen.
Data collection
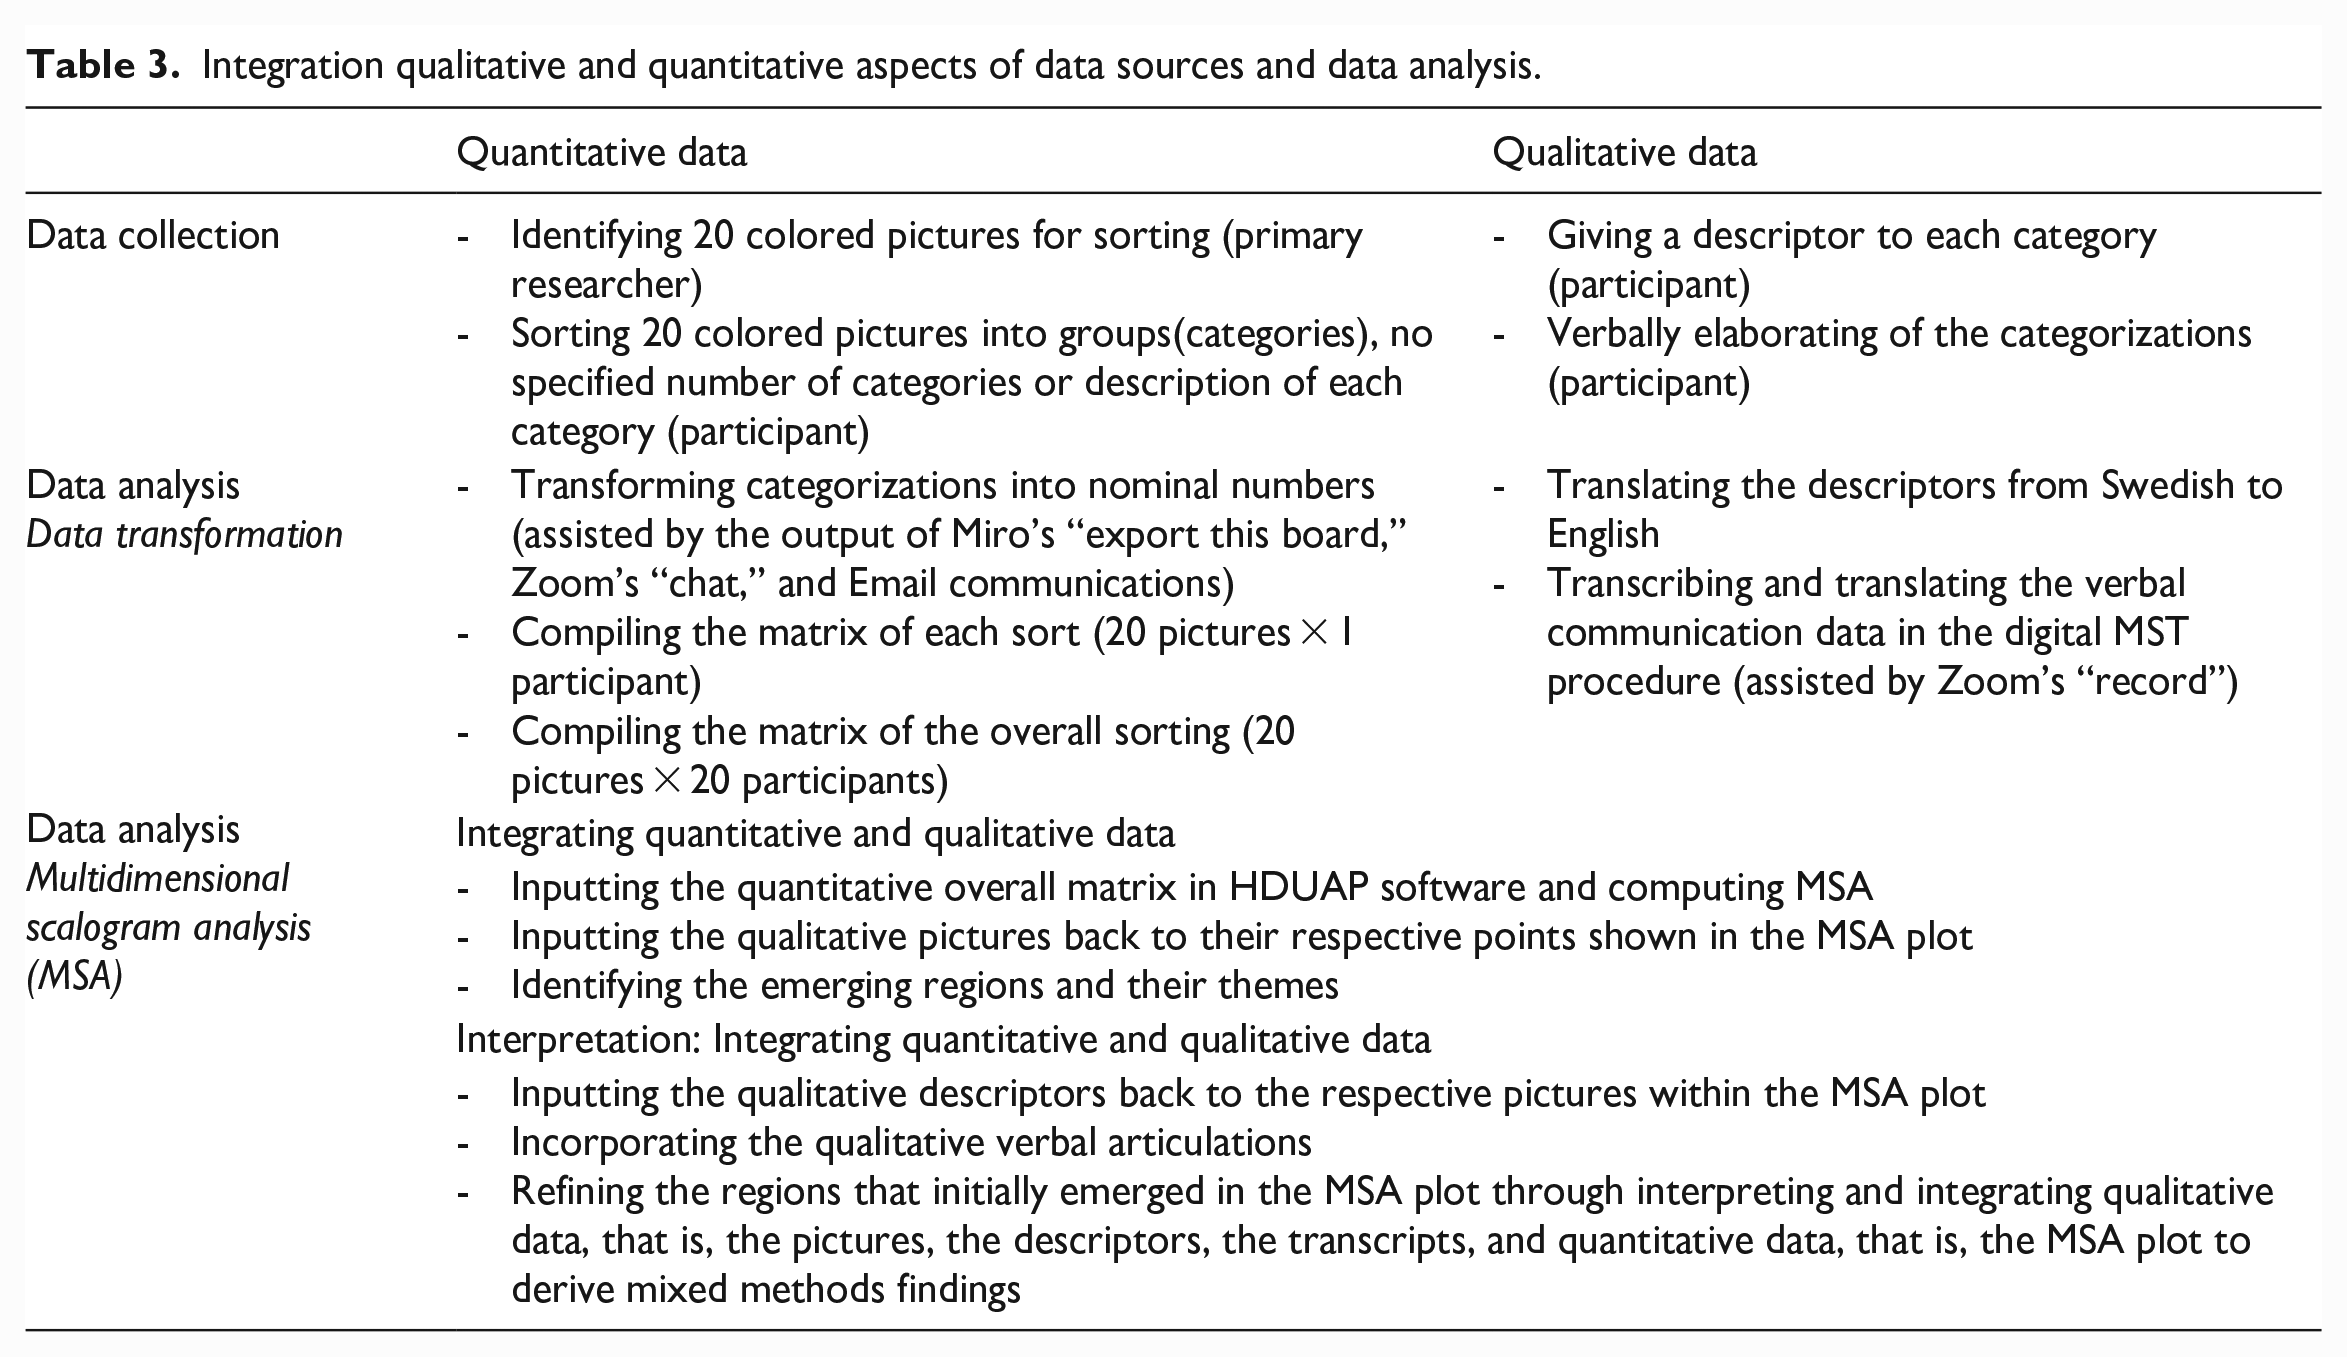
The data was collected from April to September 2021. The English language was used in interviews with the young participants, and the Swedish language was used for older age participants following their preferences. Table 3 summarizes the integration of qualitative and quantitative data aspects.
Piloting and refinement
In the pilot phase of the study, one female young web design professional and one female visual artist of older age were purposefully recruited (Patton, 1990) as volunteers to conduct the MST procedure using Zoom and Miro (ordinary version). Several refinements of the design followed. First, Miro Education version replaced Miro ordinary version. This is because that the ordinary Miro version required account registration for new Miro users before they could actually use the application resulting in barriers to participation, particularly for older adults who typically were not used to such experience with apps. Miro Education version, instead, did not require the participants to “login” but allowed anonymous participation. Second, to increase participants’ familiarization with the places in the pictures, the commonly known names of the places were respectively embedded in the pictures in texts. The texts were shown when the cursor was placed on top of the picture. This refinement of the sorting objects is important as the MST, like all qualitative methods, is sensitive to details in the instructions. Third, the pilot with the older age participant revealed that data communication might need alternative digital tools (e.g., Email and Smartphone) to assist, due at-times to the instability of the internet connection and fatigue experienced by the participant. For this reason, the primary researcher prepared an alternative digital MST in the form of an email letter.
Sampling
The criteria for research participants were those who were 18 years old and above, living in Stockholm and were interested and available to attend a virtual meeting through a personal computer (PC) to discuss public spaces in Stockholm. The recruitment advertisement was sent through emails to the municipalities and civil organizations in Stockholm and posted on relevant organizations’ social media pages complying with the local COVID-19 restrictions. Residents in all forms of care facilities were not included in this study.
The sample size was firstly purposefully designed (Patton, 1990) in the pilot phase and theoretically designed (Coyne, 1997) in the following research process. For the purposeful sample in the pilot tests, the inclusion of participants of young and old age and different levels of digital literacy (i.e., an IT-related professional is likely on the other side of the digital literacy spectrum than that of an artist dedicated to traditional paintings). The theoretical sample during the continuing research phase allows flexibility in the sampling strategy, which does not rely on a pre-determined sample size but focuses on matching the need of data for a specific study and real-world conditions. In this study, 20 adults participated and conducted the MST procedure online, which includes 5 older adults aged 64–83 (3 female and 2 male) and 15 younger adults aged 23–38 (8 female and 7 male). Each participant conducted the MST individually. This corroborates previous studies using mixed methodology sorting studies, that “a sample size of 15–20 is sufficient to produce a stable structure using the chosen methodology” (Tullis and Wood, 2004; Wilson and Mackenzie, 2000; Wood and Wood, 2008). It is noted that the sample size of the previous work used non-digital MST is six young adults who have sorted the identical set of 20 places as the present study. Therefore, the results of the digital MST versus non-digital MST across six participants will be discussed later in section 3.2.
Data analysis
Data transformation
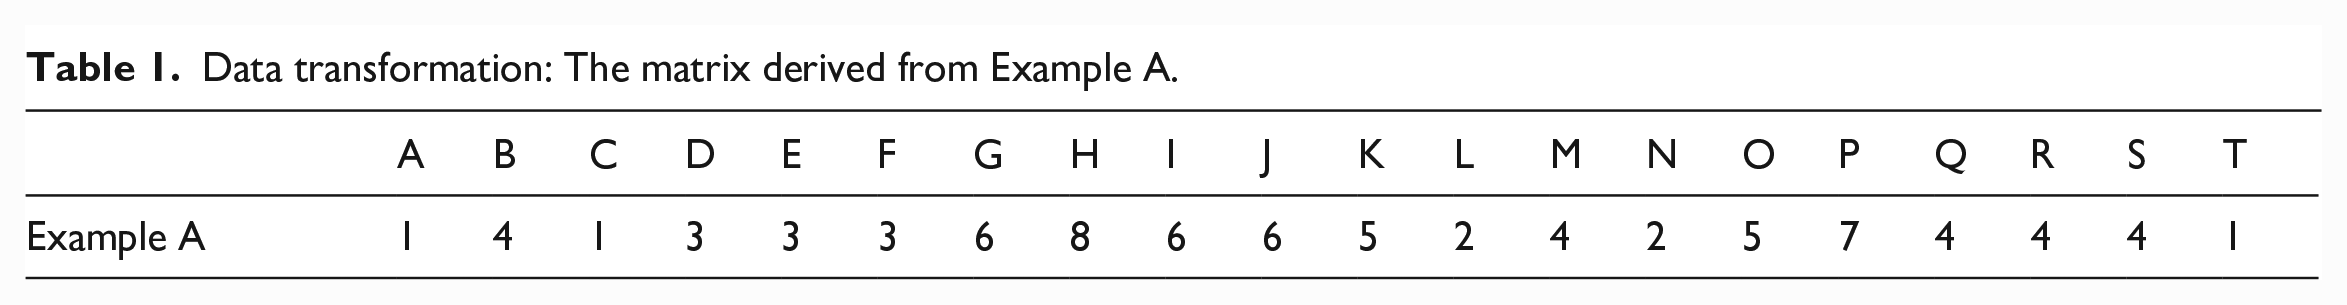
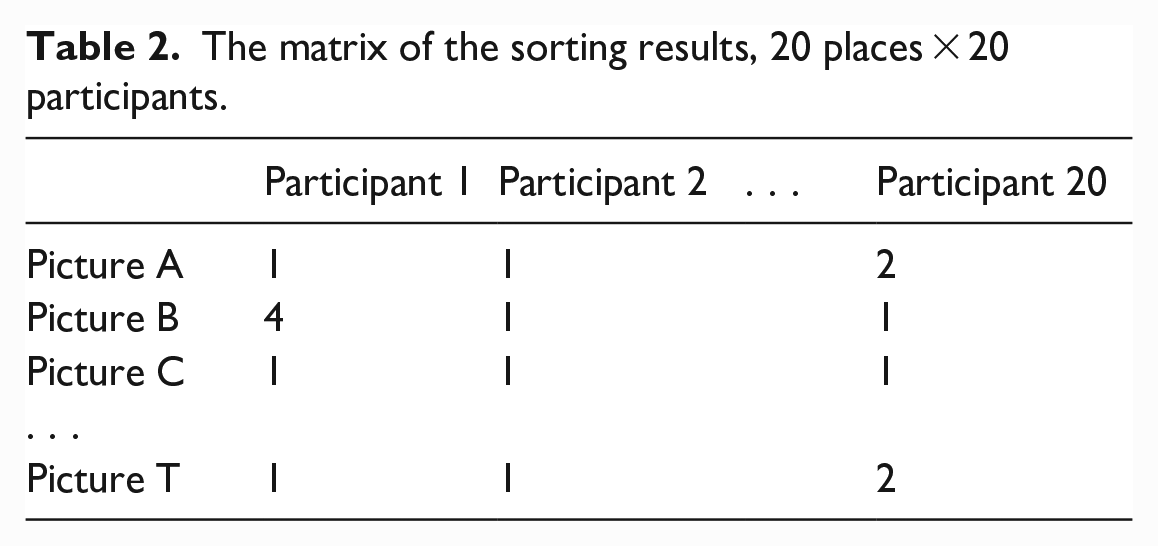
Data transformation, elsewhere referred as “data recording” or “data administration” (Conrad and Tucker, 2019; Yeh et al., 2014), was then conducted by the primary researcher through (1) Miro’s built-in function “export this board” to save the sorting result in pdf format (see Figure 3); (2) Zoom’s “chat” and its exporting function; (3) and Email export. For transforming the data of the participants’ sortings, using Example A from Miro’s export as shown in Figure 4, eight categories were formed: picture A, C, and T are shown in one group and thus share the categorical number “1”; picture L and N are in the second group and share the categorical number “2,” and so on. In this way, an individual data matrix was compiled (Table 1). In the same fashion, the sorting categories and their descriptions written in Zoom’s “chat” and Email were also manually transformed into data matrices. An overall matrix, made of 20 rows of pictures and 20 columns of individual’ sort, was compiled (Table 2). Importantly, the numbers in the cells of the matrices represent the category in which each picture is assigned by one participant. The “1” in a column for one person does not necessarily mean the same as a “1” in another person’s column. The number is qualitative and has no ordinal significance. Its use is for the comparison of each participant’s categorization scheme.

Data recording/transformation using Miro’s “export the board.”
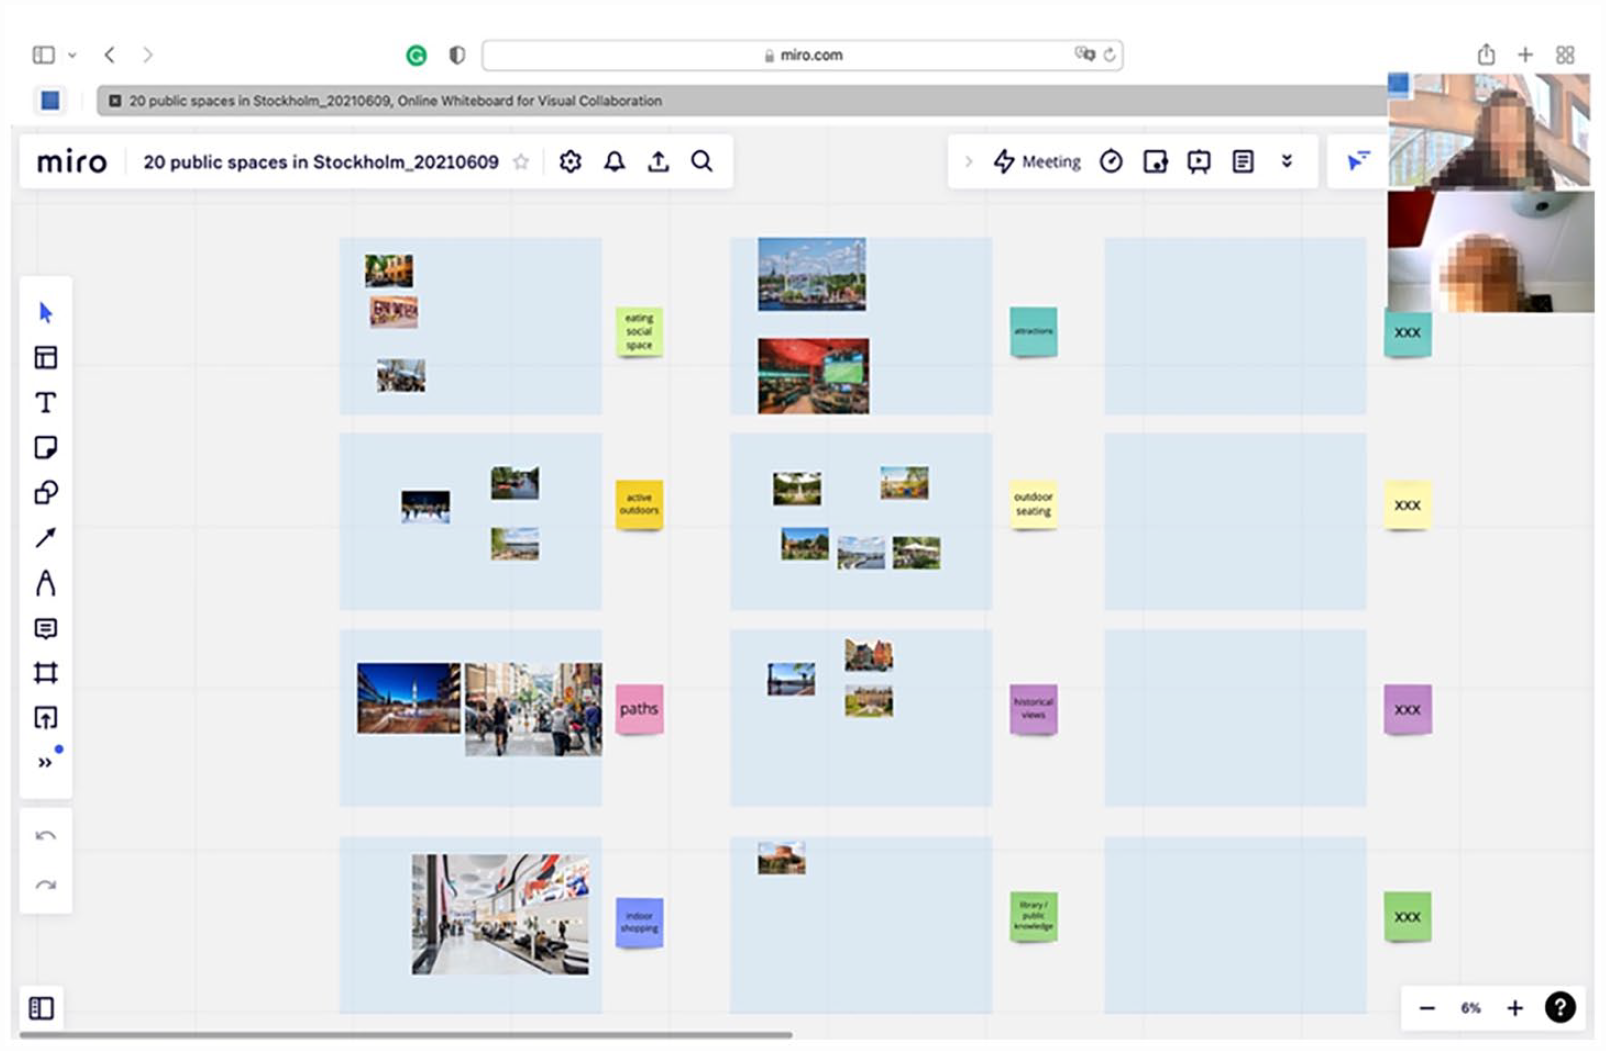
Example A: The participant assigned pictures into groups using pre-defined areas (blue sheets) and gave a descriptor to each group using Miro’s “sticky notes.”
Data transformation: The matrix derived from Example A.
The matrix of the sorting results, 20 places × 20 participants.
Data analysis using Multiple Scalogram Analysis
In order to reveal the structure underlying the responses of the 20 individuals who carried out the sorting of the 20 pictures online, the overall matrix (Table 2) was analyzed using Lingoes (1973) non-metric multivariate statistical procedure Multidimensional Scalogram Analysis (MSA). This is a form of Multi-dimensional Scaling (MDS) (e.g., Garson, 2012 in Peroff et al., 2020; Kruskal and Wish, 1978 in Windsor, 2013; Ward, 1977). It has produced consistent and coherent results in many studies using similar MSTs (e.g. Groat, 1982; Wilson, 1996; Wilson and Mackenzie, 2000). The MSA analysis within the Hebrew University Data Analysis Package (HUDAP 8) was used in the current study. There are other algorithms available for such an analysis, for example, NEW MDSX suite (Morrison and Lehane, 1995), and Nonmetric Multidimensional Scaling Programs. However, the facility provided by HUDAP 8 makes it particularly suitable for the present study. MSA’s innovative analytic techniques is more similar to iterative correspondence analysis and crossover analysis in which “relationships among transformed qualitative data can be mapped into dimensional space using a quantitative approach” (Bazeley, 2018; Kutscher and Howard, 2022; Onwuegbuzie and Hitchcock, 2015).
Results
Integrated mixed methods findings I: The viability of the digital MST procedure
The MSA represents the 20 pictures (places) as points in a two-dimension geometric space. The closer the points are to each other, the more frequently the pictures are assigned to the same category. The spatial configuration, therefore, provides a graphic illustration of the similarities in the conceptualization of the places. This allows an interpretation of the overall framework that is guiding the respondents’ assignment of places to categories. As Table 3 depicts, the qualitative and quantitative data sources are integrated throughout the analysis and interpretation. Taking the MSA point plot and pictures together (Figure 5), emerging identifiable regions and apparent themes shown in the configuration are crucial for testing the effectiveness of the digital MST.
Integration qualitative and quantitative aspects of data sources and data analysis.
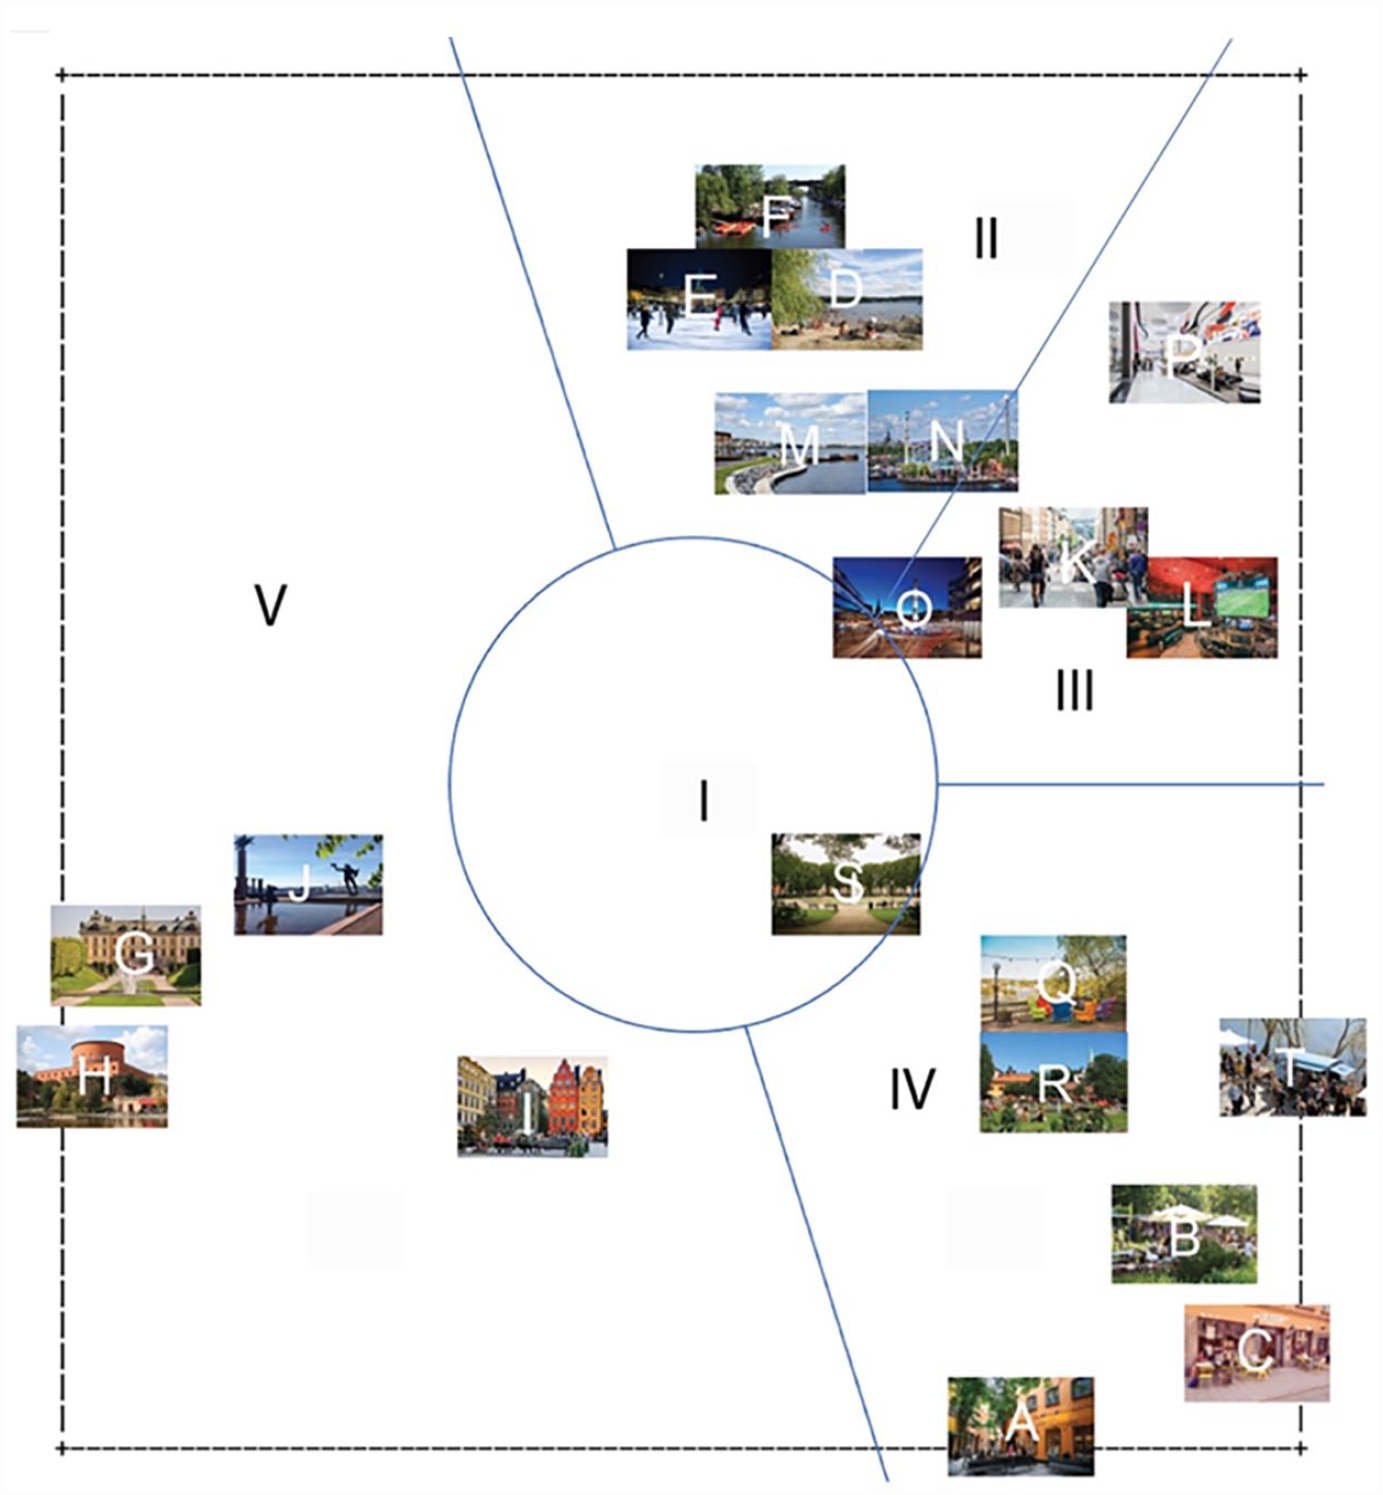
The MSA of the digital MST: The overall structure of 20 participants’ conceptions over 20 public spaces.
Figure 5 illustrates the underlying structure of the digital MST across the 20 participants. Five regions are identifiable: Region I appears in the central plot encompassing picture O & S; Region II (picture F, E, D, M, & N) and Region III (picture P, K, & L) emerge in the upper-right plot; Region IV (picture Q, R, T, B, C, & A) and Region V (picture H, G, J, & I) are shown in the lower-right and lower-left areas respectively. Different themes distinguish the different regions. Region I seems to be transitional open spaces or transportation nodes as picture O & S, on the one hand, commonly share those unique physical characteristics. Picture O & S, on the other hand, are ambiguous because they appear close to the lines drawn between regions. This means that the places in picture O & S may share some characteristics with the relative pictures in Region III and IV. Region II turns to represent places with the presence of water and nature attractive for a variety of physical and social activities. Region III is shown fairly close to Region II portraying the built environment associated with diverse activity options and with somewhat commercial elements. Region IV collects pictures of places with calm and sociable environments, where activities such as meeting friends or relaxation may likely to take place. Finally, Region V distinctively shows a set of pictures with classical or iconic buildings and places. Integrating the additional qualitative data (i.e., the descriptors assigned to the categories by the participants and their verbal elaboration) and the emerging quantitative MSA structure help to further make sense of the overall structure of the participants’ conceptions of the places.
Table 4 showcases the descriptors of five places: picture A, F, H, & L at the four extremes of the MSA plot and picture O toward the center of the plot. Picture A located at the bottom of the configuration is noted as an “outdoor relax” meeting place to “meet,” “hangout,” and/or “eat” together with the presence of others. This is supportive to the theme that emerged in Region IV, which can be labeled as social places. Similarly, picture F located at the top of the configuration is a place with the presence of “open water” or “a view” and for “physical activities,” including “walking” and “sports.” This is in line with Region II’s theme, which turns to be physical activity places. Picture H located to the far left of the plot is shown in Region V, which the theme of historical/cultural significance is obviously observed. Picture H was assigned to “landmark” multiple times, otherwise “historical views,” “cultural heritage,” and “architectural tour” are considered. Interestingly, one participant called it a “nonpurposive place,” showing how its “postcard” significance overshadows for most people that any distinct activities that might be carried out there. Picture L is shown at the far right of the plot within Region III, which turns to represent places with commercial elements. Although various descriptors were assigned to picture L, “commercial,” “nightlife,” and “indoor” were most often used. Picture O, on one hand, due to its location in proximity to Region II and III it shares those descriptors given to picture L and some characteristics specifically “physical activity” assigned to picture F. However, relating to the qualitative input from the data, it helps to refine the region. Picture O and the other nearby picture S, as they share more important characteristics of being “open space” and “transitional space” that pictures in the other regions do not share, they sensibly form Region I.
The descriptors given to picture A, F, H, and L.
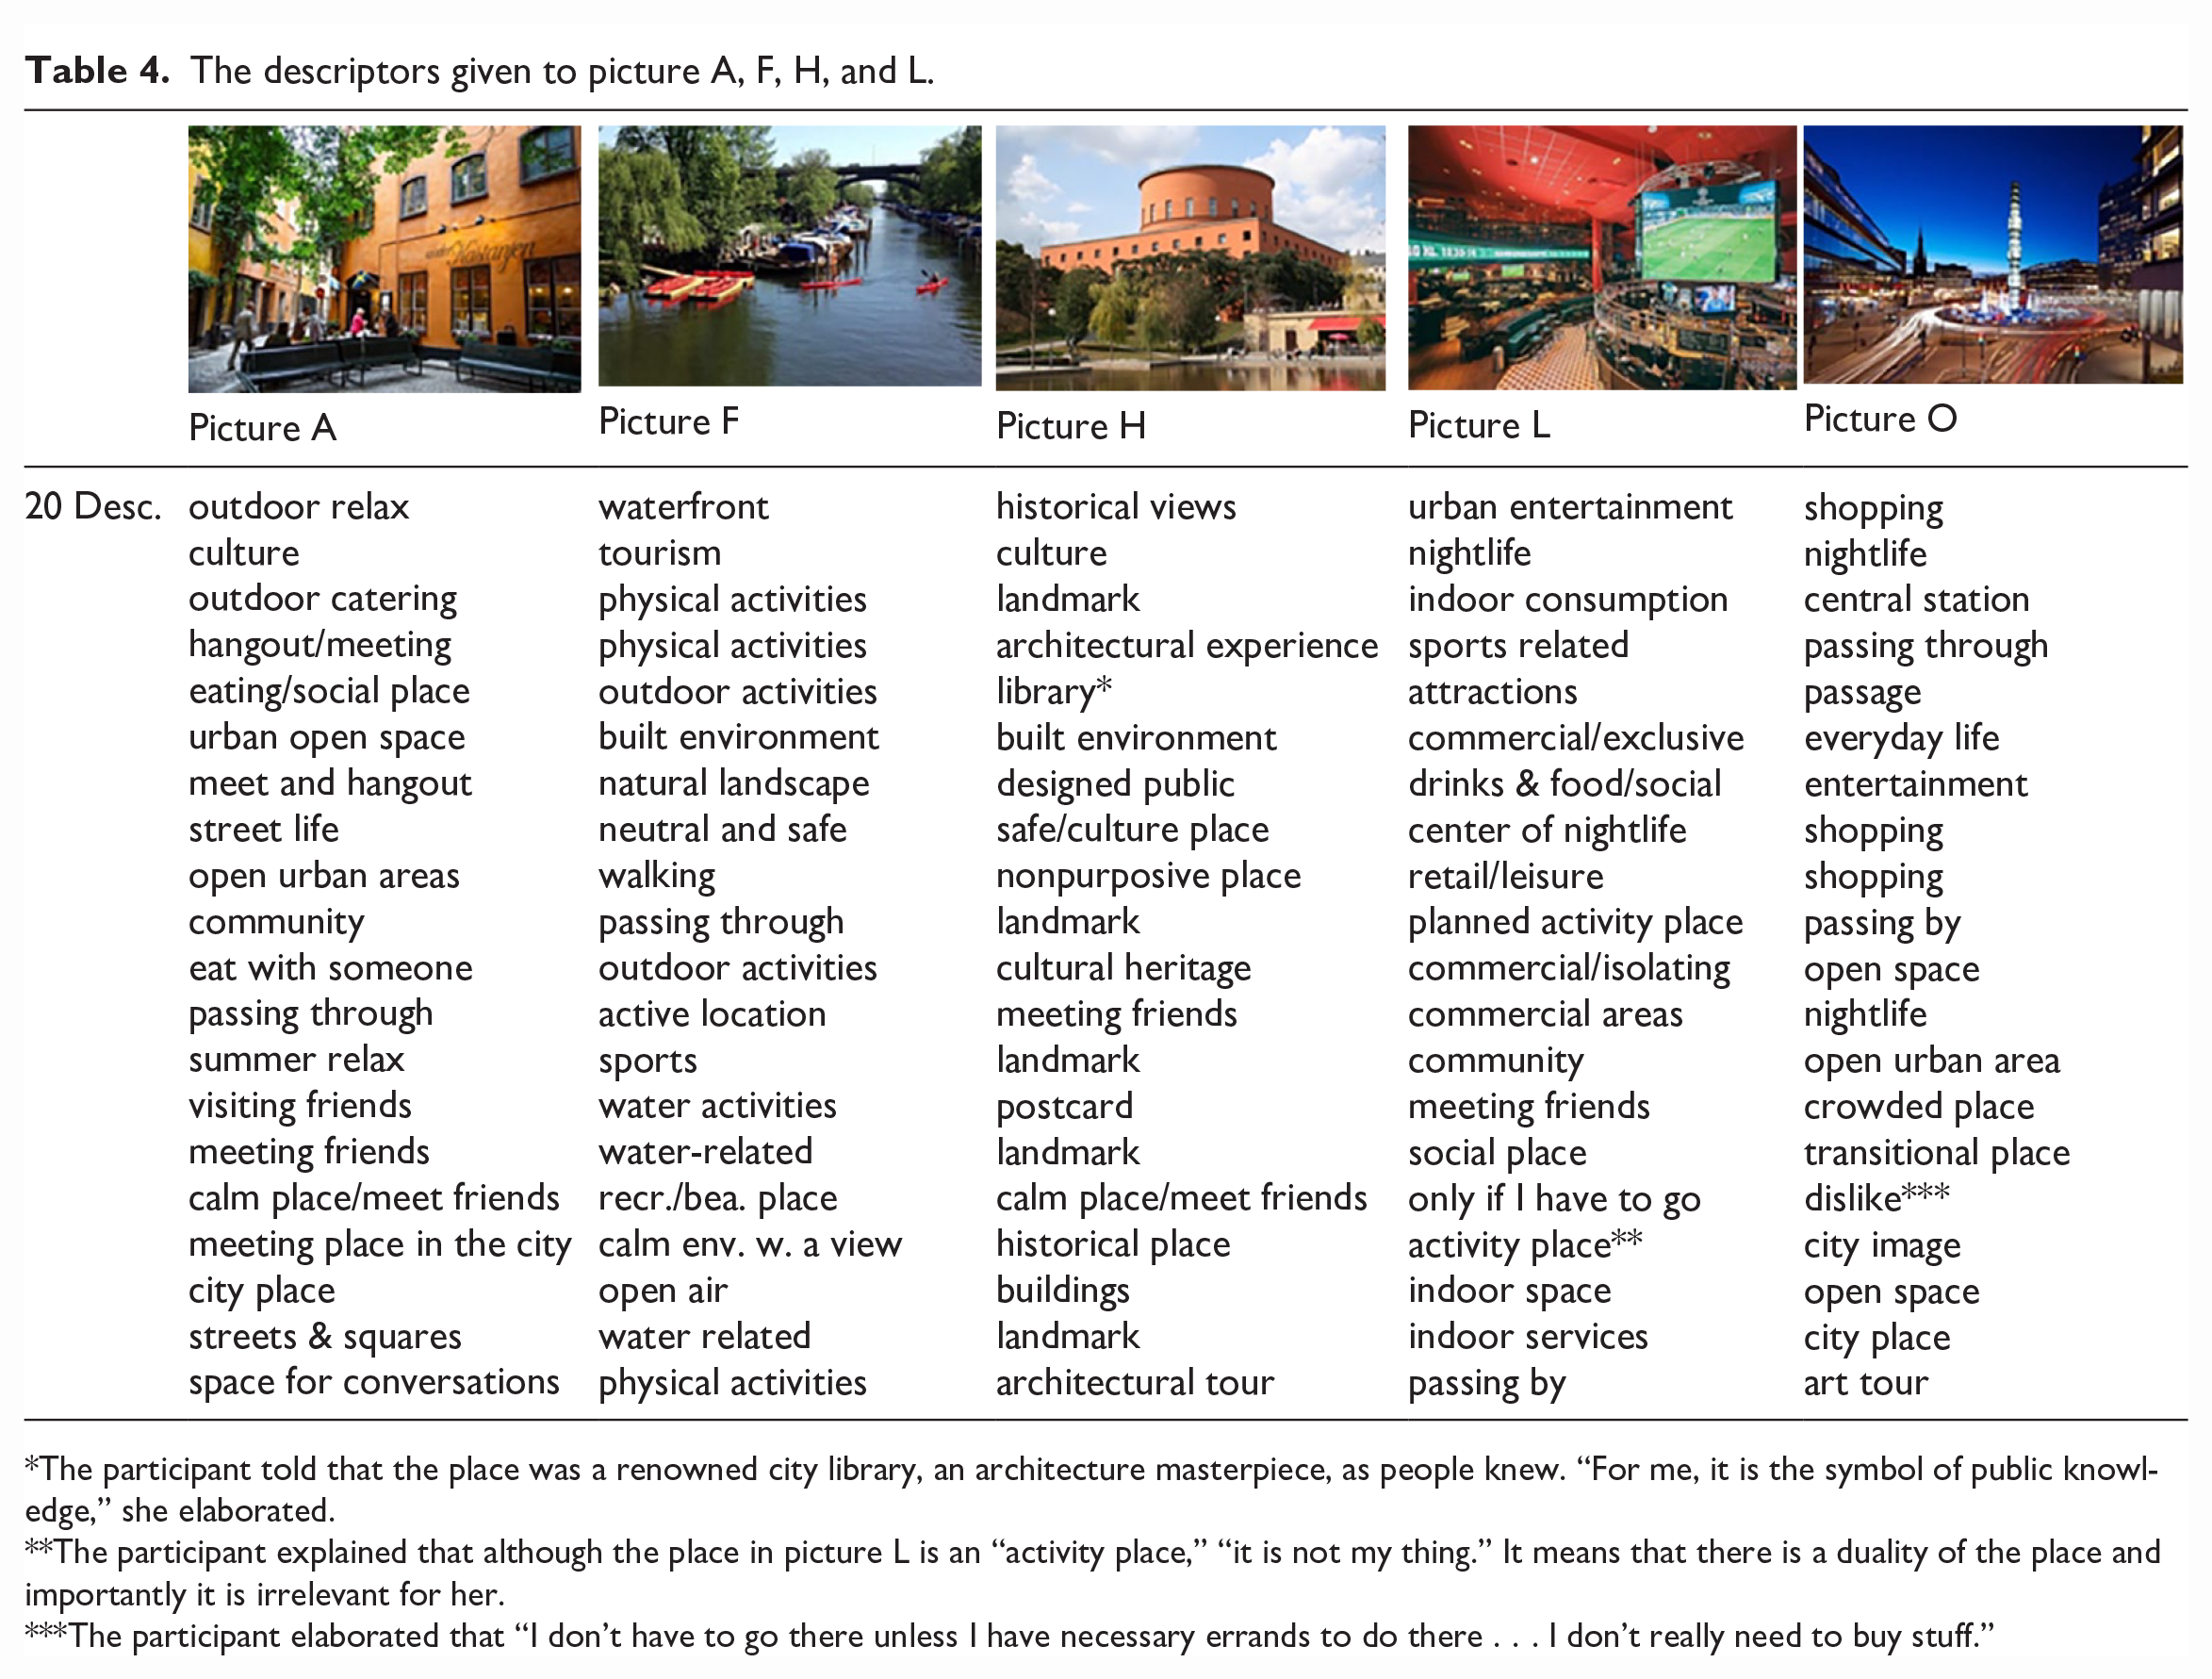


The participant told that the place was a renowned city library, an architecture masterpiece, as people knew. “For me, it is the symbol of public knowledge,” she elaborated.
The participant explained that although the place in picture L is an “activity place,” “it is not my thing.” It means that there is a duality of the place and importantly it is irrelevant for her.
The participant elaborated that “I don’t have to go there unless I have necessary errands to do there . . . I don’t really need to buy stuff.”
Overall, the iterative process of integrating quantitative and qualitative data sources and analytic strands help derive the integrated finding, namely the MSA plot and its regions (categories). The structure shown in the plot and the derived themes of the regions imply the agreement between the participants, the distinctions they recognize between the places and the insights given into the meanings taken on by places. The viability of the digital MST procedure tested is therefore supported by the coherent and sensible MSA result. If the digital MST procedure was not viable, the MSA result would have revealed a configuration that was difficult to interpret.
Integrated mixed methods findings II: Comparison of the MSA of digital MST versus non-digital MST
A comparison between the MSA of digital MST procedure and that of non-digital MST procedure (published) was carried out to examine any differences between these two approaches. For the same set of 20 pictures, the MSA of six adults performing the digital MST procedure was compared to that of a non-digital MST procedure (Jing et al., 2019). Figure 6 visualizes this comparison using the alphabet letters assigned to the pictures in both sorts, through replicating the analytic techniques of MSA and procedures discussed above. It becomes apparent that the two MSAs share a general structure according to the quantitative result shown in the MSA plots. There are four pairs of pictures—A & C; G & H; N & O; and L & P—shown to remain in their relative positions to one another across the two samples. Furthermore, the reasoning behind the categorizations made by the participants between the digital and non-digital MST samples was directly observed through integrating qualitative data, that is, the pictures, the descriptors assigned by the participants and their verbal elaboration of the categorization and the quantitative MSA plot. The integrated mixed-methods result derives the underlying structure of the categorization among the six participants in each sort (Figures 7 and 8).
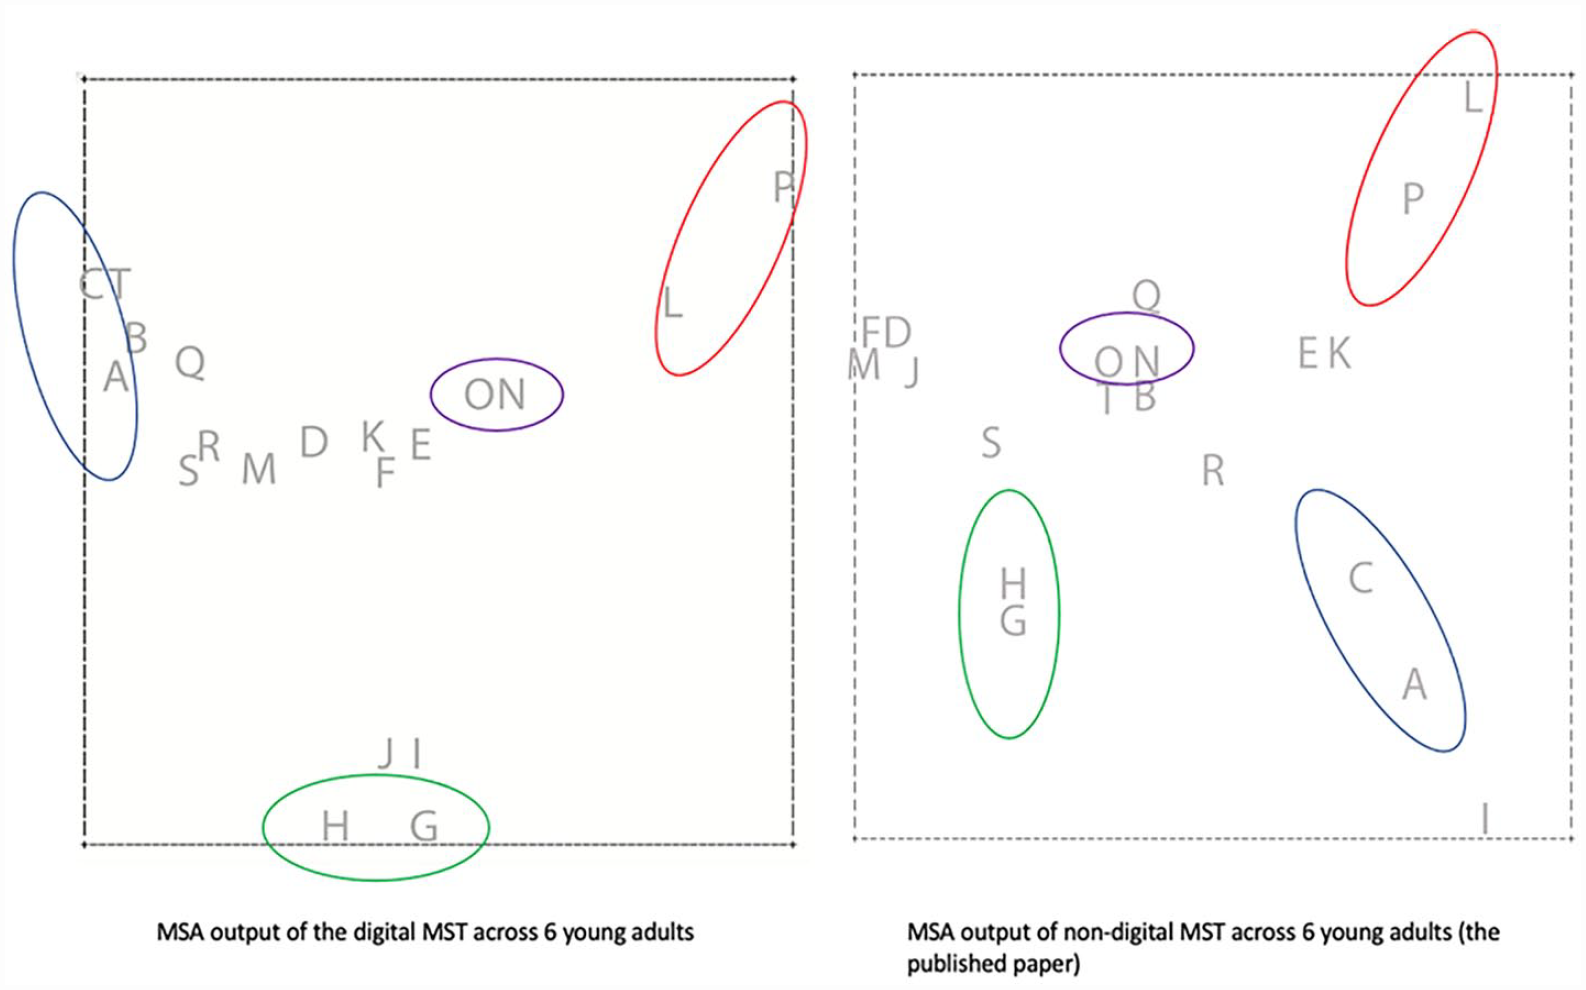
Comparison: The MSA of digital MST versus the MSA of non-digital MST.
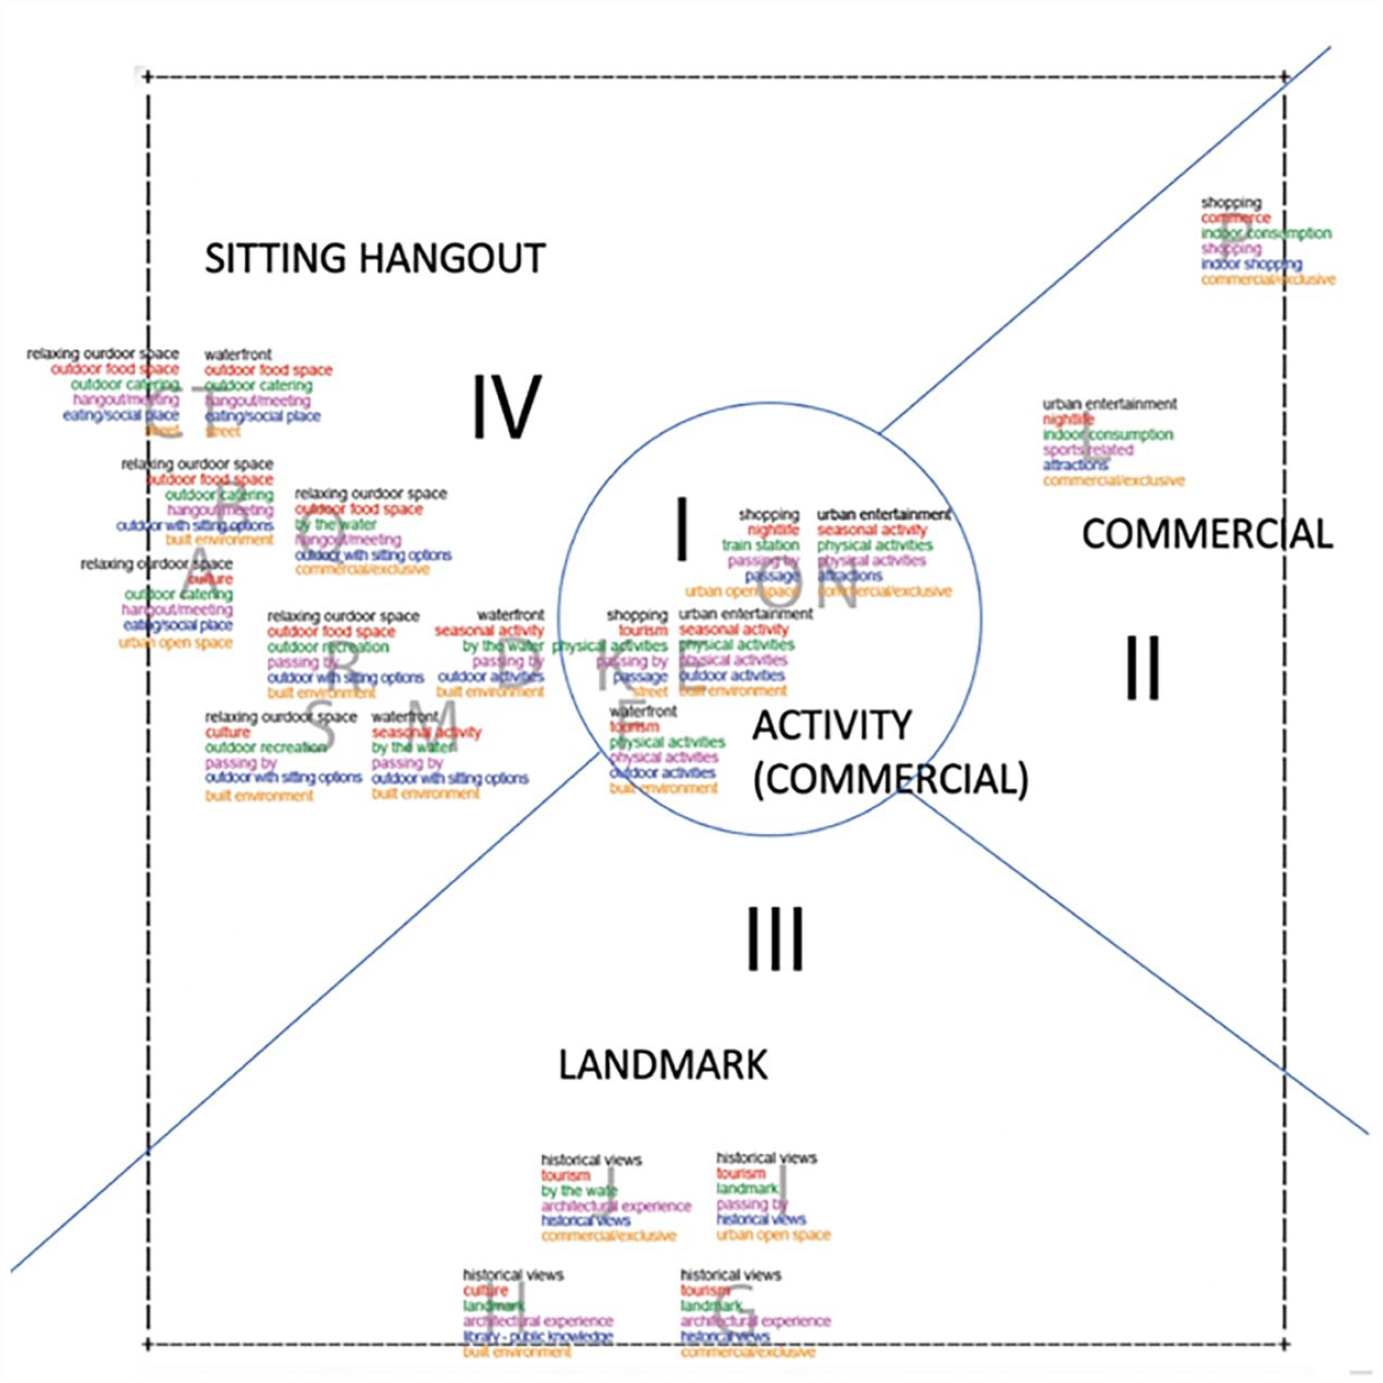
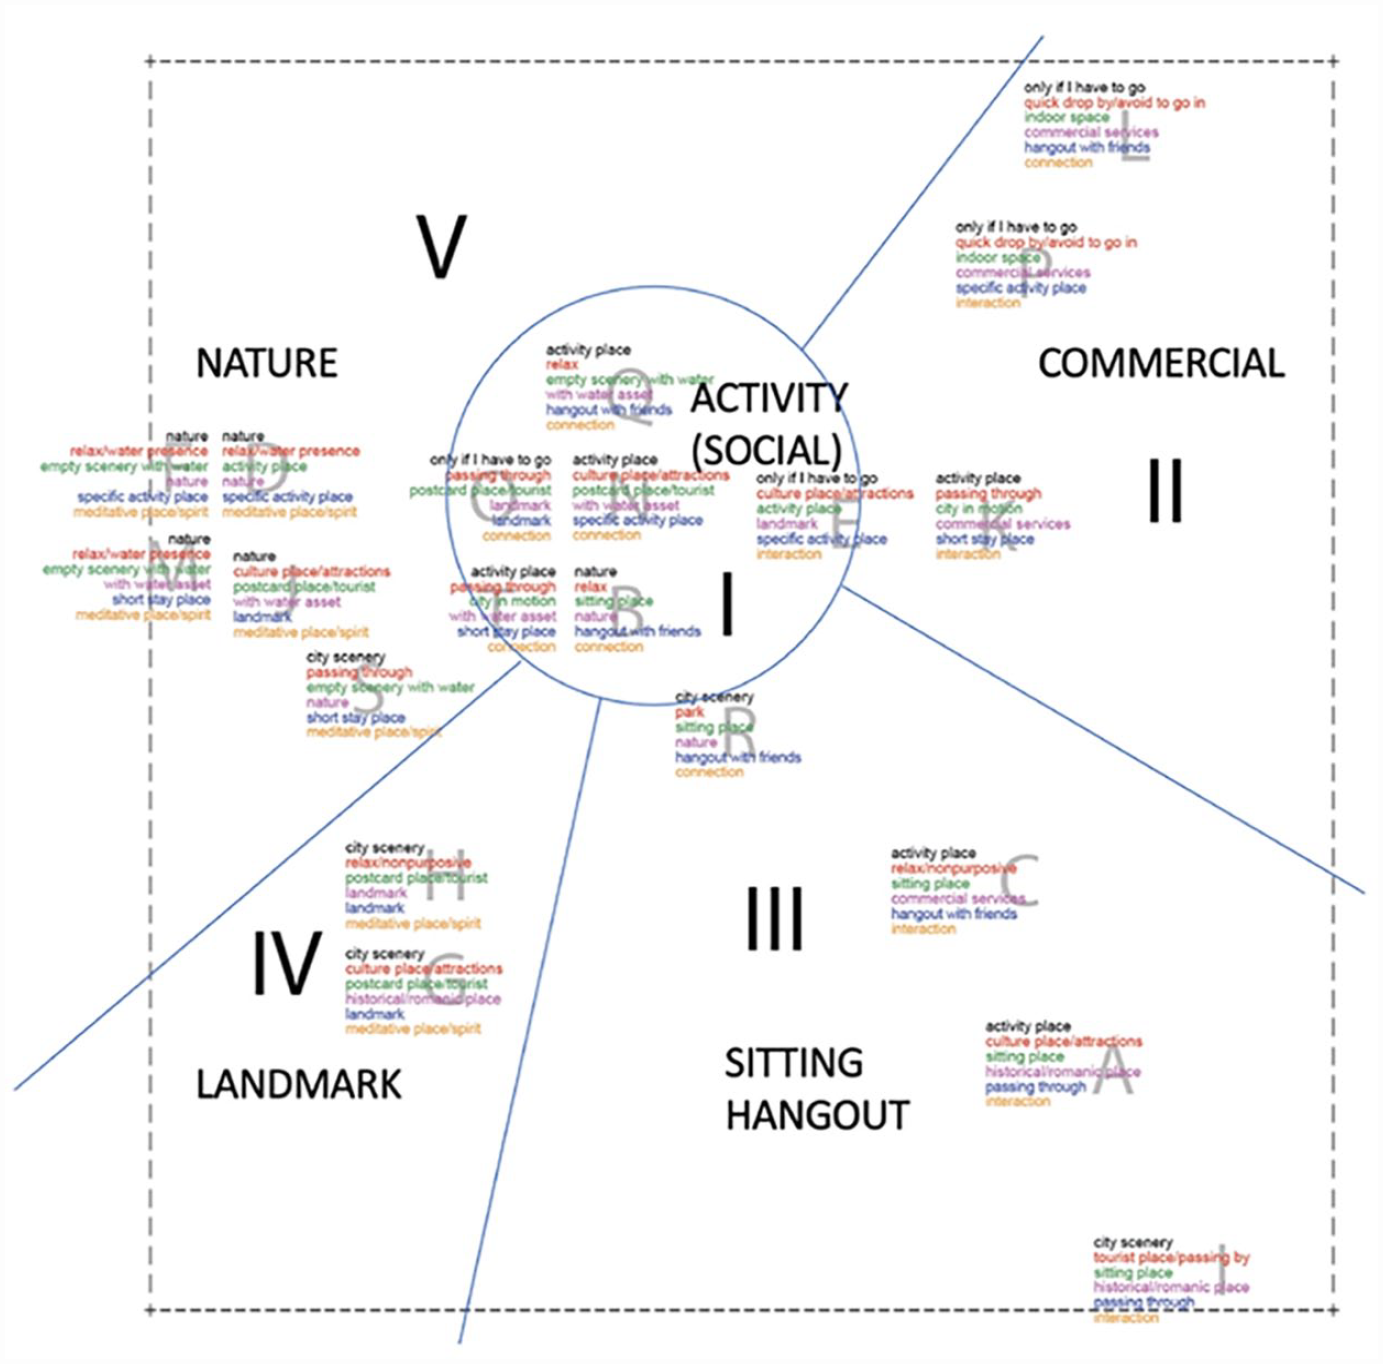
The MSA of digital MST across six young adults, with descriptors.
The MSA of non-digital MST across six young adults, with descriptors (published).
There are four regions shown in the MSA of the digital MST, whereas five regions are shown for the non-digital MST sort. Figure 7 (digital sort) illustrates the overall underlying structure of the conception of places through the distinguished constructs: activities involving a commercial element (Region I), commercial (Region II), landmark (Region III), and sitting hangout (Region IV). Figure 8 (non-digital sort) reveals the overall conception of the places are activities focusing on enriching social connections (Region I), commercial (Region II), sitting hangout (Region III), landmark (Region IV), and nature (Region V). In this comparison between the digital and non-digital MST, the small size of the samples (six participants in each sort) makes it difficult to be strongly positive about the labeling of the regions. The participants may use different words but imply the same meaning. For example, while the descriptors such as “shopping,” “entertainment,” “commercial,” “exclusive,” and “tourism” seem to suggest that the places involve a cost, they may also be interpreted as different activities. Returning to the transcripts of the verbal elaborations is helpful to interpret the subjective meaning of the descriptors.
In sum, although there are interesting similarities between the two sorts, some interesting differences in the way that the participants conceptualize the places are seen. This suggests that the digital MST may be impoverished compared with the non-digital MST. There are regions closer together and less distinct regions in the MSA plot of the digital sort than that of the non-digital sort. It means both that there is more agreement between the participants in the digital sort, but also that they made less refined distinctions.
Discussion
Bringing mixed-methods Multiple Sorting Task (MST) online
The demonstration above showcases the combination of the web-based applications Zoom and Miro as a viable model of the digital MST procedure using pictures. This is an expansion of the widely used mixed-methods MST procedure, different from the Q sorts, which often use pre-determined categories and scaling matrices (Remlo, 2016). The online MST procedure is assisted by existing digital applications that can be freely accessed by research participants, including (1) the researcher setting up pictures for sorting in Miro’s customized board, (2) the researcher and participant both keeping Zoom and Miro on simultaneously, using Zoom as the basis for the virtual face-to-face communication, and using Miro as the medium for the participant to conduct the MST, (3) the participant verbally elaborating his/her categorizations after completing the sorting, (4) the researcher using Zoom and Miro’s built-in functions (e.g., “chat,” “share screen,” “recording”; “sticky notes,” “export the board”) to record and transform the data, and (5) the researcher(s) analyzing the data using integrated quantitative and qualitative analytic technique MSA. This model of digital MST works best as soon as the participants can sufficiently utilize both apps and have access to the internet and PCs.
The convergent study design of this study follows the rationale that the integration of quantitative and qualitative data enhances the value of mixed methods research (Fetters et al., 2013). The MST procedure, namely data collection, data transformation, and data analysis, iteratively integrates quantitative and qualitative aspects in multiple phases. Its integration strategy can be understood through the explanatory bidirectional framework explained by Kutscher and Howard (2022) based on Moseholm and Fetters’s (2017) work, that “an initial quantitatively framed analysis is followed by a qualitatively framed analysis and then the analyses are merged for interpretation.” In this study, almost all participants, young and older age, completed the digital MST using Zoom and Miro except for a few cases used alternative Email and Smartphone to assist older adults to perform the MST online. The integrated mixed-methods finding of the MSA presents a stable and underlying structure of 20 participants’ conception of the given 20 places. The regions identified in the MSA plot and their derived themes best represent the overall categorization of the places and the meanings associated to the categories. The analysis of the comparison of the MSAs between the digital and non-digital MST sorts is coherent and further supports the viability of the digital MST tested. There is a general similarity in the MSAs between the digital sort and the non-digital sort observed. It implies both that the participants are able to utilize the digital MST tested to perform the sorting as much as they do in in-person MST procedures.
Some significant hindrances created by the digital interface of the digital MST using Zoom and Miro are also observed. First, in this study it seems to be easier for the young adults to navigate and maneuver the sorting material in Zoom and Miro during the MST procedure than that of the older age participants. This is observed through the face-to-face real-time communications through Zoom and Miro, that the former group spent less time completing the tasks on average and were also able to assign all the pictures into groups at the designated areas in Miro whereas it took longer time for the older age participants to complete the task and they often sorted the pictures at a random area on Miro’s sorting board. Second, the case that two older participants opted to use Email and Smartphone reveals some key issues (i.e., digital skills that are required for participating in the digital MST procedure using Zoom and Miro) to consider in future digital MST investigations. This experience also corroborates the existing knowledge that retired persons over age 65 can prefer using conventional technologies, such as email and telephone (Gitlow, 2014). It implies that there is a potential for using Email and Smartphone for developing digital MST procedure and more inclusive digital tools should be considered to better enable participants with lower digital literacy to participate in digital research tasks.
Contribution to methodological innovations
The development of the digital MST using Zoom and Miro demonstrated in the present study contributes methodological innovations, built upon the established methodology MST which was previously known as conducted in-person. The study further explicitly elaborated on the mixed methods nature of the Multiple Sorting Task procedure involving pictures for revealing cognitive structure, which has not been framed as a mixed-methods in previous publications on the MST to the best of the authors’ knowledge. The digital aspect of the MST tested in this study essentially adds “hands-on” and interactive online possibilities to the MST. The convergent study design, careful procedures, and the MSA analytic technique used in this study integrate the advances in mixed methods such as visual methodology (Fetters et al., 2013; Peroff et al., 2022), photo elicitation (Fearon, 2019; Kleih et al., 2022; Philip et al., 2021) and sorting (Yeh et al., 2014) for enriching the overall “understanding of the phenomena under analysis” (Onwuegbuzie and Dickinson, 2008 in Alexander et al., 2021). The MST procedure, including its digital version tested, distinguishes from those integrating qualitative and quantitative analyses that are carried out consecutively (Kleih et al., 2022). Instead, the MST emphasizes the iterative integration of qualitative and quantitative aspects throughout the analytic process, similar to correspondence analysis (Kutscher and Howard, 2022). Furthermore, the involvement of older age participants in addition to young adults is indeed a strong test, which reveals the potential of the digital MST and its possible variations in terms of the choices of viable digital tools for research participants with lower digital literacy. In doing so, the study responds to the call for the consideration of age-appropriate sorting methods (Cooper, 2002), adding a valid value to the methodological innovations presented.
Limitations and future studies
There are also some limitations of the study. First, there may be an inherent sample bias as only digital recruitment was used in the present study due to the COVID-19 pandemic. The requirement of participating in the study through PCs may set barriers to reach broader participants, although this was designed to ensure the pictures on the screen are best seen by the participants. This is because seeing the pictures clearly and familiarizing oneself with the places represented in the pictures are fundamental for the MST procedure. Second, a baseline of the digital literacy skills among the participants was not used in the present study, which may affect individuals’ sorting results. This is seen through the observations of individuals’ different uses of Miro’s interface, including their comfort levels of navigating in the app and locating the pictures into groups on the digital whiteboard. Future studies may adopt measures of digital literacy skills to further observe whether it influences individuals’ cognitive processes of sorting compared to non-digital sorting forms. Third, the relatively small sample size in the comparison of the digital and non-digital MST seems to suggest that the digital MST may or may not be impoverished compared to the non-digital MST as the latter has slightly more refined regions identified. Hence, further tests are recommended, for example, by increasing the sample size of both age groups and/or doing a follow-up study using the identified five categories of places and asking participants to assign pictures to each pre-defined category (e.g., Conrad and Tucker, 2019; Schmettow and Sommer, 2016). In doing so, it will help to further understand if different social groups agree with each other on those specific assignments and ultimately the conceptions of the given places. Fourth, the use of Email and Smartphone for the sorting procedures is limited in the present study and therefore requires further testing. It reflects the potential of developing email-sorting, tele-sorting, and/or combined, supportive to age-appropriate sorting methods. Nevertheless, the result shows that the tested digital sorting models may enhance the objectivity of the mixed-methods MST procedure as the participants and the researcher have had face-to-face meetings online instead of in-person, but this needs further investigation through future studies.
Conclusion
The digital MST using Zoom and Miro demonstrated in the present study is an innovative solution, that uses existing digital applications to enable mixed-methods Multiple Sorting Task (MST) procedures to be conducted online. The potential of this novel and viable approach is beneficial for research that is interested in analyzing subjective and contextualized experiences through widely used sorting methods. The tested digital MST is considered an accessible, cost-efficient, easy-to-administrate, and enjoyable activity-based mixed-methods using visual material, contributing to methodological innovations. Further tests and scale-up of the digital MST are recommended. More research is needed to understand whether the digital interface impacts sorting choices, or interpretations of pictures in cases where participants feel less comfortable using the digital applications. Post-exercise surveys may be useful in future studies: asking if the use of digital applications was considered stressful or challenging by participants, and considering possible implications of the digital procedures on the sorting results. This is to support further innovations in research to increase a higher level of inclusiveness of the mixed-methods digital MST procedure.
Footnotes
Acknowledgements
The authors would like to heartfully thank all the research participants and people involved in process of research participants recruitment.
Declaration of conflicting interests
The author(s) declared no potential conflicts of interest with respect to the research, authorship, and/or publication of this article.
Funding
The author(s) disclosed receipt of the following financial support for the research, authorship, and/or publication of this article: The research is part of a doctoral study and is supported by KTH Royal Institute of Technology and the Axel and Margaret Ax:son Johnson Foundation.
Ethical approval
This study applied for ethical approval from the Swedish national research ethics authority (Etikprövningsmyndigheten) and received approval (DNr. 2020-04084). All participants have received the research information in advance and given their consent prior to taking part in the study.