
Abstract
The widespread use of music content analysis tools illustrates the need for diverse evaluation techniques to ensure their accuracy, robustness, reliability, and quality. This is particularly challenging in the case of features which predict musical properties whose values cannot be independently verified. Here we propose a new method for evaluating such tools that does not rely on a-priori knowledge of correct outcomes (i.e., “ground truth”). Instead, it examines many versions of a single composition, comparing predictions of musical properties expected to be relatively stable across recordings (mode, number of note events) to those expected to vary (tempo, timbre). This allows for assessing the efficacy of feature extraction even in situations where correct answers are unknown (or unknowable). As a proof of concept, we applied this approach to 17 commercially available recordings of J. S. Bach's 24 preludes from the Well-Tempered Clavier (Book 1) using three popular music content analysis tools, comparing variation in feature extraction across 17 versions of all 24 preludes (408 data points for each feature extracted). We find significant differences in the variation of mode predictions between tools, as well as more variation for predictions of mode than predictions of the number of note events. This affords a useful way of comparing predictions (whether between features or tools) which is particularly useful in the absence of ground truth. Other potential applications include parameter optimization, algorithm selection, and benchmarking procedures.
Music Information Retrieval (MIR) is a rapidly growing field focused on extracting, analyzing, and organizing meaningful information from musical representations. MIR tools offer the ability to extract a wide range of features—which we define broadly as “any information extracted by a music content analysis tool”. Some extract features from symbolic formats such as Musical Instrument Digital Interface (MIDI), for example, Humdrum (Huron, 2002) and Music21 (Cuthbert & Ariza, 2010). Other tools extract features from audio files, for example, MIRtoolbox (Lartillot & Toiviainen, 2007), Essentia (Bogdanov et al., 2013a), Librosa (McFee et al., 2015), jAudio (McEnnis et al., 2005), and Timbre Toolbox (Peeters et al., 2011). Here we focus on the latter as they are more widely available, capture a broader range of music, and preserve more information (for instance, spectral information and greater temporal resolution).
Extracted features are useful in tasks ranging from classification and organization to prediction. Here, our focus is specifically on the use of MIR features (information extracted by music content analysis tools) to predict musical properties (perceived or observed characteristics of music). For example, the root mean square amplitude (an extracted feature) is often taken as a prediction of loudness (a musical or auditory property). Predictions of higher-level properties, such as tonality and meter, are of particular interest to music researchers who wish to analyze large bodies of music or experimental stimuli in an automated fashion, expediting an otherwise time-consuming and costly process.
Evaluation: Current Approaches
Given the rapid pace of development of MIR tools, evaluation and validation is crucial (Cunningham et al., 2012; Urbano et al., 2013; Eerola et al., in review). Testing procedures, or experiments, are designed to ensure that MIR features have sufficient construct validity; that is, that they truly represent the concepts and properties they are designed to quantify (Cronbach & Meehl, 1955). To that end, features are typically evaluated during development using a statistical measure of accuracy. Although sensible, evaluations based upon accuracy are limited by their need for a ground truth (an outcome or true value to be modeled). For example, within MIR, accuracy assessments typically compare extracted features against acoustic qualities known a-priori (e.g., recognizing a clarinet vs. trumpet), or perceptual data treated as a ground truth (i.e., ratings of loudness, pitch, etc.).
Ground Truth: Affordances and Challenges
One example of accuracy-based assessments relying upon a ground truth can be seen in a community-organized initiative: the Music Information Retrieval Evaluation eXchange (MIREX) (Downie, 2008; Raś et al., 2010). The community defines the features or specific tasks to be evaluated, appropriate ground-truth data sets, metrics for evaluation, and technical details related to computation, format, etc. Participants enter algorithms (that is, specific feature extraction procedures) suited to these tasks for evaluation. The results, generally the accuracy of each algorithm, are made publicly available on the MIREX wiki. This approach encourages novel solutions to specific tasks. As MIREX grows, so too has the literature around improving evaluation frameworks: lessons learned from years of MIREX have resulted in calls for improved accessibility and discovery of musical collections and datasets (Urbano et al. 2013), and strategies to facilitate greater collaboration in the evaluation of tools (Cunningham et al., 2012).
Beyond MIREX, independent evaluations of existing music content analysis tools are useful in testing specific hypotheses, as well as allowing newcomers to orient themselves and select suitable tools for their objectives. For example, one such assessment tested three pitch-based features in MIRtoolbox using six second monophonic audio files from a variety of instruments (Kumar et al., 2015). They found better performance for string instruments than brass, as well as worse performance extracting the fundamental frequency for lower pitched music (however, it is unclear if these stimuli are representative of naturalistic musical performances).
One major barrier to any accuracy-based assessment is the assemblage of a reliable ground truth. The necessity of an accurate ground truth means researchers must either (1) use simplistic stimuli for which the ground truth is evident (e.g., Kumar et al., 2015), or (2) undertake the costly and time-consuming task of labeling and annotating a corpus of realistic material (e.g., approaches used in MIREX). This problem is widely recognized and is often cited as one of the main barriers to more substantial evaluations (Downie, 2008; Gómez, 2006).
When reviewing the literature on accuracy-based MIR assessments, three general approaches emerge: (1) synthesizing audio (from MIDI or other formats) entails controlled transformation of parameters such as tempo, pitch distribution, timbre, dynamics, and audio features which offer labeled data suitable for training and evaluation (Cataltepe et al., 2007; Hu & Dannenberg, 2005; Raffel & Ellis, 2015); (2) using structural musical properties/labels specified by the composer or editor such as title-specified keys, key signatures, tempo markings, etc. as a source of ground truth (at least in the case of symbolically notated musical traditions such as western classical music); (3) obtaining human participant ratings or physiological data relating to musical properties.
Although each approach has its own advantages and use cases, assembling a ground-truth dataset in any form presents a number of challenges. In most cases, ground-truth datasets are limited in scope, focusing on a particular style, musical period, or idiom. Further, synthesizing and manipulating MIDI files requires some form of quality control; utilizing structural properties requires relying on information from symbolic notation which may reflect external factors; and experiments can be costly and require explicit understanding of the task from participants, which can be challenging for complex properties.
Putting aside challenges with obtaining ground-truth data, accuracy-based metrics can be misleading as they do not evaluate whether predictions are grounded in the right reasons/processes. In other words, algorithms may achieve a high degree of predictive power within a particular set of data by noticing patterns correlated with the target metric in spurious ways which do not scale (Sturm, 2016). These limitations highlight a difficulty in the evaluation of MIR features: they assume that the available ground truth is sufficiently representative of a musical property.
Existing Approaches to Evaluation Without Ground Truth
Given previously mentioned challenges with ground-truth data, other markers of quality are desirable for advancing the field. Indeed, a large portion of the MIR evaluation literature suggests that metrics of validity, reliability, generalizability, and robustness are needed to determine the quality of extracted features (Cunningham et al., 2012; Downie, 2008; Sturm, 2014; Urbano et al., 2013). For instance, evaluating the robustness of a feature is crucial for any MIR feature but need not rely on accuracy assessments or ground truth.
One approach to evaluation without a ground truth is illustrated by Urbano et al. (2014), who assess the effects of audio quality by testing the effect of sample rate, bit rate, codec, and frame size on the robustness of chroma features and Mel-frequency cepstral coefficients (MFCCs). Across 400 audio files and two notable tools, they show both features are generally robust to audio quality. Another approach involves modification of audio files, such as Mauch and Ewert (2013) assessing the robustness of tools to intentionally degraded audio files using a MATLAB toolbox, revealing that some chord-detection tools are more robust to high-pass filtering than others.
While it does not address evaluation per se, data augmentation (the generation of additional samples of data for training algorithms via transformations) is a technique for improving predictions by generating transformations which should be irrelevant with respect to a particular prediction (for instance, rotating or cropping an image used to train an edge detection algorithm to expand the number of examples included in a training database of images). This technique is often used to prevent over-fitting and to generally improve model performance (Wong et al., 2016). The widespread use of data augmentation in the machine learning literature is indicative that the development of high-quality prediction tools can benefit from techniques which specifically focus on improving robustness, generalization, and reducing bias.
Moving outside the realm of computation, Kahneman et al. (2021) propose a number of techniques for improving human judgments that do not rely on assessing accuracy, but rather upon reducing noise (undesirable variation). Their focus is on singular judgments lacking objectively verifiable outcomes (e.g., whether the decision to declare war led to better outcomes than remaining neutral). Here we extend this principle of evaluation in the absence of objectively verifiable outcomes to evaluate predictions of musical properties for which ground truth is unknown (and in some cases may not exist). Specifically, we do so by examining predictions of structural musical properties which we would not expect to differ meaningfully across different versions.
Evaluation: A New Approach Without Ground Truth
We propose a new method for evaluating the validity of MIR algorithms that does not require a ground truth. Instead of accuracy, our method assesses precision (which we define here as the inverse of statistical variability of measurements). Specifically, our method evaluates precision by analyzing multiple versions (i.e., published recordings) of the same composition. By applying a-priori knowledge about the degree to which musical properties should vary between versions, we can determine if an extracted feature is susceptible to variation from factors unrelated to the musical property it is intended to predict.
As the term “precision” is used differently in different fields, before going further it is useful to clarify our definition with a shooting range metaphor used repeatedly by Kahneman et al. to distinguish between accuracy and precision in their book Noise (2021). Imagine four teams of shooters, with team members all using seemingly-identical rifles: Team A's shots are both precise and accurate, clustering tightly around the bullseye of a target; Team B's shots, although precise, are all systematically off-target; Team C's shots, although centered on the bullseye on average, are widely scattered, or imprecise; and Team D combines both problems, being both inaccurate and imprecise (Figure 1, left panel). Traditional evaluations of accuracy (evaluating the distance of each shot from the target's center) yield similar scores for Team B and Team C. However, there are two reasons why differences in their performance are important even if they are identical in their average distance from the bullseye.
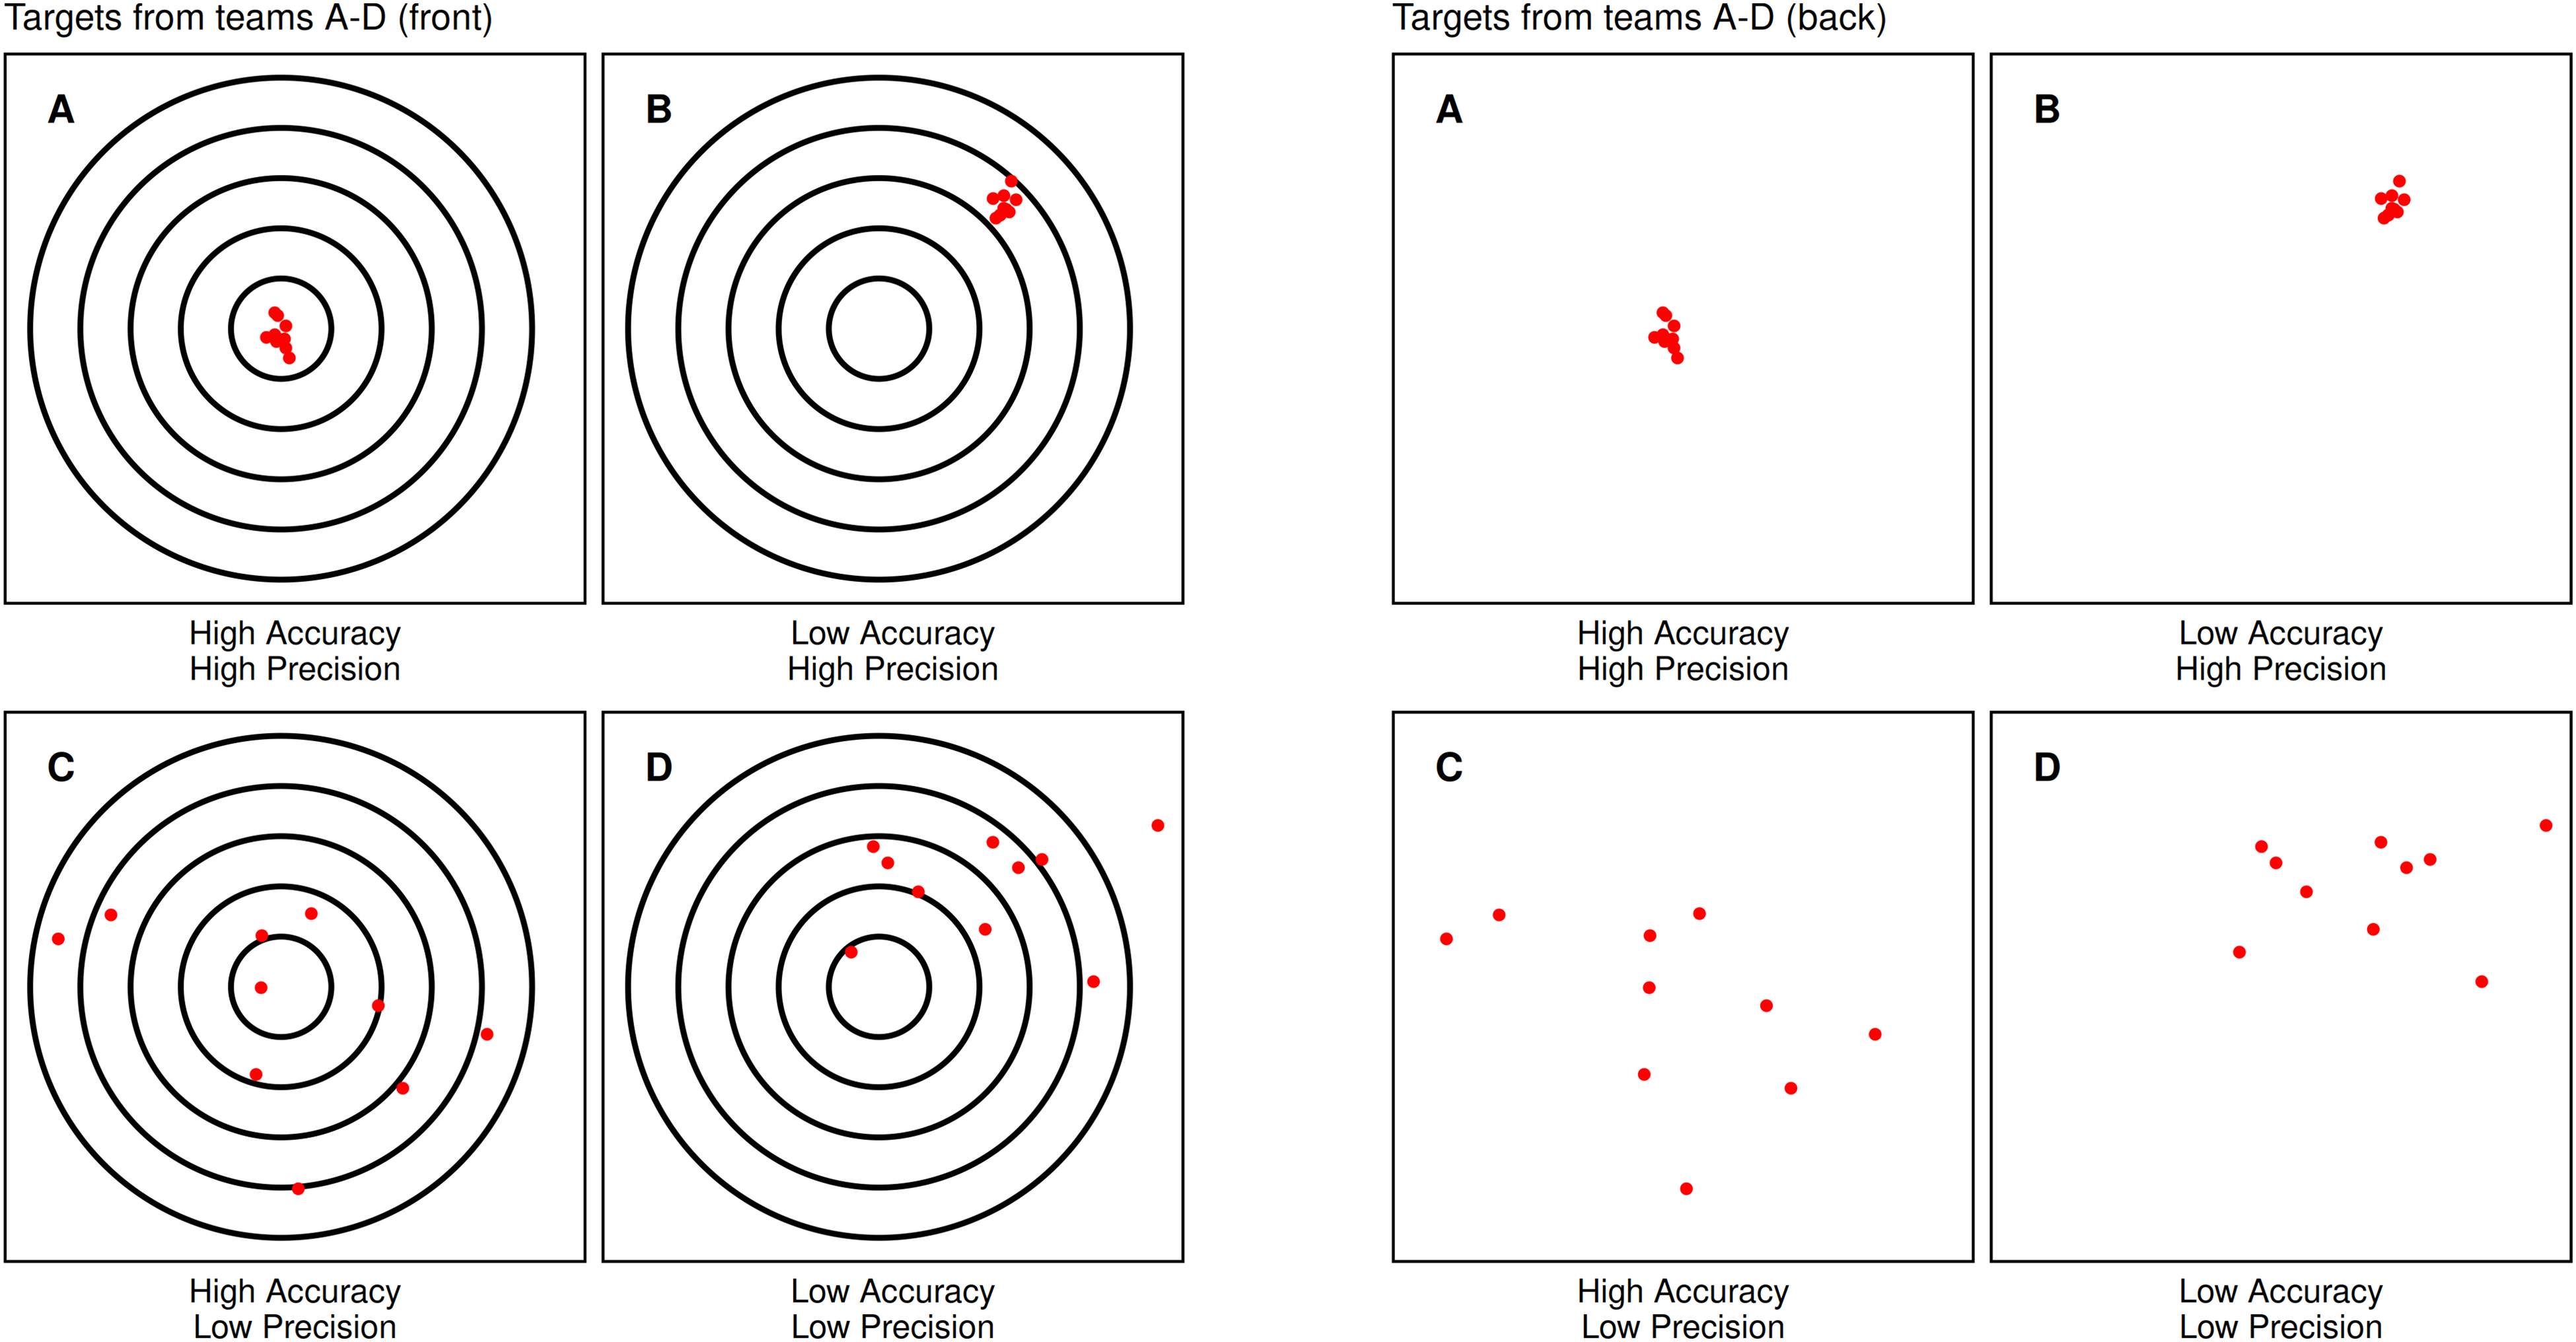
Targets for teams A–D. Each team differs in their precision and accuracy. The first set of panels shows the front of the targets, where the bullseye is visible. The second set of panels shows the back of the target, where the bullseye is no longer visible, making accuracy impossible to evaluate.
The first reason for distinguishing between the performance of Team B and Team C is that different patterns of errors can reflect different underlying causes (e.g., the scopes used by Team B might be flawed; the barrels of rifles used by Team C may be dirty). This suggests different solutions (new scopes for Team B, better cleaning for Team C). The second reason for distinguishing between Team B and Team C is that the pattern of errors exhibited by Team C is detectable even when viewing targets from the back (Figure 1, right panel). In other words, detection of their errors does not require knowing where they were aiming (e.g., does not require a ground truth). This insight is crucial when considering how to best detect errors in contexts where a ground truth is either difficult or impossible to obtain.
Evaluating Precision Using Multiple Recordings of a Composition
Although in principle evaluations of precision as we have defined it here could be applied with many styles, instruments, and genres, here we focus on one particularly well-suited for this task: widely recorded classical keyboard repertoire. Because works in this tradition are generally transmitted by symbolic notation, some musical properties should vary less across performances (e.g., mode, note events). However, other properties should vary more (i.e., tempo, timbre). To that end, we can think of musical properties on a continuum of predicted variability (Figure 2). Note that our discussion of the desirability of precision applies only to musical properties expected, a priori, to vary little (analyses of properties expected to vary more significantly are included solely to provide context).
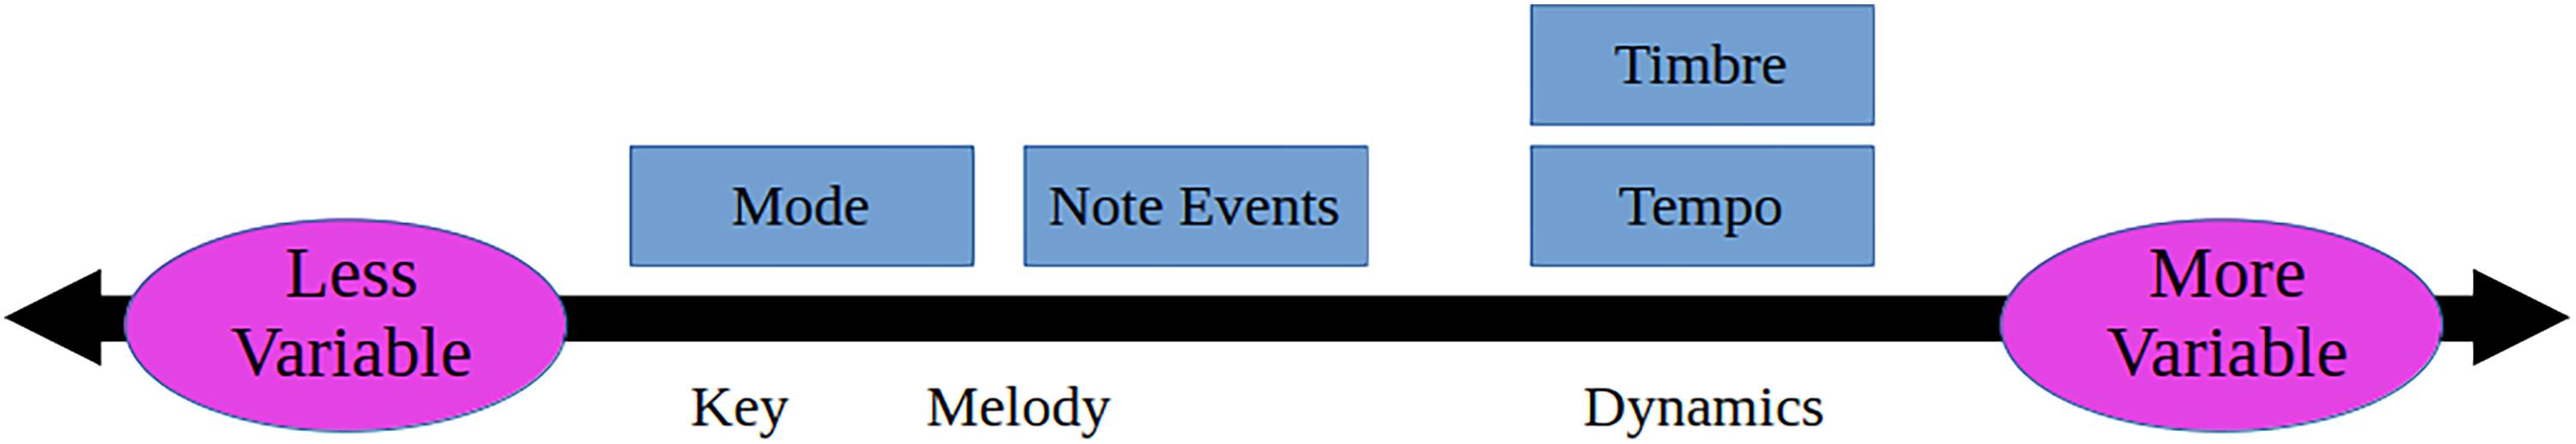
A proposed continuum of variability for musical properties examined in this paper. We expect that properties further to the left should vary less between versions of classical piano preludes, while properties further to the right should vary more. Musical properties examined here are in blue boxes above the line. We include three additional properties not examined here as an additional point of reference.
Mode
Mode is a key aspect of western musical structure, playing a crucial role in conveying musical emotion (Crowder, 1984; Gagnon & Peretz, 2003). Generally defined by the order, distribution, and set of pitches, mode is a structural musical property that should not vary meaningfully between versions. While the exact distribution of pitch in different versions of the same piece of music may differ due to expressive timing, articulation and dynamics, in principle the broader pattern of pitch remains largely the same throughout and should not meaningfully alter the musical property of mode. Therefore, the interpretation of a classical keyboard performance should not change the musical property of mode.
Note Events
A note event—a single note or several simultaneous notes (i.e., a chord)—forms the basis of all rhythmic musical properties. Examining the number of note events in a piece of music is particularly useful for our purposes since although the length of versions may vary as a function of tempo, the total number of note events generally should not. However, two issues of interpretation complicate this discussion.
The first challenge of comparing note events across versions is that of ornamentation (a common baroque-era practice in which performers add unique elaborations at prescribed moments). For obvious reasons, the speed of elaborations such as trills and tremolos may lead to differences in the number of onsets in a prelude. The second challenge is that multiple notes articulated simultaneously (e.g., a chord) may occur at slightly different times, further complicating the counting of note events.
Given the technical nature of temporal resolution in algorithms in comparison to human perception of a musical property, we are signposting this issue here, and will return to it more fully later. Therefore, for now we note merely that for purposes of comparing variability across versions, we expect the number of note events to be more variable across versions than mode, but still less variable than tempo and timbre.
Timbre
Timbre is often described as the character of a sound, distinct from factors like pitch and loudness. As this property is widely recognized to be driven by the instrument, acoustics, and recording technology, we expect it to vary more meaningfully than onsets and mode across versions.
Tempo
Often measured in Beats per Minute (BPM), tempo is the speed or pace of a piece of music, which is useful for genre and style classification (Tzanetakis & Cook, 2002), emotional appraisal (Eerola et al., 2013), comparison of performance interpretations (Bach & Palmer, 2004) and many other tasks. Although classical sheet music often indicates a suggested tempo marking, actual tempi can vary considerably between performers—particularly in cases where the composer did not originally specify them (Poon & Schutz, 2015). For example, Palmer's analysis of the WTC reviews 13 performances and finds significant variation across performances of individual pieces (Bach & Palmer, 2004). We therefore expect tempo to vary appreciably more than onsets and mode between versions.
Analyzing Variation
Although recognition of invariant musical properties has been addressed in cover song identification (see Zheng et al., 2023 for a review), we are not aware of any attempts to assess the precision of musical property predictions over several versions. However, we see here a parallel to the significant work done on examining the variability of decision making as a metric of quality, which is particularly useful in contexts lacking objectively correct answers (Kahneman et al., 2021). As such, here we apply the principle of examining precision (as opposed to accuracy) in MIR tasks.
Given the numerous ways terminology around statistical variability is used across disciplines, we will first take a moment to clarify our terminology. Throughout our manuscript, we distinguish variation (i.e., “the set of observed differences” when applying the same algorithm to multiple recordings of the same work) from variability (i.e., the tendency of a system to generate expected and unexpected differences) (Hallgrímsson & Hall, 2005). Henceforth, we use the term “variability” to refer to differences between versions for musical properties (for instance, we expect the musical property of mode to have less variability than tempo). Additionally, we use the term “precision” to refer to algorithms (for instance, predictions of mode by Tool A are less precise than Tool B). Finally, we use the term “variation” in reference to the specific predictions we observe here (for instance, predictions of mode for Bach's C Major Prelude by Tool A have a standard deviation of 0.05).
As a proof of concept, we analyzed piano preludes from J. S. Bach's “The Well-Tempered Clavier Book 1” (WTC). As a musically and historically significant work, many renowned artists have recorded the WTC, resulting in a broad sample. Further, Bach's keyboard works are the subject of significant study in MIR (Chen & Su, 2021; Gotham et al., 2023), music cognition (Battcock & Schutz, 2019, 2021, 2022), and computational musicology (Lieck et al., 2020; Schmuckler & Tomovski, 2005; Temperley, 1999). Additionally, his compositions are frequently used in the context of music education (Morgan and O'Neill, 2023).
Methods
Stimuli
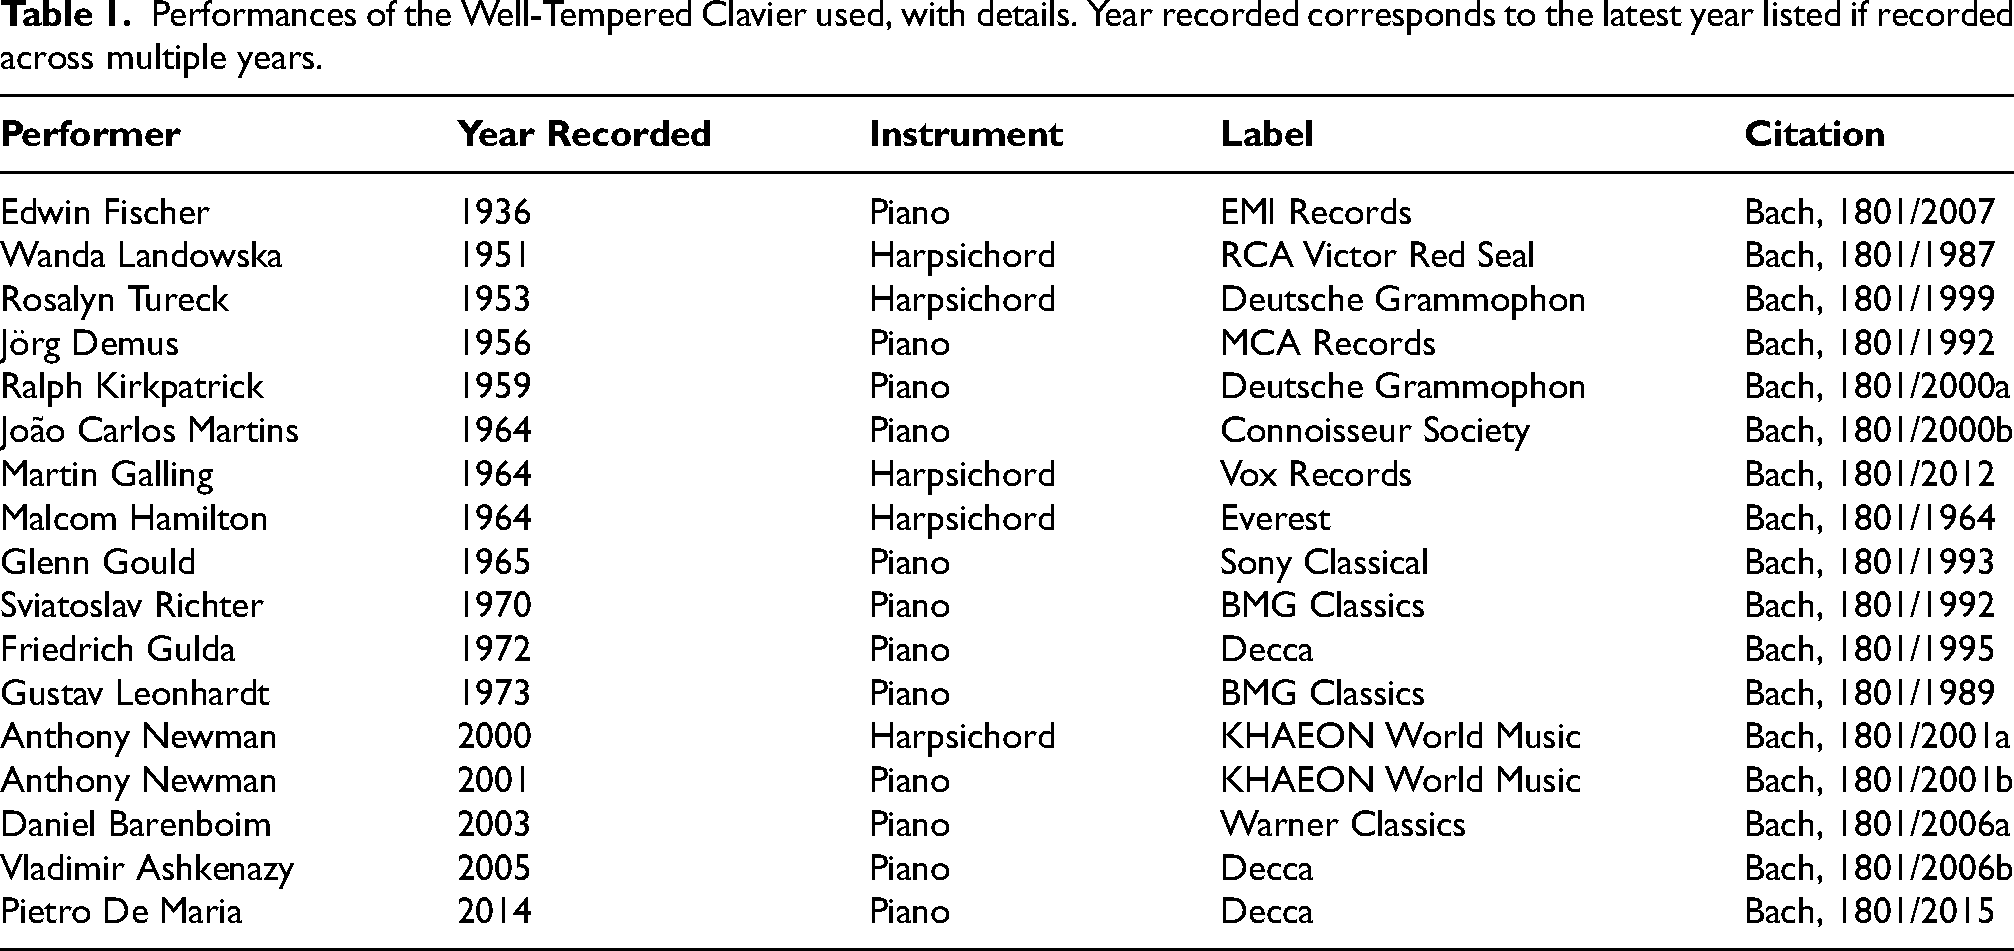
To assess the precision of features we analyzed 17 albums, each containing all 24 preludes from J.S. Bach's WTC Book 1 (408 files). We used audio encoded in the Waveform Audio File format (.wav) at a sampling rate of 44100 Hz with 16 bit-depth. Each file contains the first eight measures as outlined in Battcock and Schutz (2019); however, without the subsequent two second fade-out used in that study. Sixteen notable performers recorded these albums between 1936 and 2014: 11 on piano and 6 on harpsichord (Table 1). More details on our selection of these specific albums is available in supplementary materials.
Performances of the Well-Tempered Clavier used, with details. Year recorded corresponds to the latest year listed if recorded across multiple years.
Music Content Analysis Tools
We conducted feature extraction using three music content analysis tools: Essentia 2.1 beta5 (Bogdanov et al., 2013b), MIRtoolbox 1.8.1 (Lartillot et al., 2008; Lartillot & Toiviainen, 2007), and Librosa 0.10.1 (McFee et al., 2015). We selected these tools in part due to their prominence in the music information retrieval, music cognition, and empirical musicology literature (at the time of writing, Google Scholar lists ∼3900 citations for Librosa, ∼2000 for MIRtoolbox, and ∼900 for Essentia). Each of the three tools are built using different programming approaches, making them more suitable depending on the end-users’ goals and experience with scripting languages: Librosa is a Python package, Essentia is a C++ library with an extensive Python Application Programming Interface (API), and MIRtoolbox is implemented within MATLAB. To streamline our procedure, we performed all analyses in Python, using the MATLAB Engine API in the case of MIRtoolbox.
Extracted Features
For all analyses we used default or recommended settings to simulate “out-of-the-box” usage common in the field of music perception and cognition research. Although parameter optimization for specific tasks might increase the figure of merit (any metric used to evaluate quality) of a feature, our focus here is on developing a generalized approach for assessing precision—rather than applying it to a specific task (see further discussion of parameter optimization below). To facilitate quantifiable comparisons, we selected features producing a single numeric value for the audio file (which in our case consisted of the first eight measures of each prelude). Although future expansions of this approach might use sliding windows to explore precision in a more fine-grained manner, the time synchronization required for that approach would complicate our goal in this article—introducing a new framework for evaluating precision. Moreover, such global analyses are frequently used in music emotion retrieval research (Eerola et al. in review) as well as commercial applications of MIR recommendation systems (Ellis et al., 2010). Details of the specific extractors used are available in a provided GitHub repository (https://github.com/konradswierczek/variation-between-versions).
Mode
MIRtoolbox extracts mode from audio files using a version of the Krumhansl–Schmuckler key-finding algorithm (Krumhansl, 2001) with additional adaptations from Gómez (2006). This relative mode algorithm returns a value theoretically ranging between −1 (minor) and 1 (major)—the modes most common in western tonal music. The original underlying key-finding algorithm relies on the pitch class distribution (PCD) derived from musical scores or other symbolic notation. Subsequent adaptations applying the original principles to digital audio instead use pitch class profiles–often referred to as chroma features, a chromagram, or harmonic pitch class profile (HPCP). This algorithm by default returns a single value for the entire audio file, evaluating the overall relative mode based on a single pitch class profile (although the unfolding of time can be represented with frame-decomposition of the pitch class profile: see Eerola & Schutz, in press).
Of the three tools considered (Librosa, Essentia, MIRtoolbox), the latter is the only one with an implementation of the relative mode extraction algorithm (`mirmode`). However, as all three can extract the requisite pitch class profiles, we wrote a standalone Python version of the mirmode algorithm, allowing assessment of each of the three tools. We extracted mirmode values using both MIRtoolbox and our standalone version using MIRtoolbox's mirchromagram for pitch class profiles. The values are identical, indicating our relative mode extraction algorithm successfully reproduces MIRtoolbox's mirmode (see supplementary materials).
Number of Onsets
Onset detection is generally used in the context of tasks further downstream for temporal and rhythmic analyses, forming the basis of beat-tracking, tempo prediction, onset rates, meter prediction, novelty metrics, and many other high-level extracted features. However, since our objective is to analyze onset detection specifically, we select a single numeric value as with the other features: here the total number of onsets detected in the audio file.
Spectral Centroid
Spectral centroid, here used in the context of predicting timbre, is the weighted mean of frequency components in a signal and is often used as a simple predictor of a sound's “brightness” (Klapuri & Davy, 2006) and more generally used in the classification of timbre.
Tempo
Each tool examined here uses specific approaches for predicting the tempo of an audio file. However, by default, all three tools return a global tempo prediction: that is, a single tempo value for the entire audio file. Although tempo will vary within a performance of classical piano music due to the practice of rubato, our focus here as with the other features is the overall, or average tempo (however, given we are focusing on 8-measure excepts of baroque keyboard preludes, there are no fermatas or explicit tempo changes).
Algorithm Selection
Our goal in this paper is to present a proof of concept for assessing the precision of any algorithm. To highlight its utility in questions of broad interest, we chose widely used features—most of which have multiple implementations within each tool. Consequently, we selected one algorithm for each feature/tool combination using a procedure outlined in the supplementary materials, leaving a more in-depth comparison of algorithms or parameter variants (one of many potential applications of our method) for future work. However, we note researchers faced with decisions regarding algorithm choice could benefit from using the procedure we outline in this manuscript in order to inform their decisions even in situations where a ground truth is unavailable.
Variation Between Versions
The numerical scales vary considerably between features (i.e., mirmode values range between from −1 and 1; spectral centroid values can range anywhere from 20 Hz to 20 kHz). To facilitate comparisons between features, we employ a metric of relative variation for each feature. This involves contextualizing the variation (defined here as the standard deviation) observed in a given feature between all versions of one prelude (17 observations), against variation between all observations (17 versions * 24 preludes = 408 observations) of that feature. Variation Between Versions (VBV) is similar in principle to the f-statistic used in Analysis of Variance but is distinguished by comparing the variation in a group to the variation in all groups as opposed to the explained/unexplained variation in a model. We use this approach instead of a more traditional approach like normalization or standardization, as it affords an intuitive estimate of relative variation that can be simply interpreted across any metric. By using VBV, we are able to make comparisons of the variation between features with different ranges and standard deviations, as the variation within each feature is assessed in terms of all variation observed within that feature. This affords assessment across both tools and features.
VBV values approaching zero indicate high levels of precision across versions of a prelude, whereas values near one indicate low precision (i.e., variation of a feature within a piece is similar to those observed in that feature across the entire corpus). Conceptually, the VBV of our four features should reflect our hypothesized rank order shown in Figure 2. For example, mode predictions across 17 versions of Bach's Prelude in C Major should vary less than mode predictions across all versions of the 24 pieces in each recording (408 in total). Figure 3 outlines the process used to calculate the VBV for two prelude/tool/extracted feature combinations. Applying this procedure to all 408 audio files (17 versions of 24 preludes), for three tools (Essentia, Librosa, MIRtoolbox), and four extracted features results in 4,896 feature values and 288 VBV values.

A schematic representation of Variation Between Versions for two example pieces (x with low VBV and y with high VBV). 408 total dots represent the 17 versions of 24 preludes. Colored and filled dots represent the versions of a prelude: the matching bar corresponds to the standard deviation of those versions (i.e., the numerator of VBV). Unfilled dots in gray represent all other versions of all other preludes. (The gray line corresponding to the standard deviation of all 408 audio files, i.e., the denominator of VBV.) The equations for VBV are shown to the right of the figure.
Results
Figure 4 shows the VBV of each prelude, providing a dimensionless metric for assessing precision across three tools (columns) and four features (rows)—details on the extracted values are available in the supplementary materials. The mean VBV of all preludes for a given extracted feature/tool combination (marked by a black line in each cell in Figure 4) indicates the degree of precision of that combination, while its spread across all pieces indicates the influence of prelude-specific factors (i.e., structural characteristics of the compositions such as pitch height or the notated onset rate). We also include an interactive Shiny app that allows readers to explore the VBV of all the algorithms discussed here, as well as the individual audio file predictions (http://maplelab.net/vbv/).
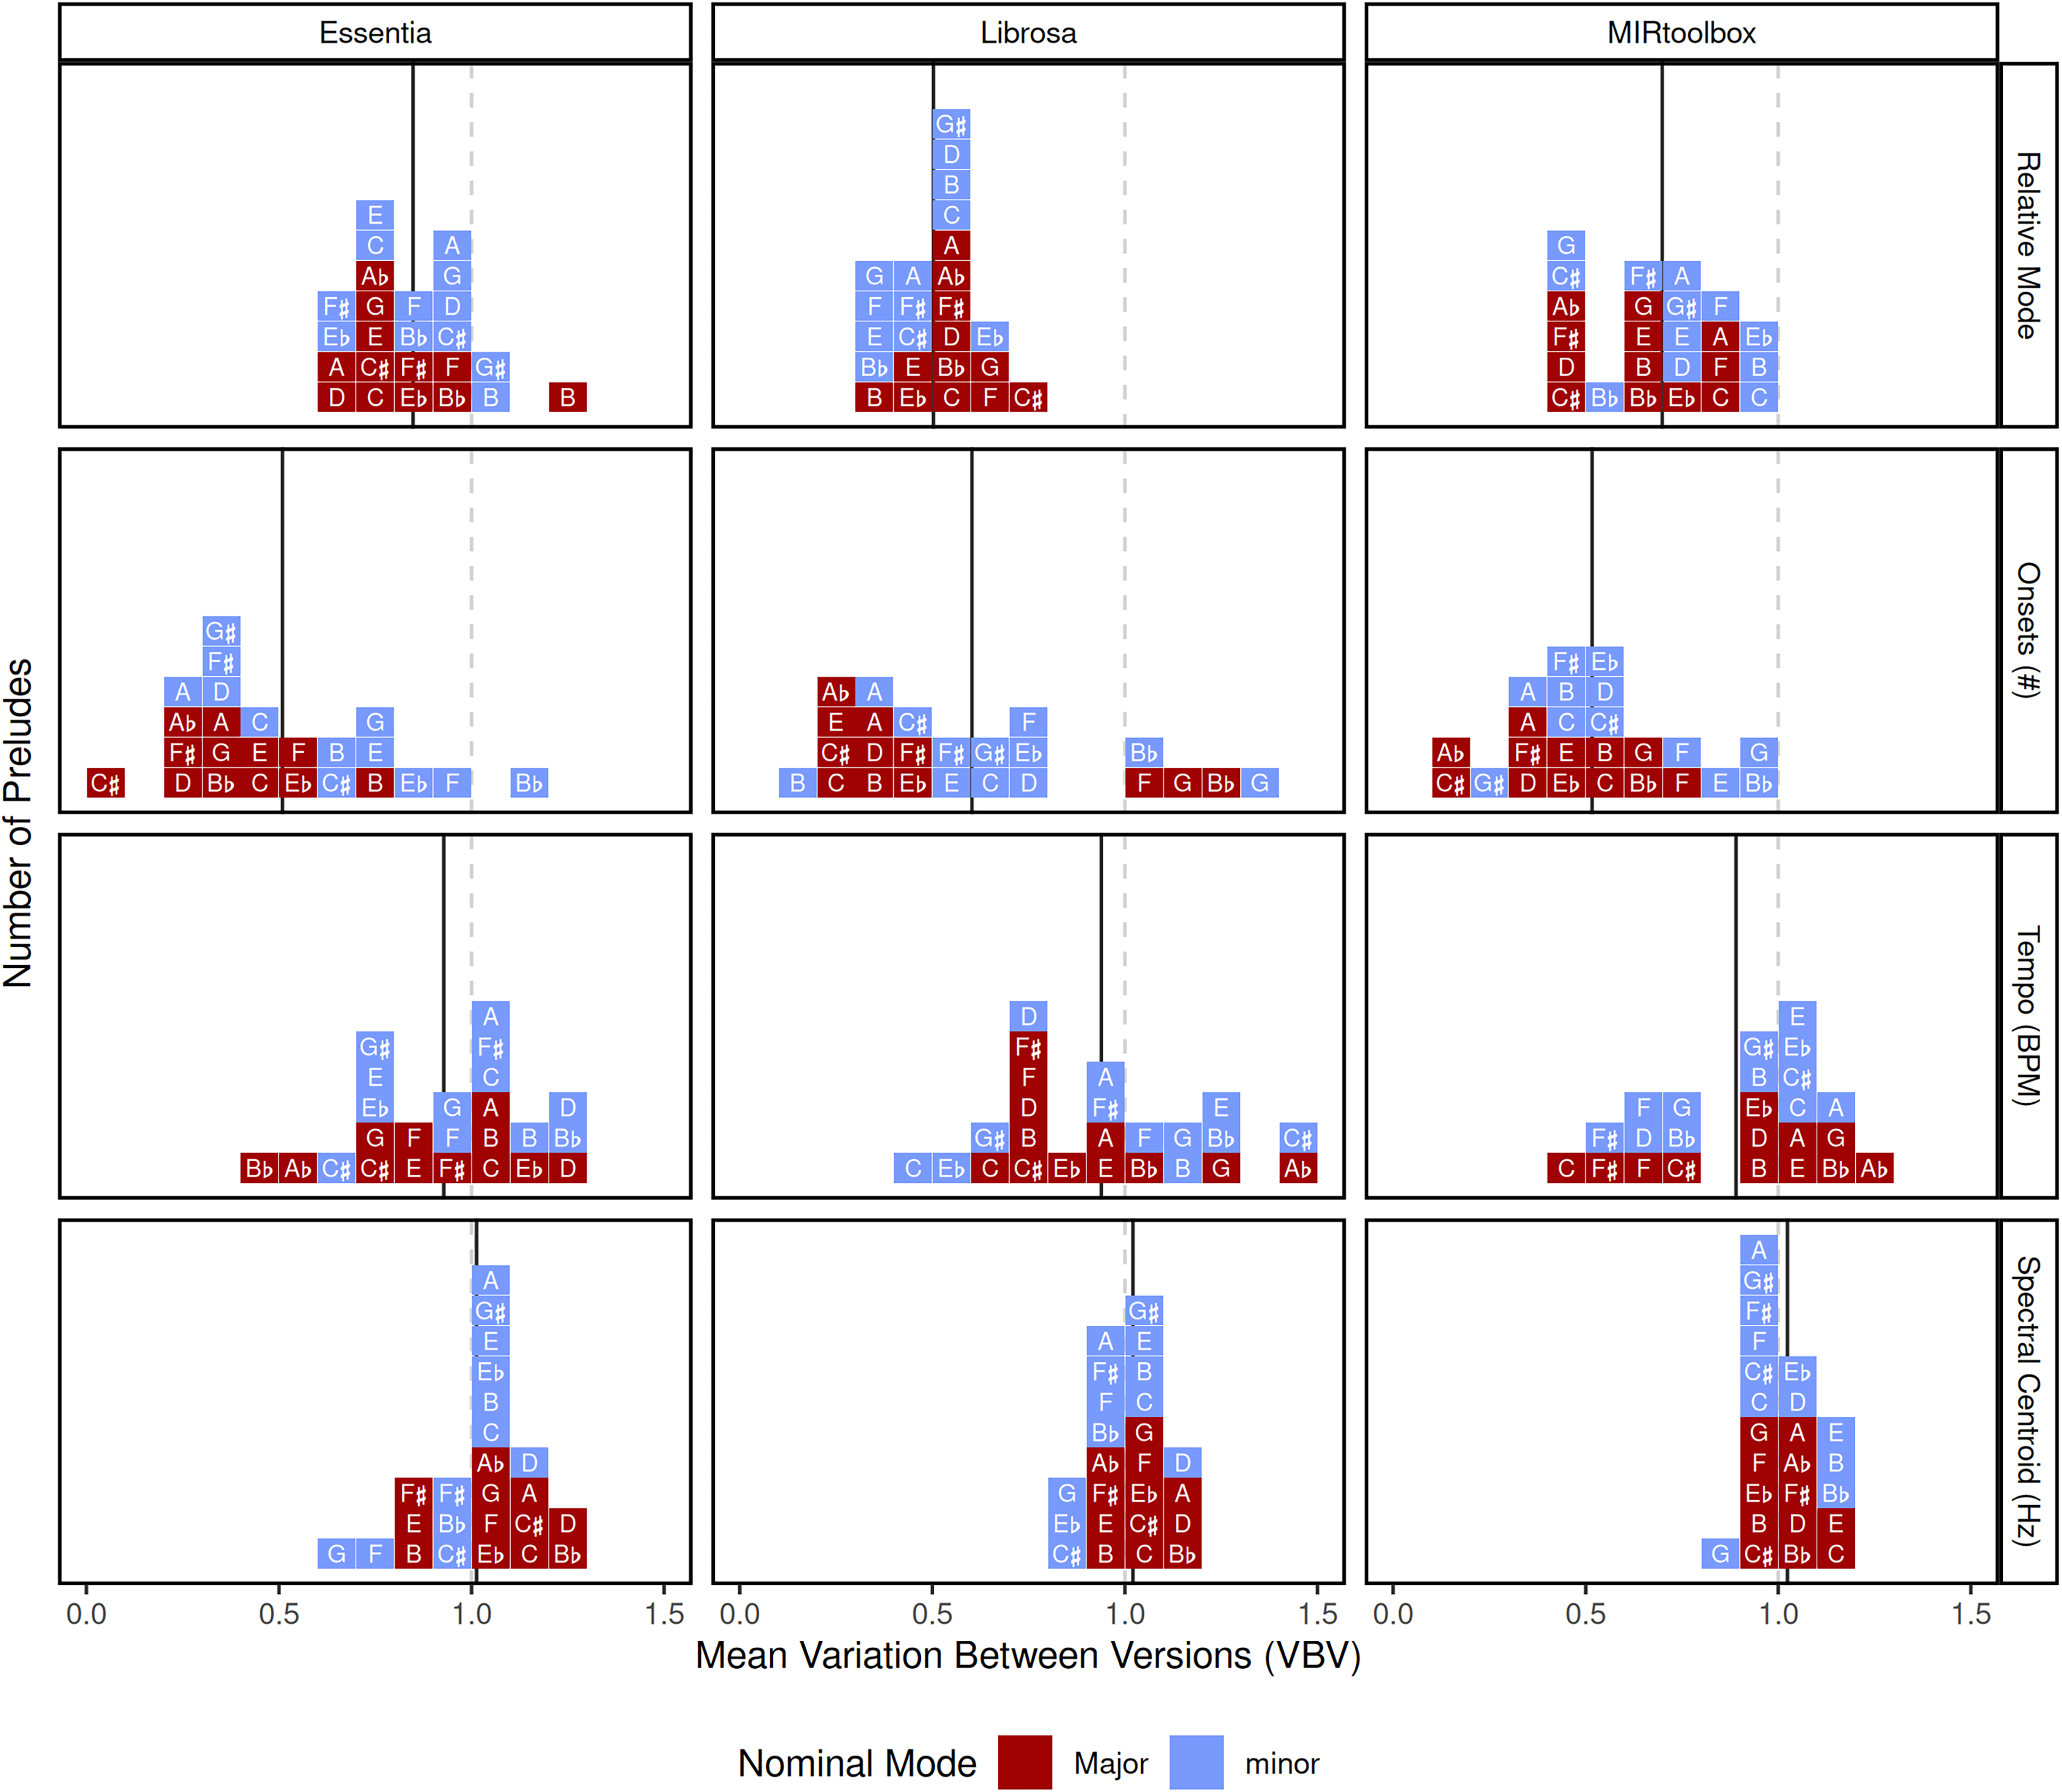
Variation Between Versions for all 24 preludes. Dotted lines indicate a ratio value of 1: where the variation of a piece is the same as the variation across the entire corpus. Solid lines indicate the mean of all VBV for a given extracted feature/tool combination. Shade indicates the nominal mode: for instance, the C Major prelude corresponds to the darker square with the letter “C”.
To demonstrate possible applications of this method, we identify three potential evaluation questions for which this approach offers useful insight. We statistically test our evaluation questions by conducting permutation tests on the VBV values for each group across the 24 preludes. For each question, we conduct main-effect tests (for instance, the effect of tool in the case of Q1) followed by pairwise tests on each combination of factor levels (for instance, each pairwise combination of tools in the case of Q1). We perform adjustments for multiple comparisons on the pairwise test using the Benjamini and Hochberg (1995) method, and use non-parametric tests due to the non-normality and unequal variances in this data. We use the F-statistic as the test statistic for main-effect tests and difference in means between groups for pairwise tests. All tests are two-tailed with 10,000 permutations using R (see Good, 2011 for details).
Q1: How Do Tools Compare When Extracting the Same Feature?
How do feature implementations differ in precision? For instance, is one tool's implementation of mode prediction more precise? A factorial permutation test on the effect of tool and feature on VBV revealed a significant effect of feature (p < 0.01; observed F = 88.4; 95% CI = 0.0754, 3.13) but not tool (p = 0.286; observed F = 1.27; 95% CI = 0.0248, 3.71), as well as a significant interaction between feature and tool (p < 0.01; observed F = 6.9; 95% CI = 0.199, 2.48).
Permutation tests on pairwise combinations of tools within extracted features reveal significant differences only for mode (Figure 5). Specifically, Librosa has significantly less observed variation than both MIRtoolbox (p < 0.01) and Essentia (p < 0.01). Additionally, MIRtoolbox has significantly less observed variation than Essentia (p < 0.01). Details for test statistics and confidence intervals in all pairwise comparisons appear in Table 3 in supplementary materials.
Q2: Assessing the Relative Continuum of Precision
Do the predictions of the musical properties considered here conform to our continuum of variability? That is, are mode algorithms the most precise followed by onset detection? Pairwise tests between features within each tool demonstrate this consistent pattern—with the exception of Essentia where the VBV of mode and tempo do not differ (p = 0.144). VBV for mode is significantly higher than for the number of onsets for Essentia (p < 0.01) and MIRtoolbox (p < 0.01), but not Librosa (p > 0.05). We also find a significant difference in the case of MIRtoolbox, where tempo exhibits significantly less Variation Between Versions than spectral centroid (p < 0.05).

VBV for extracted feature/tool combinations. Points indicate the mean ratio for that combination, plotted with 95% adjusted bootstrap adjusted percentile confidence intervals (R = 10000). Significance codes: * < 0.05, ** < 0.01, *** < 0.001.
Q3: How Do Mediating Effects Influence Algorithm Precision?
Does the performed instrument (harpsichord or piano) or nominal mode (the mode defined by the title or key signature, importantly distinct from the predicted mode or perceived mode) influence the precision of an algorithm? A final round of permutation tests reveals significant effects for neither instrument (piano or harpsichord) nor nominal mode (p > 0.05) across all extracted feature/tool combination (see Figure 6).
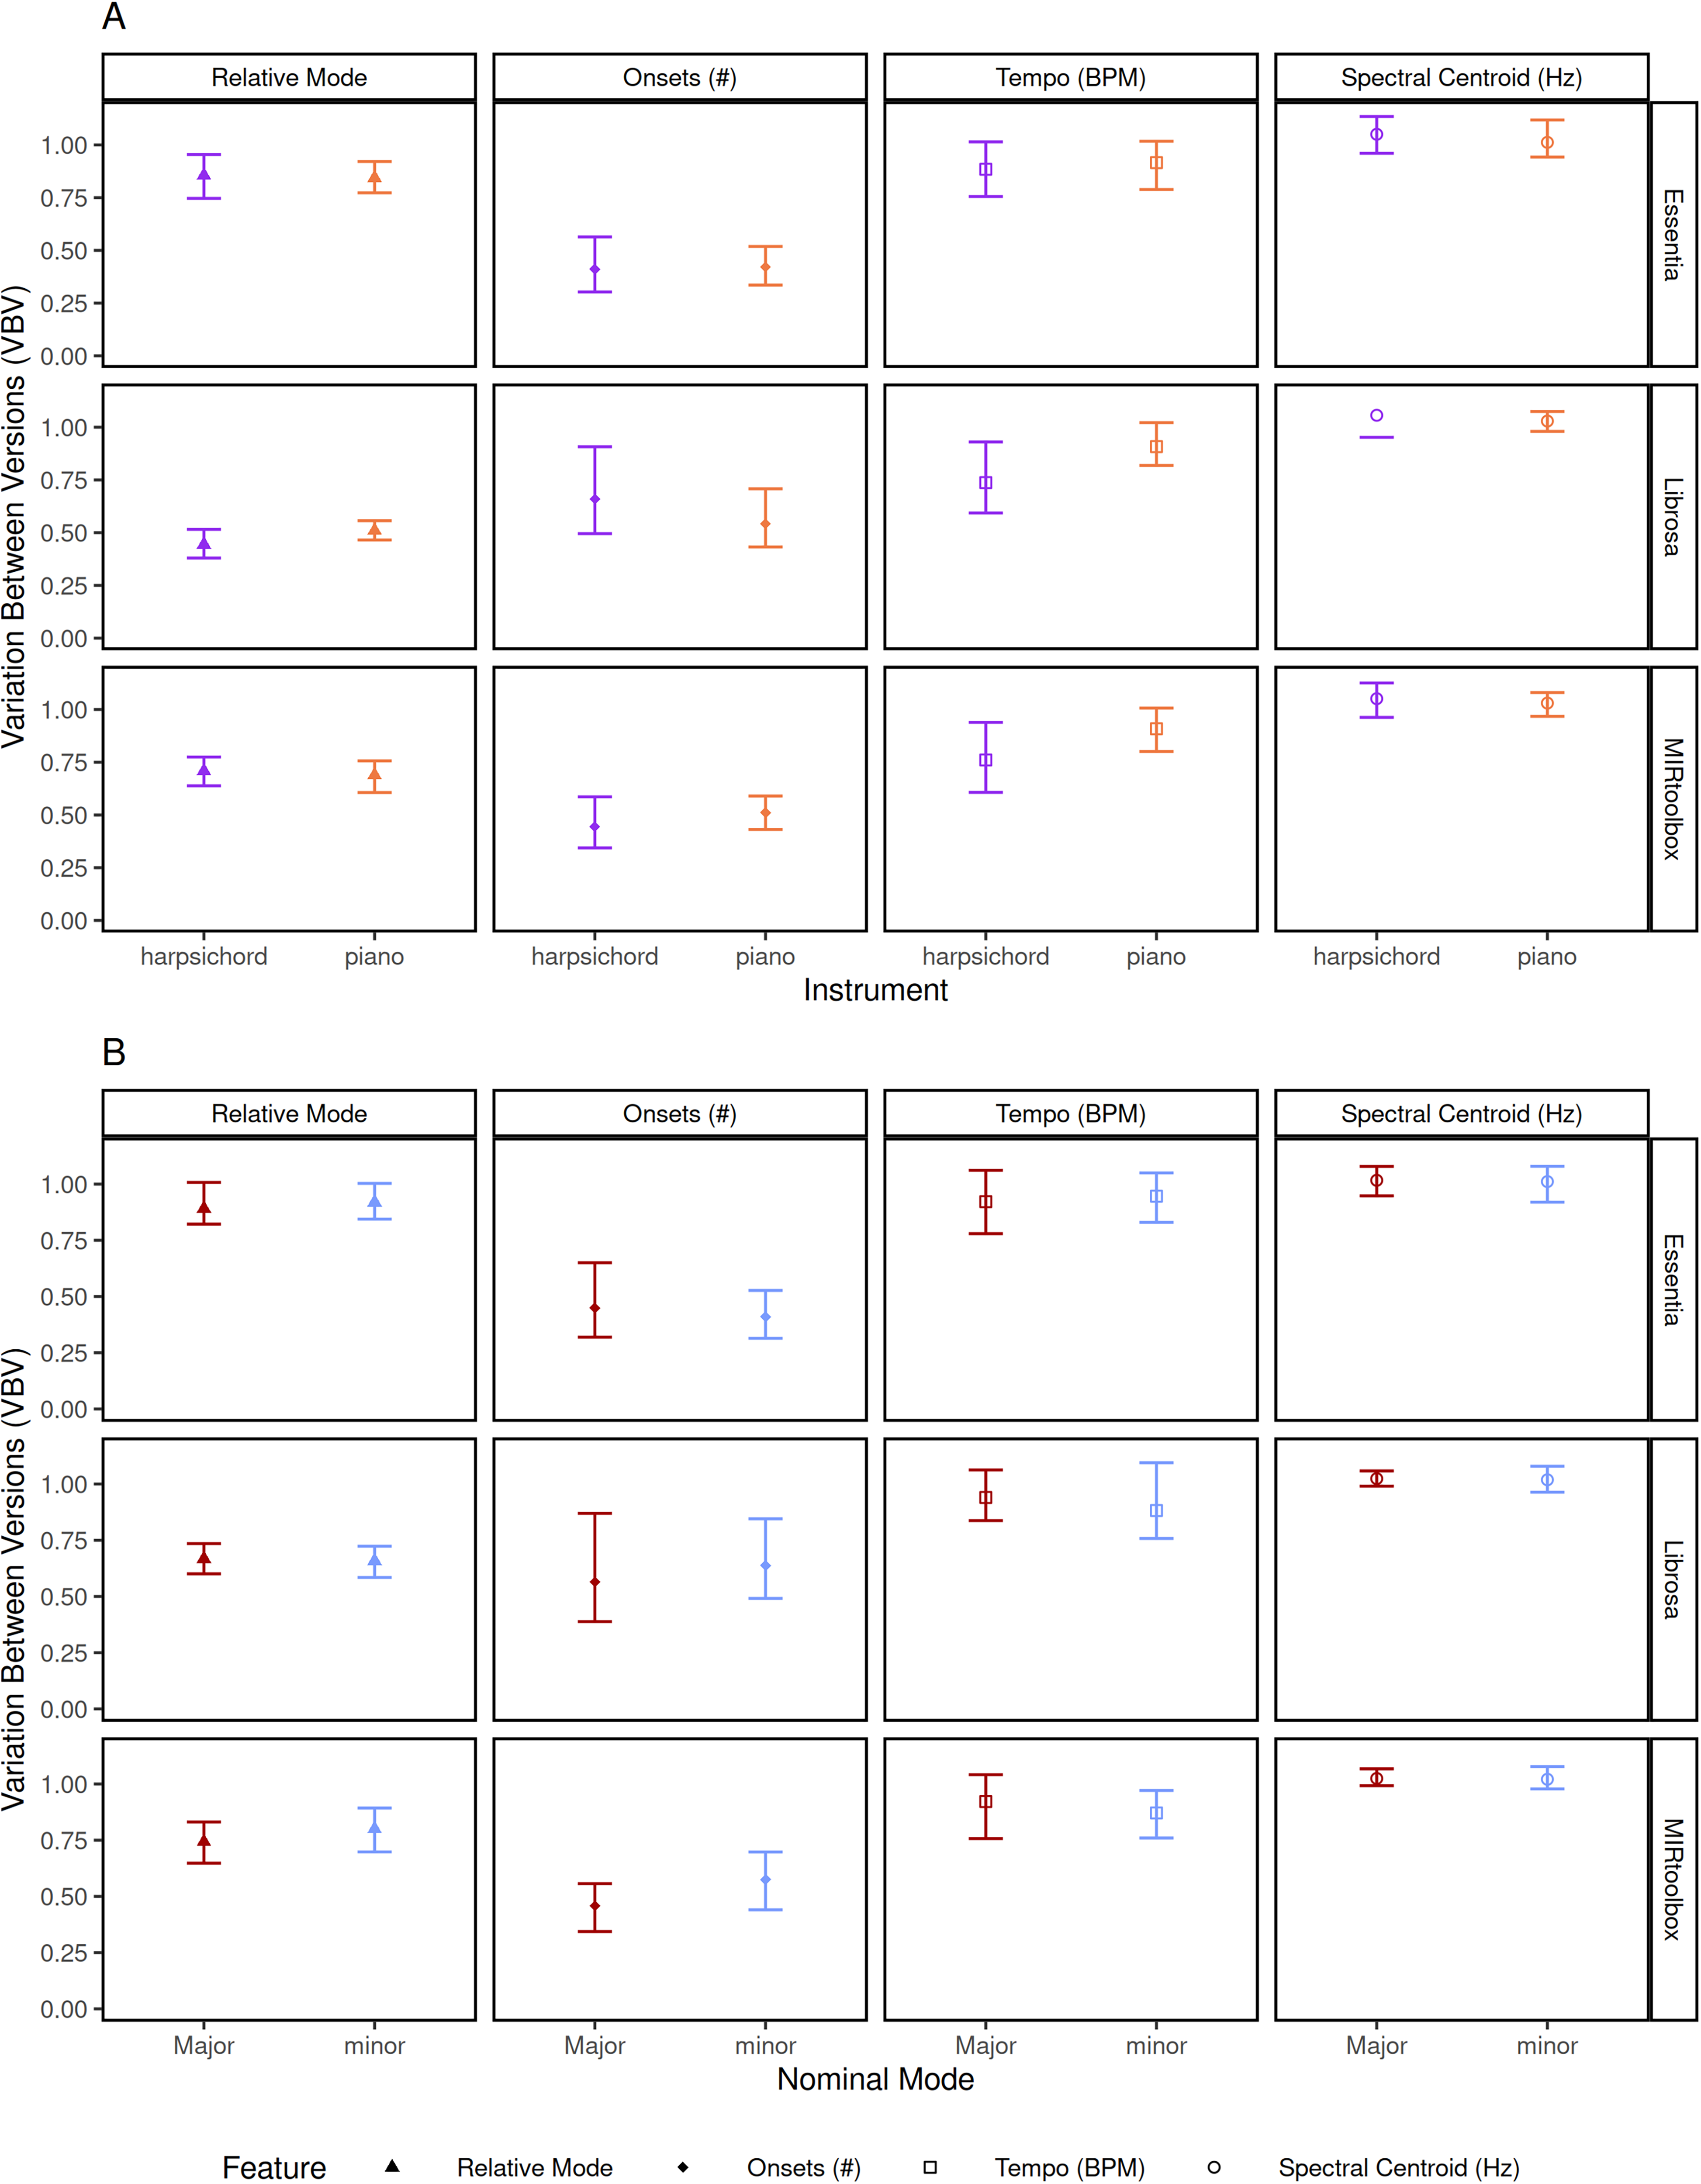
VBV for extracted feature/tool combinations, further subset by the instrument A and nominal mode B used in the performance. Points indicate the mean ratio for that combination, plotted with 95% adjusted bootstrap adjusted percentile confidence intervals (R = 1000). Significance codes: * < 0.05, ** < 0.01, *** < 0.001.
Contextualizing These Findings
Although VBV is useful for assessing the precision and providing a benchmark for comparison, interpreting the meaning of these dimensionless ratios requires broader contextualization. To that end, we analyzed the same set of audio files with the Essentia MusicExtractor, a “large set of spectral, time-domain, rhythm, tonal and high-level descriptors” used in the AcousticBrainz project for genre classification, mood detection, and other tasks. We used a version extracting 444 features grouped into three basic categories: low-level features (loudness, spectral distribution features, sensory dissonance, pitch salience), rhythm features (beats, tempo, onset rate, danceability), and tonal features (chroma features, and tuning).
VBV values across 444 features range from about 0.25 to 1 (Figure 7). The majority fall on the more variable end of our continuum (e.g., loudness, tempo, and timbre-related features), with those related to tonality appearing less variable. Together, the VBV values for this collection of features provides useful context for the four discussed in Q1–Q3.

Kernel density estimate of Variation Between Versions for all single dimensional extracted features in the Essentia MusicExtractor (444 features). VBV values correspond to the mean of all 24 preludes in the WTC Book 1. Feature categories provided by the Essentia MusicExtractor are visualized in shades of gray. Mean VBV from the 12 features analyzed here are imposed as shapes.
Discussion
Here we demonstrate a method for evaluating the precision of music content analysis tools independent of a ground truth. Before turning to a broader discussion of implications and applications, we will first demonstrate how this approach is useful in answering the three illustrative questions we described earlier.
Answering Q1: How Do Tools Compare When Extracting the Same Feature?
Previous work such as Urbano et al. (2014) has noted that tools differ in their implementations of features. Examining the precision of algorithms predicting the same musical property offers a useful way to compare efficacy. As independent or third-party tests on a common data set offer a powerful assessment of utility, precision, and robustness, here we applied predictions for VBV to this between-tool evaluation of four features. Examining the precision of algorithms predicting the same musical property offers a useful way to compare efficacy. This offers a novel benchmark for testing, as well as a content-neutral manner for selecting the optimal tool for a given task. We did not have specific predictions on the expected variability in timbre and tempo, but their inclusion provides helpful context for understanding the variation observed in features detecting note events as well as mode.
We find no differences in the VBV across tools for predictions of the number of note events, suggesting these three tools perform similarly, regardless of their accuracy or overall quality. However, with respect to predictions of mode, we find Librosa the most precise. Since the primary difference between these three mode predictions is the method of chroma feature extraction, this suggests Librosa is least susceptible to pitch independent factors, such as timbre—yet crucially it is no less sensitive to timbre in spectral centroid evaluations.
We see assessments of precision using VBV as complementing accuracy-based approaches (e.g., evaluation competitions like MIREX) by providing additional insight into precision in a real-world musical context. Among other benefits, this offers a novel approach to optimizing feature extraction. For example, in the case of mode prediction, MIRtoolbox is the only native implementation of this algorithm. However, using this evaluation framework we can see that using chroma features extracted by Librosa leads to more precise predictions of that property without reliance on ground truth. Intriguingly, these findings based on precision converge with recent work on improving the mirmode algorithm using assessments of accuracy. Eerola and Schutz (in press) found chroma features from Librosa offer mode predictions which are more accurate (e.g., aligned with expert ratings of relative mode obtained by Delle Grazie et al., in press). More detailed between-tool analyses may reveal strengths and weaknesses of specific tools while within- tools analyses may serve as a form of parameter optimization. VBV offers the opportunity to assess tools in novel ways without a reliance on ground truth, which in aligning musical features with intuitions regarding musical properties—can help to build useful bridges between music information retrieval and music cognition.
Answering Q2: Assessing the Relative Continuum of Precision
The ability to compare precision across tools and features offers useful insight, showing (among other things) that Librosa's precision is consistent with our continuum of variability (Figure 2). Since VBV is a relative metric, it allows for direct comparison of variation across both tools and features, which would otherwise be difficult due to their differing scales and units. In fact, even within one feature such as spectral centroid, different implementations may lead to different ranges of values. For instance, since Librosa performs resampling to 22050 Hz by default, its spectral centroid values range from 530 Hz to 6391 Hz (in contrast to ranges of 433 to 4983 Hz for Essentia, and 530 Hz to 4220 Hz for MIRtoolbox).
Curiously for Essentia—as shown in Figure 3B—mode is not significantly different from tempo (although on other features it performs similarly to the other two tools). However, given the full gamut of our analyses, we conclude this is primarily indicative of shortcomings specific to routines required for extracting chroma features. Further, in the case of MIRtoolbox, the VBV for mode (0.75 on average) exhibits more variation than VBV for number of onsets (0.5 on average). As discussed above, we expected the number of onsets to vary more due to elaborations and ornamentation introducing legitimate variation between versions. In addition to these two concerns with the musical property of note events, from a technical standpoint the temporal resolution of onset detection may count chords which human listeners hear as a single onset as multiple onsets if they are not perfectly synchronized. Despite these factors, predictions of mode are still susceptible to greater unexpected variation than number of onsets in two of three tools examined here.
Answering Q3: How Do Mediating Effects Influence Algorithm Precision?
VBV also allows us to examine how other factors might specifically influence the degree of observed variation: whereas comparing tools may help facilitate tool selection, and comparing features provides an avenue for validating our continuum of variability, analyzing mediating effects allows us to determine what factors may be causing differences in observed variation.
We present two mediating effects that might influence the extracted features: instrument, and nominal mode. Although this analysis is by no means exhaustive, it demonstrates how researchers can explore potential causes of variation. Neither of these mediating effects appears to play a meaningful role in explaining the VBV for this set of extracted features and tools. We would not expect the performed instrument to influence the prediction of mode or the number of onsets, but it seems more likely that the performed instrument would influence extractions of spectral centroid as a measure of timbre. However, since we compare the versions within a piece to the entire corpus, the variation between specific pieces on all albums would typically be similar to all pieces on all albums: in both cases, the largest sources of variation (instrument, acoustics, recording technology) arise from differences between albums. Further, in the case of tempo, there is no reason to believe the instrument a performer selects would have an impact on their tempo choices in any systematic fashion.
Although these may be less fine-grained than systematic approaches, they offer a useful perspective on the practical effects of changes in timbre or structure. Applying these analyses to other factors, such as structural musical properties of the pieces (e.g., pitch height or note event rate), may account for the VBV observed in mode or number of onsets. However, given the degree of variation we observe for predictions of mode, it seems possible that differences in the acoustics, recording technology, and instrument (on a finer-grained scale than quantified here) may be responsible. The Chroma Normalized Energy (CENS) algorithm for chroma features implemented in Librosa is designed to be more robust to factors like dynamics, timbre, and articulation, and therefore the lesser degree of observed variation may point to the effectiveness of this technique (Müller & Ewert, 2011).
General Discussion
The results of the questions discussed above demonstrate the viability of this framework in assessing music content analysis features. Beyond the specific results of the three questions considered above, we believe this demonstrates that VBV is a useful complement to conventional evaluations focused on accuracy; particularly in cases where a ground truth is not available. Unlike methods that systematically alter audio files to produce mediating effects and determine their influence on feature extraction (Mauch & Ewert, 2013; Sturm, 2014), this approach uses naturally occurring factors that differ between versions of the same musical composition. Of particular interest is the fact that using this approach means evaluating cutting-edge models predicting subjective or difficult-to-measure musical properties could be done in some cases without first obtaining ground truth data which is often difficult to collect. Specific applications include:
Tool selection: As described above, selection of extraction tools for musical properties like mode can be facilitated by minimizing the VBV—pointing to the utility of Librosa for extracting relative mode. Parameter optimization: In the case of mode, this procedure could be applied to selecting optimal weights in the Krumhansl–Schmuckler key-finding algorithm. In the case of features we expect to vary more, while not explored here, prior distributions from similar musical samples can be used as a target for precision. In the case of this sample, using the variation from the distribution of tempo markings from Palmer's analysis of the WTC may be an appropriate target (Bach & Palmer, 2004). Development and testing: Applying a-priori expectations of how musical properties are perceived during the development of music content analysis tools would improve these tools at the source. In conjunction with traditional accuracy assessments, this method may aid in identifying the factors contributing to unexpected variation at a lower level in the processing chain. For instance, if the method by which chroma features are computed in a relative mode algorithm is highly variable, this can be diagnosed and minimized with this method.
With respect to mode, this study further highlights the need to examine the accuracy of pitch class profiles, particularly their robustness, the effect of implementation, and further the effect of performance differences on high-level features like relative mode which rely upon them. Since we examine the same mode algorithm with different pitch class profiles, variation observed in predictions of mode here likely reflect differences in the implementation of the pitch class profile extraction (the other steps did not differ between tools). Direct examination of pitch class profile extraction may clarify what specific characteristics might lead to inaccuracies which can cause erroneously variable predictions of musical properties like mode. The wide range of data available from instruments like the Yamaha Disklavier and Steinway Spirio may be particularly suited for this task, since they offer an effective tool for obtaining of synchronized audio and symbolic data.
Differences in VBV across pieces indicate that other musical properties may have an influence on the extraction of other seemingly unrelated features. For instance, Figure 4 shows a larger spread between pieces (individual VBV values) for number of onsets than spectral centroid: this indicates that predictions of the number of note events is impacted by structural properties of a piece, while timbre predictions are less impacted.
Finally, predictions of mode have higher VBV than note events in two of the three tools examined despite the numerous factors we discuss that justify its placement on the continuum of variation: a trend that reinforces the demand for evaluation of complex features like mode.
Limitations
One limitation of this approach raised earlier in the manuscript relates to ornamentation (the practice of adding improvised embellishments at specific points in a piece of music). This is particularly worth considering, given that it a common feature in performances of Bach's music, and it is not strictly proscribed in the score (unlike notes and rhythms, performers are free to interpret ornamentation according to their own wishes). These embellishments may introduce slight changes in the number of note events (although this could in theory also affect pitch distributions, they are generally diatonic and therefore should have minimal influence on predictions of mode). Similarly, simultaneous onsets (chords) on a piano may not trigger at the exact same time leading to multiple onsets being detected by an algorithm where a human listener may hear only one.
Although ornamentation could—in theory—pose problems for VBV, examination of individual pieces suggests this is not the case in practice (at least within our corpus). For example, the C Minor prelude is rhythmically isochronous and affords no opportunity for ornamentation (improvised or otherwise). Yet the VBV for its onsets is close to the mean for all 24 pieces (second row, blue box with the letter C in Figure 4). In addition, the C Major prelude is both isochronous and lacking chord note events (the alignment of which could, in theory, complicate the VBV approach). Yet the C Major prelude has a VBV close to the mean of all pieces (second row, red box with letter C), except in the case of Librosa. In contrast, note that the F# Major prelude contains a trill (a source of variation from performer interpretation), and yet has a VBV value consistently lower than the C Minor prelude. This suggests ornamentation and small differences in the alignment of notes within chords are not solely driving VBV. If it were, pieces lacking ornamentation (such as the C Major and C Minor preludes) should have lower VBV than those exhibiting it (F# major).
A second limitation of this work is that here we focus exclusively on global predictions of music properties: that is, a single value for a single audio file). However, some of these features unfold throughout a piece of music. For example, mode can be changed through modulation and tempo can be altered by rubato. In principle it could be useful to evaluate frame-decomposed features rather than global values.
Nonetheless, we have undertaken our analyses here using only global predictions, since although such granularity could be useful in future research, this itself presents a number of technical challenges regarding the alignment of recordings. Moreover, global predictions offer a good starting point, as they likely better preserve a-priori notions regarding the continuum of variability (e.g., there would be more variation between versions in the number of notes within a fixed window vs. an entire recording). Furthermore, frame-decomposed values do not lend themselves as cleanly for VBV analysis, as it is difficult to make any a-priori predictions about how they might compare (and musical properties such as tempo clearly influence file length, complicating comparisons across versions). Nonetheless, it may be useful to evaluate the variation in fixed frame sizes across audio files (for instance, using 3 s frames across all versions and comparing the frames in an ordinal fashion).
Future Directions
When using this framework for future evaluations, widely recorded compositions by popular composers from later eras (e.g., Mozart, Beethoven, Chopin) which generally do not include improvised ornamentation might prove more helpful than the WTC. Variations in the speed at which performers execute trills and tremolos could still pose technical challenges; however, careful selection of pieces may mitigate that confounding variable (which does not appear to explain the variation observed here for reasons discussed earlier). Further, while we focus on classical piano compositions due to the nature of the musical properties in this style, the continuum of variability can likely be adapted to different styles of music.
Although here we focus here on three tools and four extracted features, VBV may be useful in assessing any number of tools and features. Future work could examine the effect of musical properties like tempo, dynamics, articulation, and pitch height on the extraction of features that should not be influenced by these changes (i.e., chroma features and onset detection). Further, differences between versions may point to the effect of audio features (e.g., recording equipment, mixing, file preparation) on seemingly unrelated extracted features. Although previous work has shown that chroma and timbre features (MFCCs) are robust to changes in audio quality, it is unclear if this extends to other audio features, or to manipulations in performance-specific factors like acoustics and recording technology.
Evaluation frameworks using VBV could in theory be extended to applications outside of music. In principle, the concept of unexpected variation is present in other domains (for instance, while pitch or timing might vary between individuals reciting the same spoken words, the exact words should not). Consequently, we see VBV as a potentially useful approach for evaluating non-musical feature extraction or prediction algorithms in other data types.
Conclusion
Here we introduce a novel method for evaluating the output of music content analysis. Rather than assessing accuracy, it examines the precision of musical property predictions based on knowledge of music perception and practice. Since these tools are used frequently both in research and commercial contexts, it is important to develop frameworks for evaluating these tools to ensure that the extracted features exhibit construct validity (Cronbach & Meehl, 1955) with the musical properties they are meant to predict.
Although accuracy assessments are the most conventional technique for evaluating music content analysis tools, approaches which do not rely on a ground truth such as evaluations of robustness (e.g., Urbano et al., 2014) are a viable alternative. In situations where we do not have a ground truth (for example, in the analogy of the riflery team's shots when viewed from behind, visualized in Figure 1, right panel), evaluating robustness or precision may be the only way to assess the quality of a feature. Even when accuracy is known, analysis of precision can still be invaluable (In Figure 1, understanding that Team C is imprecise can provide insights on how to improve their overall performance).
We see this approach as a cousin to previous work in MIR assessing the effectiveness of music content analysis tools using so-called irrelevant transformations (Sturm, 2014, 2016; Urbano et al., 2014). However, rather than transforming audio, here we exploit the variation in performances of classical piano music that should not influence musical properties like mode. As such, we see VBV as a useful way to diversify the existing “toolbox” of evaluation by examining prediction quality from a different point of view. In a broader sense, we aim to contribute to a rich tradition of improving the efficacy of MIR by using VBV to complement and extend existing approaches to evaluation.
Supplemental Material
sj-docx-1-mns-10.1177_20592043251384138 - Supplemental material for Evaluating Musical Predictions with Multiple Versions of a Work
Supplemental material, sj-docx-1-mns-10.1177_20592043251384138 for Evaluating Musical Predictions with Multiple Versions of a Work by Konrad Swierczek and Michael Schutz in Music & Science
Footnotes
Action Editor
Andrew Goldman, Indiana University, Department of Music Theory, Jacobs School of Music.
Peer Review
One anonymous reviewer Nat Condit-Schultz, Georgia Institute of Technology, School of Music Daniel Shanahan, Northwestern University, Bienen School of Music
Data Availability Statement
Declaration of Conflicting Interests
The authors declared no potential conflicts of interest with respect to the research, authorship, and/or publication of this article.
Ethical Approval
This research did not require ethics committee or IRB approval. This research did not involve the use of personal data, fieldwork, or experiments involving human or animal participants, or work with children, vulnerable individuals, or clinical populations.
Funding
The authors disclosed receipt of the following financial support for the research, authorship, and/or publication of this article: This work was supported by the McMaster Arts Research Board, and the Social Sciences and Humanities Research Council of Canada (SSHRC).
Supplemental Material
Supplemental material for this article is available online.
References
Supplementary Material
Please find the following supplemental material available below.
For Open Access articles published under a Creative Commons License, all supplemental material carries the same license as the article it is associated with.
For non-Open Access articles published, all supplemental material carries a non-exclusive license, and permission requests for re-use of supplemental material or any part of supplemental material shall be sent directly to the copyright owner as specified in the copyright notice associated with the article.