
Abstract
One of the possible objective and universal descriptions of most folk songs can be based on structural musical characteristics such as contour, tone set, tonality, rhythm, meter, and form. Experimental studies in the recent decade supported the universal importance of contour and tonality as the two most important characteristics determining human music cognition and memory. It follows from this statement that a mathematically adequate description of folk songs should be based on both contour and tonality information. We describe a method searching for characteristic groups of universal melody types (MTs) propagating jointly and regularly in several subsets of 59 folk music cultures in Eurasia and America, represented by a database of 59,000 folk songs. The MTs are represented by pairs of contour and degree distribution vectors. We describe the propagation of the MTs by 59-dimensional vectors containing their “moments” in the 59 cultures studied. We show that principal component analysis (PCA) of these moment vectors reveals assumable ancestor cultures, and we show a method modeling the 59 musical cultures as linear combinations of the musical contents of seven assumable ancestral cultures. The results provide a method and a hypothesis for tracking the footprints of assumable ancient musical “primary languages” in folk music traditions in Eurasia and America. The assumable musical ancestral cultures presented here show good correspondence with the distribution of certain human genetic characteristics and archaeogenetic results.
Introduction
According to its founders, comparative folk music research aims to study relationships of musical cultures represented by structured melody collections, with the final intention to draw conclusions regarding the beginnings of music (Bartók, 1937; Hornbostel, 1986; Nettl, 2015). It follows from this definition that a common framework of systematization based on universal characteristics is indispensable when comparing structured melody collections of different cultures (Brown et al., 2014). Such description may be based on different principles including analysis of melody structure (Goienetxea et al., 2016; Járdányi, 1974), metadata (Conklin, 2013), or predefined features including both structural and social characteristics (Lomax, 2009).
A possible common framework was suggested by Lomax based on a set of predefined universal “cantometric” parameters, where the parameter values are determined by subjective rankings of numerous individuals (Lomax, 2009). Although the objectivity of this “cantometric” method seems questionable for several researchers (McClean, 2006), a more exact method called “CantoCore” (Savage et al., 2015) based on the idea of Lomax was successfully applied for determining common folk song types as well as characteristics of Taiwanese native tribes (Brown et al., 2014; Savage & Brown, 2014). The universal characteristics of songs focusing on pitch, rhythm, form, instrumentation, performance style, and social context were selected using phylogenetic methods and a song database containing 304 tunes arising from different parts of the world (Savage et al., 2015).
In contrast with cantometric and CantoCore parameters, an alternative universal description of most folk songs can be based on strictly structural musical characteristics such as contour, tone set, tonality, rhythm, meter, and form (Vargyas, 2005). As instrumentation, performance style, and social context of a given song may be very different even within one given culture, depending on the situation of the performance (including the specific situation of the recording), this information is not considered when focusing on the pure melody structure. For instance, a song can be performed by a solo singer or a solo flute player with more or less ornamentations, but also by a choir of a community, accompanied or not accompanied by an instrumental orchestra or a solo instrument. At the same time, the performance style and the rhythm may be adapted to the text (parlando), or to the strict rhythm of the dance (giusto), depending on the social situation of the performance. Focusing on structural characteristics, numerous methods of melody classification have been elaborated over the last 150 years, often aiming at comparative analysis of musical cultures (Danckert, 1939; Dobszay & Szendrei, 1992; Ellis, 1885; Elscheková, 1966; Herzog, 1930; Huron, 1996; Janssen et al., 2015, 2017; Juhász, 2006; Nettl, 1954; Wiora, 1952).
Cross-cultural music analysis raises the question of how culture-dependent music cognition can be considered in a common framework of musical universals. Although the list by Brown and Jordania (2013) proposes a wide range of musical universals, we justify our method on experimental studies in the recent decade supporting the universal importance of the contour and the tonality as the two most important characteristics determining human music cognition and memory (Schmuckler, 2016). Therefore, we provide a mathematical representation of the melodies by coupled pairs of 64-dimensional contour and 24-dimensional degree distribution vectors. Accordingly, a melody type (MT) is constructed by a pair of contour type (CT) and degree distribution type (DDT) vectors characterizing the centroid of a cluster of similar melodies determined by the self-learning algorithm called the Self Organizing Cloud (SOC) (Juhász, 2015).
Based on the preceding representation, the first aim of this study can be defined as follows: we want to identify the most characteristic “universal” MTs existing more or less generally in the folk music cultures of Eurasia and America in order to describe the specific assemblies of these types in different cultures within a common framework. Thus, we determine the most typical “universal” MTs (UMTs) as pairs of universal contour type (UCT) and universal degree distribution type (UDDT) vectors. The database where our algorithm searches for the UMTs counts 55,182 melodies arising from 59 cultures of Eurasia and America.
Bayard initiated the concept of tune family “to identify specific melodies in as many of their variant forms as possible” (Bayard, 1954), but he did not define explicitly how to define real families of tunes in general (Cowdery, 1984). Vargyas designated essentially the same phenomena as “tune types,” and listed the specificities defining a possible type as follows: contour, tone set (tonality), rhythm, form, interrelation between tune and text, and performance style (Vargyas, 2005). We will show that the UMTs determined by the SOC algorithm represent melodies being similar by contour, tone set (tonality), form, and partly the rhythm (except syllable number). Thus, they can be considered as mathematically formulated tune types corresponding to many of the specificities of Vargyas.
After determining the UMTs, we construct 59-dimensional vectors for each UMT, containing the frequencies of their local variants in the 59 cultures studied, and we show that principal component analysis (PCA) of the resulting 59-dimensional vector ensemble may indicate certain assumable ancient musical cultures having significant impact in “recent” folk music traditions documented in the past one to two decades. We also show a new method that reconstructs the musical contents of these assumable ancient cultures and generates models of the recent cultures as weighted sums of the reconstructed ancient musical contents.
Our diffusionist hypothesis assuming ancient musical cultures in the background of the contacts of “recent” folk music traditions is based on a previous work revealing strong rank correlations in propagation of UMTs and human genetic mitochondrial haplogroups (Juhász et al., 2019). The associations of haplogroups whose frequencies show correlated propagation with associations of UMTs could be identified in certain ancient human populations identified by archeogenetics. Obviously, the assumption that the footprints of certain ancient cultures can be detected even in musical cultures of the last two decades does not exclude any other, regional or synchronic, interaction.
We test our method by comparing our computational results with classical musicological studies of folk music traditions living in the Eurasian steppe region located between the Carpathian Basin and China. Numerous published works provide us with comprehensive structural classifications of Anatolian Turkish, Azeri, Karachay, Kazakh, Kyrgyz, Mongolian, and so on folk music cultures for comparison with our computational results (Bartók, 1976; Sipos, 1997, 2000, 2001, 2004, 2006, 2009, 2014; Vikár & Bereczki, 1971, 1979, 1989, 1999).
Database
Our database contains 60,153 melodies divided into 59 separate subdatabases (Tables 1 and 2).
The cultures of the database.

Groups of cultures where PC1 is a dominant component.

The sizes of the 59 databases are between 200 and 2500 songs. In order to eliminate problems of comparative analysis caused by these different sizes, we determined national–regional sets of MTs for each of the 59 databases one by one using SOC clustering, and the analysis was based on these collections counting 150–400 types per culture. The data sources are listed, characterized, and mapped in Appendix 5.
Methods
Representation of the Melodies by Coupled Pairs of Contour and Degree Distribution Vectors
Mathematical representation of our melodies is given by coupled pairs of 64-dimensional contour and 24-dimensional degree distribution vectors for each melody. The elements of the degree distribution vectors represent the cumulated time duration of the degrees, normalized by the total time duration of the melody, while the contour vectors contain 64 subsequent pitch samples of the melody, increasing by 1 for a semitone. For sake of comparability, all melodies are transposed to the final tone G. (The key is also transposed, thus, a melody transcribed in A major is transposed to G major.) The diagram in Figure 1(a) shows the continuous pitch–time function increasing by one for each semitone, ending on the common pitch value 7 that corresponds to the common ending note G. The pitch–time function is sampled in 64 equidistant time intervals, independent of the actual time duration. The rhythm is represented by the subsequent identical pitch values. Figure 1(b) shows the cumulated time rates of the degrees in the melody. Degrees are indicated beyond the columns. As most of our written sources miss information on microtonal effects, we apply the resolution of one semitone in our numerical pitch representation. Visual representations of the contour and degree distribution vectors are shown in Figure 1(a) and (b), respectively.

(a) The generation of the melody contour vectors; and (b) the degree distribution vectors.
Determining the Melody Types of a Musical Culture Using the SOC Algorithm
According to the vector pair representation of the melodies, MTs are defined as centroid vectors of the local condensations of the multidimensional point systems constructed by coupled pairs of contour and degree distribution vectors. These pairs of CT and DDT vectors are determined as feature vectors learned by the SOC algorithm trained by the contour and degree distribution vectors of the melodies (Juhász, 2015). Using these definitions, an MT is constructed by a pair of CT and DDT vectors.
The unsupervised self-learning SOC system is derived from Kohonen's Self Organizing Map (Kohonen, 1995; Toiviainen, 2000; Toiviainen & Eerola, 2002) and the nonmetric multidimensional scaling (MDS, see Appendix 1) principle (Borg & Groenen, 2005). The main difference between Self Organising Map (SOM) and SOC is that the former assigns the feature vectors to predefined lattice points of a plane grid, whereas the latter assigns them to freely moveable points of a low-dimensional space and moves these points into a structure optimally mapping the distance conditions of the multidimensional feature vectors in low dimensions (Juhász, 2015; Juhász et al., 2019). The SOC is also able to modify the number of feature vectors during the learning process until a prescribed significance of the clustering is reached (see Appendix 2).
In order to be able to learn pairs of CT and DDT vectors simultaneously, the distance function measuring the dissimilarity between melodies and/or MTs, as well as the learning algorithm, were extended to associations of more than one joined feature vector. The musical diversity measure (distance) of a given MT and a given melody is defined as follows:
The weighted Euclidean distance The distance The musical distance

It is worth mentioning here that a third component characterizing the rhythmic diversity is added to Equation (1) when searching for relatives of a given individual melody. However, rhythmic characteristics strongly depend on the text, therefore our pure musical analysis focuses on the contour and the degree distribution that were found to be the most important features in music cognition (Schmuckler, 2016).
The mathematical description of the SOC algorithm and its extension to more than one joined training and feature vectors, as well as the performance tests, are given in Appendix 2.
A wide scale of similarity measurement and alignment principles has been published over the past decades including weighted Euclidean, city-block, correlation distances, wavelet- and Fourier transformations, and dynamic time warping (Janssen et al., 2015, 2017; Juhász, 2015, 2007; Savage & Atkinson, 2015; Scherrer & Scherrer, 1971; Schmuckler, 1999, 2010; Velarde et al., 2013; Volk & Van Kranenburg, 2012; Van Kranenburg et al., 2009). The relevance of our method based on Euclidean distance measure and SOC-clustering of contour and degree distribution vector pairs was successfully validated on a Hungarian test data set containing 164 melodies (Corpus Musicae Popularis Hungaricae l-XII, 1951–2012). We have shown that the correlation between SOC-clustering and expert musicological classification became 0.69 for this test set. The details are found in Appendix 2.
Determining the UMTs
Based on the preceding concept of MTs, the first main aim of this study is to identify the most characteristic MTs existing more or less generally in the folk music cultures studied in order to describe different cultures within a common framework as specific compositions of these UMTs. Our workflow contains two phases. First, we determine the most typical “own” MTs of 59 musical cultures by clustering the sets of pairs of contour and degree distribution vectors of the corresponding 59 melody collections one by one. Thus, we obtain 59 independent sets of dominant MTs for the 59 cultures studied. Second, we determine the most typical “universal” MTs (UMTs) as coupled pairs of cluster centers of the unified collection of the 59 “own” MT sets obtained in the first phase. This process resulted in 847 UMTs describing the MTs simultaneously inhering in more musical cultures with an appropriate significance. (The mean distance of the cluster members from the corresponding UMT is less than halve of the distance from the closest neighboring UMT, for all clusters.)
Having obtained the 847-element UMT set, the cultures can be characterized in a common framework as follows. We assign the MTs of a given culture to the most similar UMTs, and represent the numbers of the hits in an 847-dimensional vector. (To take account of the actual distance d of an MT from the closest UMT, its hit is calculated as
Normalizing this hit-vector by the total number of MTs of the given culture, we obtain its “UMT frequency distribution.” Obviously, all of the 59 cultures studied are characterized by their own “UMT frequency distribution,” and the vectors constructed from these distributions are unified in the 59*847-dimensional “UMT frequency matrix” containing the UMT frequency distribution vectors of the 59 cultures in its rows.
At the same time, a column of the preceding “UMT frequency matrix” represents the “moments” of the corresponding UMT in the 59 cultures. Therefore, the propagation of the kth UMT in the cultures can be characterized by the 59-dimensional “UMT moment vector” generated from the 59 elements of the kth column of the UMT frequency matrix. These 59-dimensional moment vectors construct an 847-element vector system that we analyzed using PCA.
PCA of the UMT Moment Vectors Characterizing the Distributions of the UMT in the Cultures Studied
As we have mentioned previously, each UMT was characterized by a 59-dimensional “UMT moment vector” containing its own moments in the cultures studied. The main assumption of our work is that the PCA of the spatial structure of the point system constructed by these 847 vectors may reveal the footprints of the most important ancestral cultures in recently observed folk music traditions. As an illustration, we discuss a simple model containing five UMTs belonging to two cultures denoted by A and B in Figure 2. Horizontal and vertical axes represent the moments of the UMTs in cultures A and B, respectively.

Illustration of PCA of a point system constructed by five pieces of two-dimensional UMT moment vectors in cultures A and B.
Let us suppose that an ancestor culture E containing UMTs 1–5 contributed to cultures A and B, and the contributions preserved the original moments of the UMTs within the ancestral culture E. In such conditions, all five UMTs have nonzero coordinates on both axes, and the proportions of the coordinates a1:a2:a3:a4:a5 as well as b1:b2:b3:b4:b5 are identical due to the assumption that the contributions preserved the original moments [see Figure 2(a)]. Consequently, the points representing the descendant moments in cultures A and B are situated along a straight line represented by the unity vector 


Furthermore, the impact of the ancestral culture E to recent cultures A and B can also be characterized by coordinates
Obviously, we have to assume more unknown ancestral cultures in our realistic system of 59 cultures (dimensions) and 847 UMTs. In other words, we have 847 UMT moment vectors in the 59-dimensional “space of cultures.” However, this is not a crucial problem, because we can determine all of the mathematically possible 59 principal vectors of the point system, and the most important assumable ancestral cultures can be identified by the highest related eigenvalues. It is easy to see on the score of the preceding two-dimensional model that the 59 coordinates of the PC vectors characterize the impacts of the corresponding ancestral culture on the 59 recent populations. Thus, higher coordinates of a PC vector in the 59-dimensional “culture space” indicate recent cultures where the corresponding ancestral culture has higher impacts. The mathematical description of our PCA method is given in Appendix 3.
Projection of the 847 59-dimensional UMT moment vectors into the subspace determined by the orthogonal PC vectors whose eigenvalues exceed a critical number provides an optimal low-dimensional approximation of the original vector system. In this subspace, the coordinates of the UMTs represent the optimal estimates of the moments of the UMTs in the assumable ancestral cultures represented by the PCs. Consequently, an 847-dimensional vector containing the normalized coordinates of the 847 UMTs in a given PC vector can be interpreted as the optimal approximation of the UMT frequency distribution of the assumable ancestral culture represented by the given PC vector. Thus, the musical contents of the assumable ancestral cultures can be reconstructed by projection of the UMT moment vectors into the subspace of the most important PC vectors.
Although PCA is a widely applied method, it produces not necessarily well interpretable results. Fortunately, the fast reduction of the eigenvalues in higher dimensions refers to an appropriate shape of the 59-dimensional point system, and yields the reduction of the analysis to the assumption of 6–7 ancestral cultures in our case. (The 6th largest eigenvalue is less than 10% of the first one.) In addition, our basic assumptions also were verified by the results showing that the PC vectors are well interpretable from both musical and geographical points of view, although the analysis was based on pure mathematical principles.
Modeling of Musical Cultures as Weighted Admixtures of the UMT Frequency Distributions of the Most Important PC Vectors
We have shown above that our 59 cultures can be characterized by 847-dimensional UMT frequency distribution vectors. Accordingly, the musical content of the hypothetical ancestral cultures can also be reconstructed by the normalized coordinates of the 847 UMTs in the corresponding principal component (PC) axes.
The mathematical problem can be formulated as follows. We want to approximate the given D-dimensional vector 
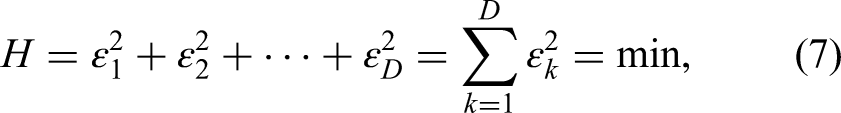
The accuracy of an estimation is indicated by the error power H normalized by the total power of the vector to be estimated 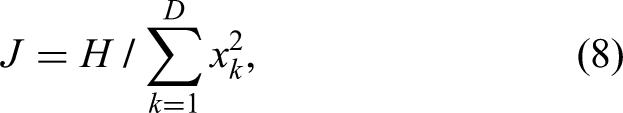
As the partial derivatives of the error power can be analytically formulated as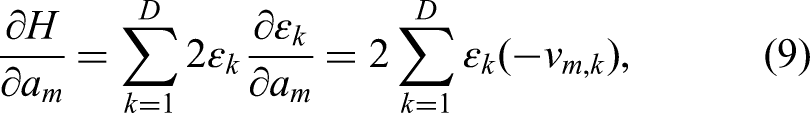
Thus, substituting a UMT frequency distribution vector into
The whole flow of the analysis is demonstrated in the diagram in Figure 3. We have uploaded the input data and the C++ Builder codes of the algorithms we have elaborated for the study: https://github.com/JUHZOL/MS/tree/main
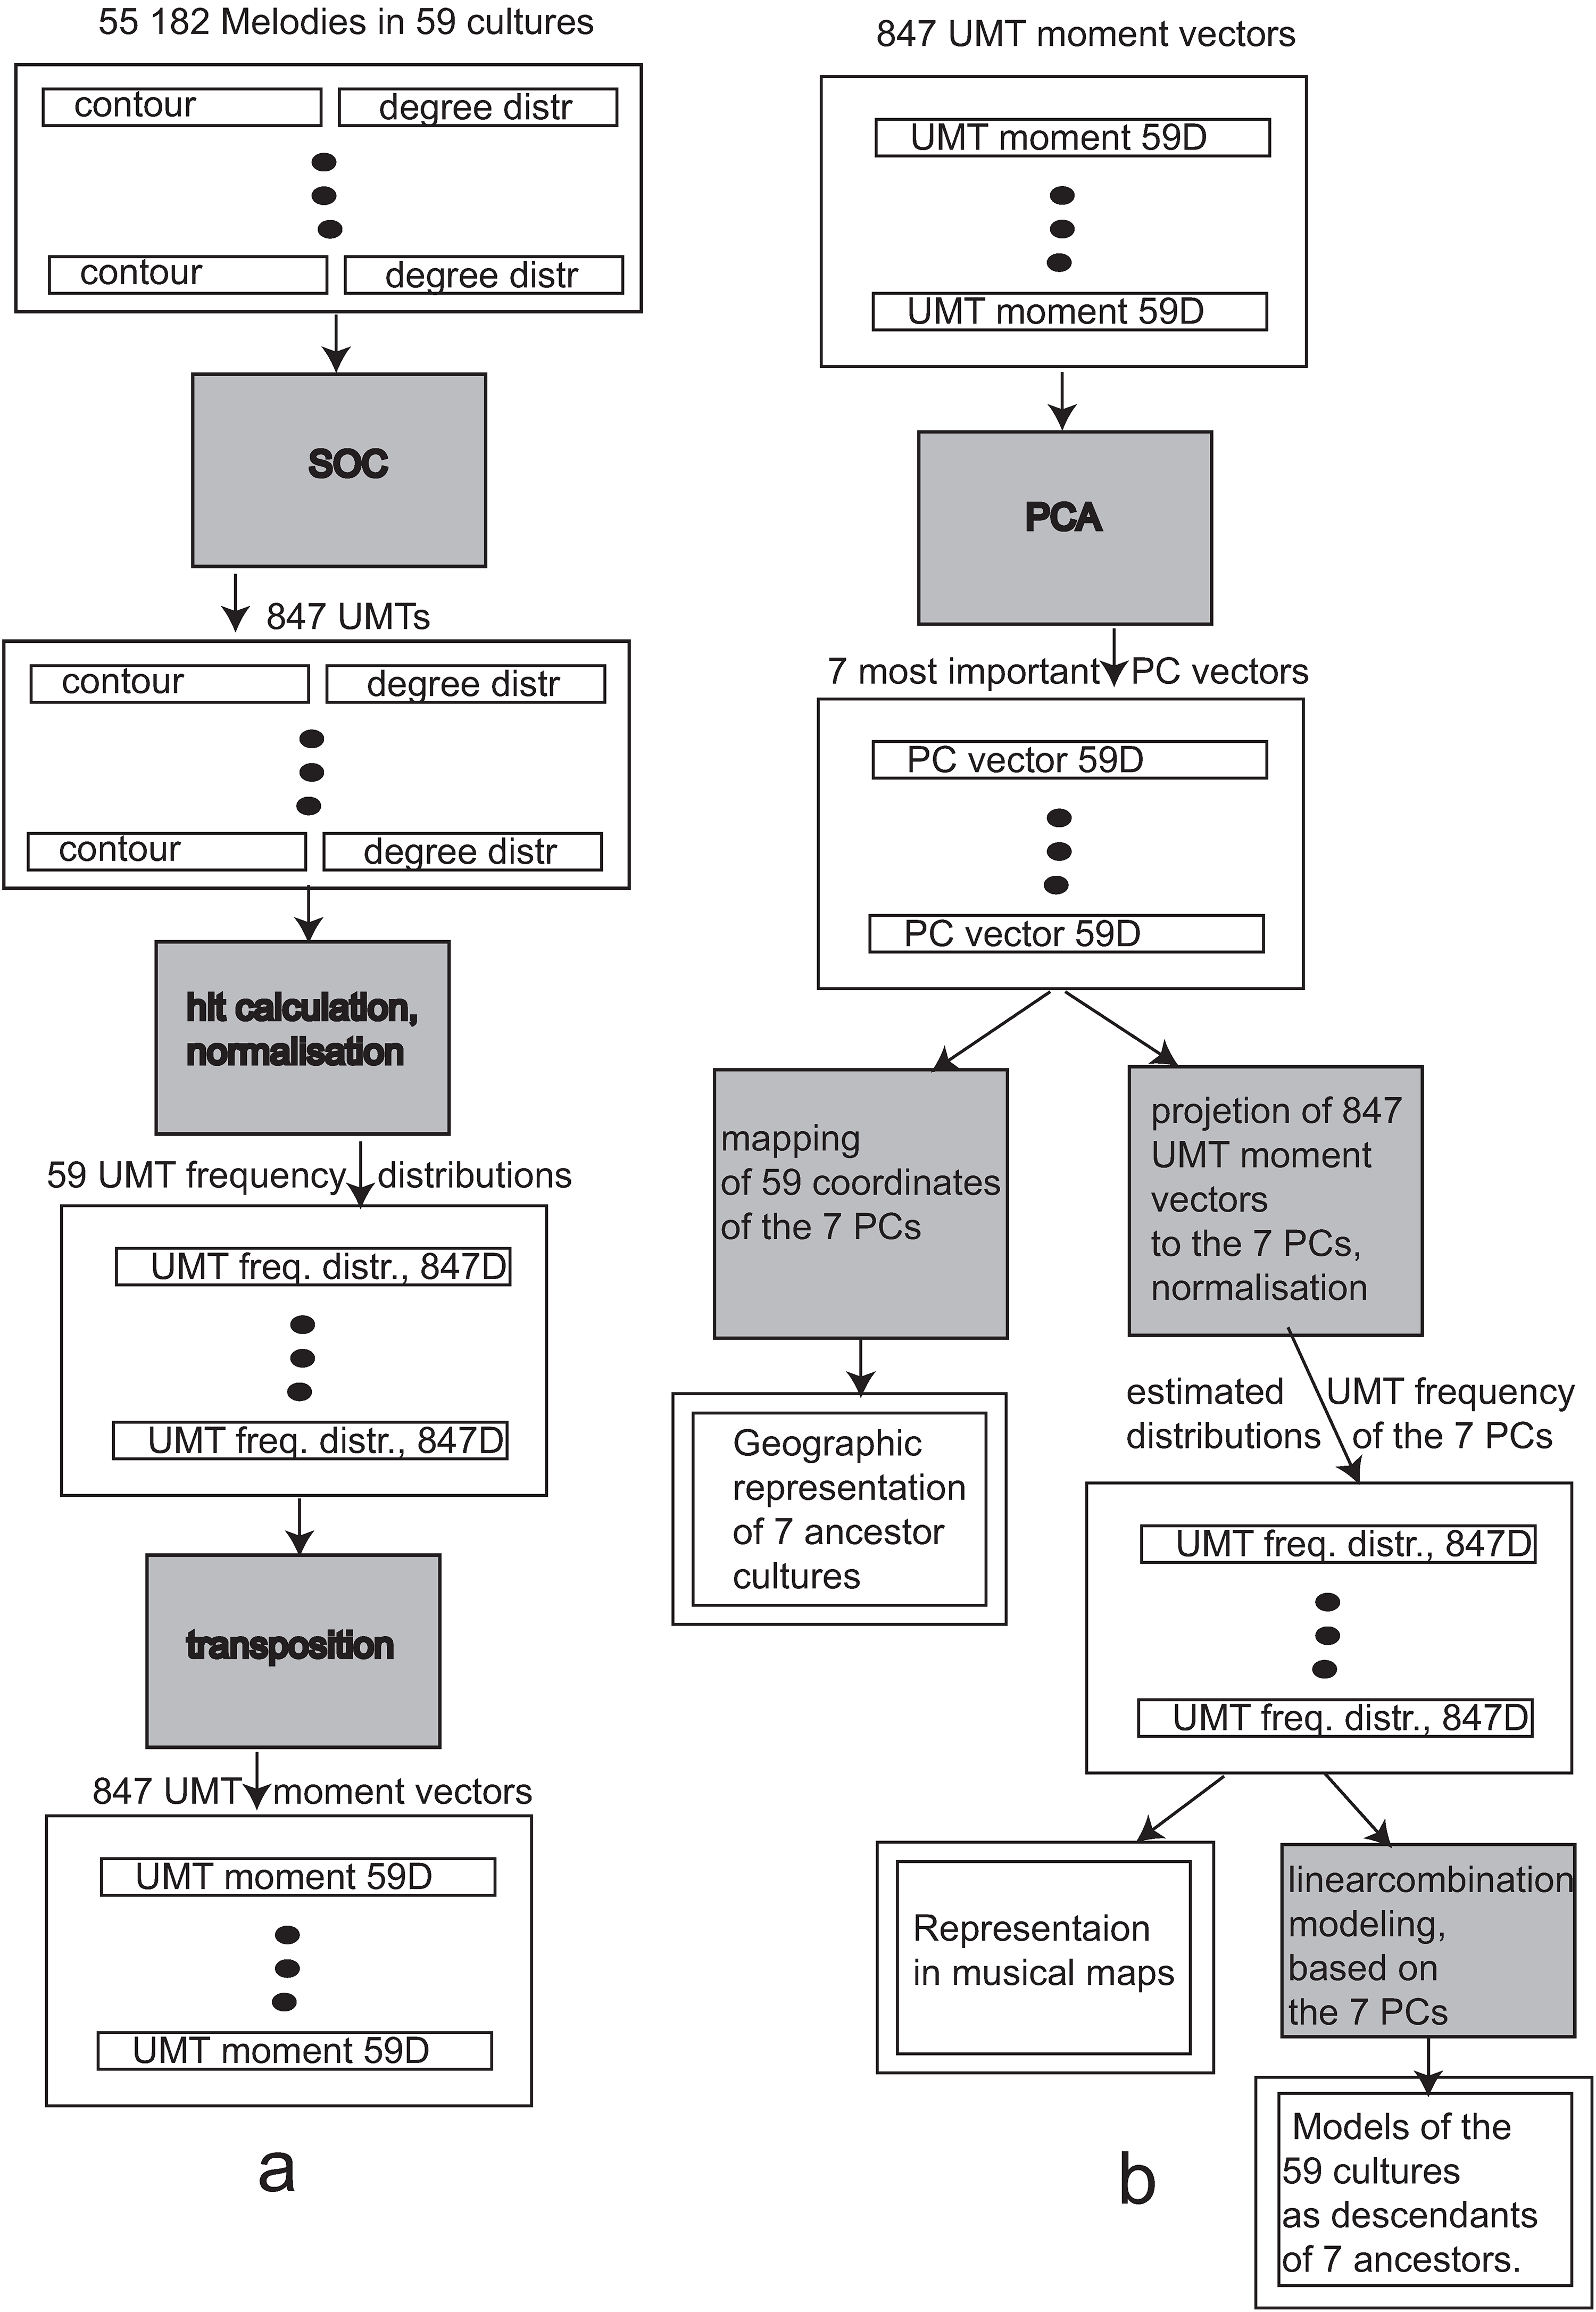
Processing scheme: (a) generation of UMTs and UMT moment vectors from the 64-dimensional contour and 24-dimensional degree distribution vectors of the melodies, using the SOC; and (b) generation of the PC vectors from the 59-dimensional UMT moment vectors using PCA, and generation of the 7-dimensional PC models of the cultures using the linear combination algorithm.
Results
The Set of the UMTs
The SOC learning process described in the sections “Determining the Melody Types of a Musical Culture Using the SOC algorithm” and “Determining the UMTs” resulted in an 847-element UMT set. The size of the set was adjusted during learning automatically, until the mean distance of the MTs of any cluster and the corresponding UMT became less than the half of the distance from the closest neighboring UMT (see Appendix 2). As the cluster sizes were in the interval of 5–50, the Student's t-test may be an appropriate measure of significance in our study. A test was applied for all UMTs one by one as follows. Considering a given UMT (UMT1), the input data of the test are: (1) the standard deviation of the distances between the UMT and the MTs belonging to its own cluster; and (2) the distance between UMT1 and the nearest neighboring UMT (UMT2). The hypothesis is that the distance between UMT1 and UMT2 is significantly higher than the standard deviation (i.e., the “radius” of the “sphere” of the cluster around UMT1). According to this test, the probability that the distance between an UMT and its nearest neighbor is significant was more than 0.95 for all of the 847 clusters. (For more details, see Suppl.Mat1.)
The coupled pairs of UCTs and UDDTs are mapped separately by the SOC, as it is shown in Figure 4(a) and (b). As these points represent the relationships of 64 as well as 24 dimensional cluster central vectors (UCTs and UDDTS) in two dimensions, at first sight they show a random-like structure. However, a more accurate study may show that the different areas of these maps correspond to different musical characteristics. Nine contour examples and the arrow in Figure 4(a) show that the ranges increase from the top to the bottom. Descending contours are located in the left, whereas domed and wavy contours in the right halves. The UDDT map in Figure 4(b) is divided into three main clusters containing minor-like (third b3), major-like (third 3) as well as third-less UDDTs. The arrow separating the two clusters shows the direction where the range increases.
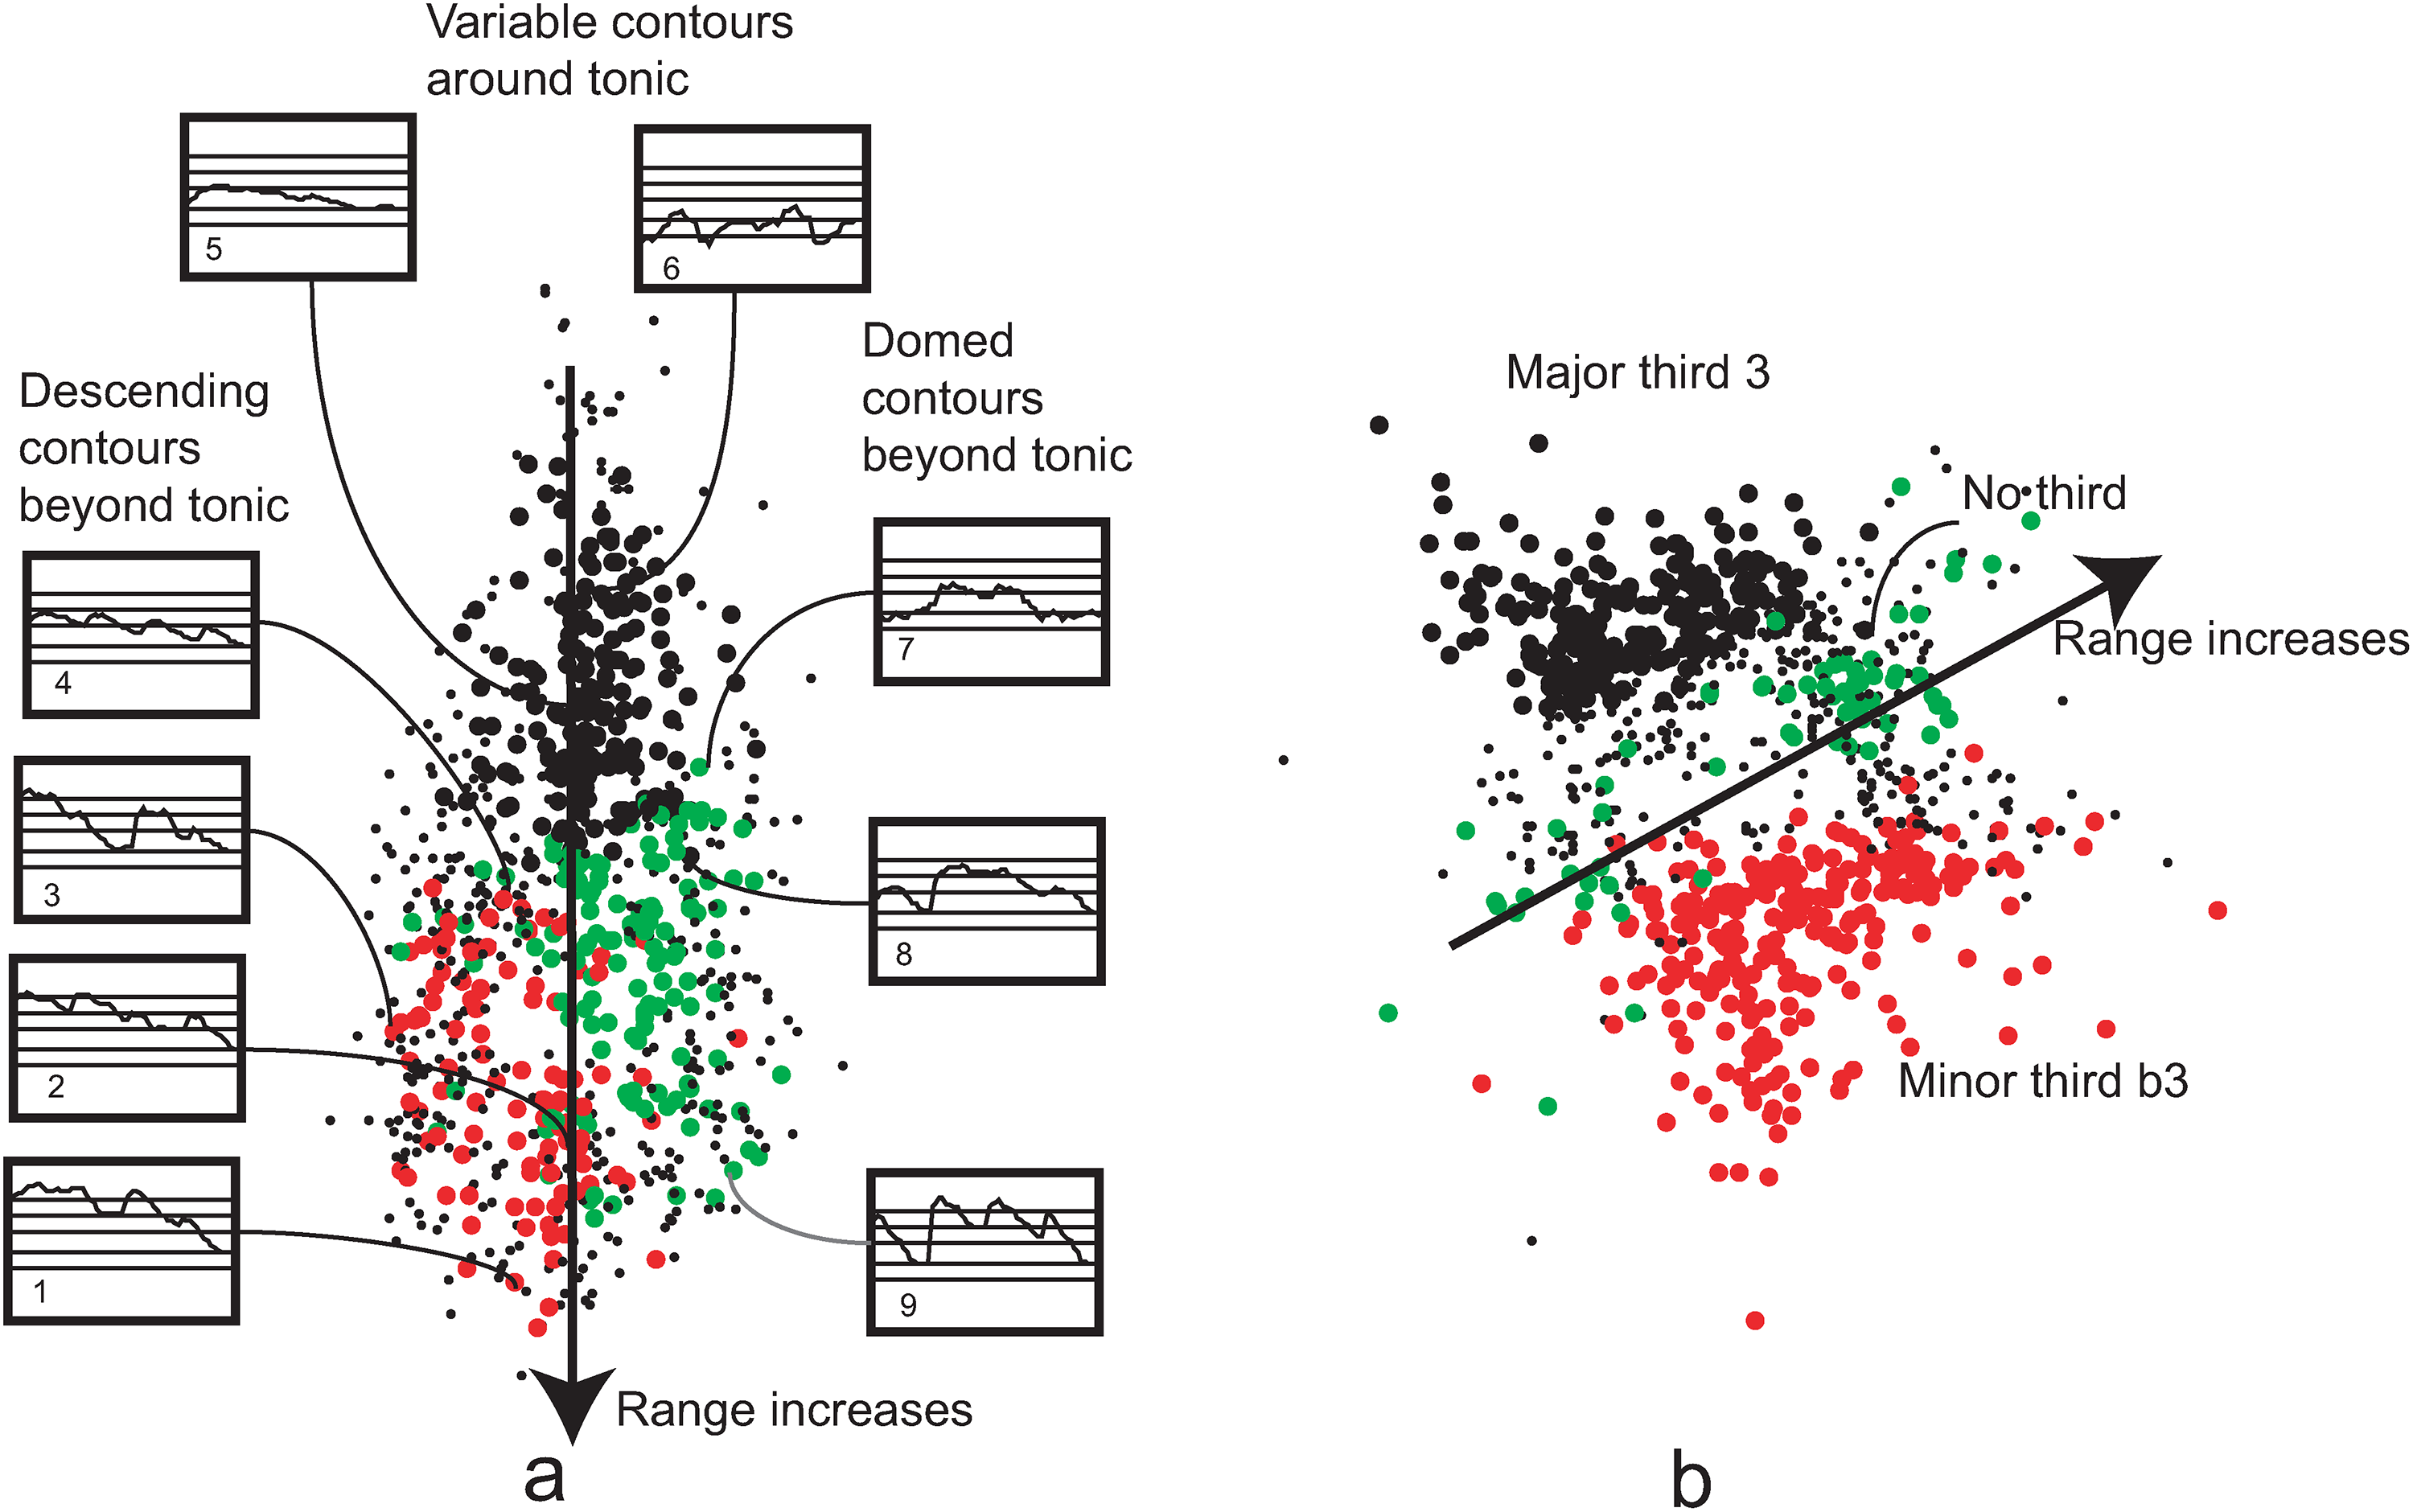
(a) UCT; and (b) UDDT maps of 847 UMTs determined by the SOC algorithm. A: descending contours: red; domed contours: green; even contours: black. B: minor third: red; no third: green; major third: black.
Geographical and Musical Features of the Seven Most Important PCs
As we have shown earlier, the fast reduction of the eigenvalues allows us to reduce the analysis to PCs 1–7 corresponding to the seven highest eigenvalues. The detailed geographical and musical description of PCs 1–7 is provided in file Suppl.Mat1. To clarify our method, we confine ourselves here to the analysis of PC1, but we utilize the results of the overall analysis in the interpretation.
Figure 5 shows the coordinates of PC1, located to their geographical areas. (Coordinates of negligible values are not indicated.) The peaks show that the highest coordinates of PC1 are in Hungarian (Hun), Sekler (Sek), Anatolian Turkish (Tur), and Caucasian Karachay (Kar) cultures. The ancestor culture also has significant footprints in the Volga-Kama region (Cer, Chu, Tat, Bas), and in Finnish (Fin), Inner Asian (Kaz, Mon, Sha, Pek), and native American (Dak, And) cultures. Canadian French (CFR) and Mexican (Mex) cultures are located in the leftmost, Dakota, Navajo, and Andean cultures in the rightmost sides of the map. Sixteenth–eighteenth century German and Hungarian “cultures” (Ald and Ahu) are also separated, in order to reduce the density in Central Europe (see Figure A5-1). The locations of the American cultures are plotted in a separate map in Figure A5-2.

Geographical and musical maps of the hypothetical ancestral culture represented by PC1. Black dots in the musical maps: the most important UMTs in the reconstructed UMT-distribution.
The musical maps in the right upper part indicate UMTs having the highest frequencies in the reconstructed UMT frequency distribution belonging to PC1 (see section “PCA of the UMT Moment Vectors Characterizing the Distributions of the UMTs in the cultures studied”). The big black dots refer to descending contours with both major- and minor-like modes with ranges around one octave, and also descending, minor-like UMTs with ranges around a fifth. A-pentatonic tone sets are also frequent in several melodies belonging to the UMT set of PC1. We show closely related melodies in Example 1, representing the four cultures containing the largest heritages of ancestral culture 1. Example 2 illustrates UMTs having ranges below one octave.

Melody examples belonging to a common UCT in the UCT set of PC1.

Melody examples belonging to a common UCT in the UCT set of PC1.
The main geographical and musical characterization with some melody examples of the entire set of PCs 1–7 is shown in Suppl.Mat1 by the same way. The impact of the corresponding seven hypothetical musical ancestor cultures to the 59 real cultures was studied using the linear combination models generated by the gradient search algorithm (see section “Modeling of Musical Cultures as Weighted Admixtures of the UMT Frequency Distributions of the Most Important PC Vectors” and Appendix 4). We determined the weights providing optimal approximations of the UMT frequency distributions of the cultures in the linear combination models formulated in Equation (6). We interpret the resulting 7-dimensional weight vectors as the “models” of the 59 cultures studied. We show here a systematic overview of the linear combination models where PC1 plays a dominant or a predominant role. Figure 6(a) to (c) show models where PC1 is predominant (a), dominant as a member of the pair of PC1–PC4 (b), of the triad of PC1–PC4–PC7, as well as dominant within a more complex admixture (d). Estimation errors of the linear combination models (ranging between 0 and 1) are shown next to the culture labels.

Weight vectors of cultures dominated by PC1. Order of columns corresponds to culture labels in the diagrams. Horizontal axis: serial number of the PCs. Vertical axis: weights
The musical maps In the rightmost upper parts of Figures S1-1–S1-7 and Figure 5 show that many UMTs with different musical characteristics may belong to a common PC vector. Therefore, we indicate the most typical musical characteristics in the descriptions below (e.g., typical ranges: −2 to 5, −2 to 8; typical contours: descending, (domed); typical scales: minor-like, major-like, A-pentatonic).
The systematic overview of the 7-dimensional linear combination models is provided in Suppl.Mat1. We have found in general that the models of certain cultures are dominated by one given PC, while the other PCs have negligible weights. It seems obvious to consider such PCs as ancient substrate cultures, immediately preserved by certain recent cultures whose models show the exclusive dominance of them. The most convincing exclusive dominances in more cultures were found for PCs 1, 2, 3, while PC5 showed a strong but not totally exclusive dominance in certain cultures. PCs 4, 6, and 7 appear as significant but not predominant components in numerous cultures. We present the roles of these substrate- and additional PCs in the most interpretable models of 50 cultures later. The geographical and musical characterization of the PCs and models are based on Figures S1-1 to S1-7 presented in Suppl.Mat1.
We have shown in Figures S1-1 to S1-7 that most of the cultures studied can be arranged into 12 groups by the similarities of their PC models. (These groups were validated by SOC clustering of the 7-dimensional linear combination model vectors of the 59 cultures studied. The compositions “(2), (2,5), (1,2,5)” and so on in Figure 7 correspond to the maximal components of the 7-dimensional central vectors of the clusters determined by the SOC. The arrangement of the nodes in Figure 7 was modified manually for the purpose of transparency. Thus, Figure 7 maps the musical connections of the cultures, independent of the geographic distribution (see also Suppl.Mat1). The contacts of the 12 groups are represented by the nodes of the graph in Figure 7, where the edges connect nodes having shared PCs. Both of the types in Figures S1-10b and S1-11b are composed by PCs 3, 5, and 6, with the difference that PC3 dominates in the former, whereas PC5 and PC6 in the latter case. As the weight hierarchies are not demonstrated in the graph, these types are combined in one node but the cultures belonging to the two subtypes are given in two different columns in Figure 7.

The system of PC-based models of the cultures studied.
High estimation error values (see Equation (8)) indicate that PCs 1–7 have merely week impacts in 12 cultures (Nav, Lap, Uyg, Jap, Mns, Rod, Tuv, Hak, CFr, Mex, Bur, Altd) probably having different roots or strong autonomous musical layers not belonging to any of the seven hypothetical ancestral cultures. We also allude to these cases in the notes in Suppl.Mat1, but some of them are missing from Figure 7.
Discussion
Performance of the Method
The first step of our processing was the determination of the UMTs that are constructed by central vectors of the local condensations of the contour and degree distribution vector manifolds. Thus, any individual melody can be assigned to the closest UMT, and the clusters of melodies obtained by this method can be considered as variants generated by a common musical idea. This may recall biological mutations and the phylogenetic trees representing biological or even cultural evolution. However, the tree structure seems too specific for modeling folk music cultures, because chains of variations in oral musical cultures may regenerate earlier nodes of the tree. Regeneration by variation was described as an essential mechanism of the conservation of the information in a dynamic model of oral musical traditions (Juhász, 2000; Vargyas, 2005). As loops cannot be ruled out in the graph of connections, we stayed with the cloud representation of the contacts between UMTs (Figure 4).
Our analysis was based on the assumption that the spread of the 847 UMTs in the 59 musical cultures studied may show detectable regularities. To characterize the impact of the 847 UMTs in the 59 cultures, we determined the 59-dimensional UMT moment vectors for each UMT, and the PCA of the 847 pieces of 59-dimensional UMT moment vectors proved to be an appropriate tool to reveal really existing regularities. We have found that the first seven PC vectors provide an appropriate subspace for describing most UMT moment vectors. Therefore we assumed seven ancestral musical cultures in the background of the seven PC vectors, and we estimated the corresponding “musical contents” (847-dimensional UMT distribution vectors) by projections of the 847 UMT moment vectors to the seven PCs (Figure 3).
As we have mentioned earlier, PCA does not necessarily provide the optimal latent space for characterization of vector manifolds. A generalized approach is provided by “Variational autoencoders” trained in order to generate the optimal “latent space models” for concrete cases (Ding et al., 2019; Kingma & Welling, 2014; Rezende et al., 2014; Rocca, 2019). However, latent vectors of the autoencoders are often really similar to PCA vectors (Plaut, 2018; Rolinek et al., 2019). Therefore, the description of the evolutional structure of proteins using a variational encoder proves that the PCA of vector manifolds can be an appropriate tool for our study as well (Ding et al., 2019).
In our study, the fast reduction of the eigenvalues also verified that the PCA produces an appropriate latent space for our musical data. Thus, the seven assumed ancestral cultures provide a realistic model of the roots of real folk music cultures. Consequently, the 7-dimensional linear combination models in Figures S1-1 to S1-7 show a real picture of the impact of the seven ancestral cultures in the 59 descendants. At the same time, our model ignores the effect of inherent evolution of the musical cultures that may even generate totally specific MTs or variants. This may be the reason for the extremely high estimation errors of the models of 13 cultures in our database. In conclusion, we have to keep in mind that our method focuses on the footprints of the ancestral cultures, whereas we omitted other possible interactions. The easily interpretable graph in Figure 7, however, may refer to realistic ancestral roots of the folk music cultures.
Although the graph in Figure 7 is totally connected, the interpretation may be based on four subgraphs indicated by gray areas and letters A, B, C, and D.
Subgraphs A and B
The interaction between PC3, PC6, and PC5 is demonstrated by subgraph A. According to its dominance in Kurdish and Azeri cultures (Kur, Aze), PC3 might be the substrate culture in the Near East (with weaker participation of PC6). We have shown in Figure S1-3 and Example S1-4 that this culture contains dominant minor-like melodies with narrow ranges. This is supported by a more detailed systematic musicological classification of Azeri folk music that reveals different subgroups of melodies having mainly minor-like scales and descending contours ranging between 1-b3 and 1-5 (Sipos, 2004).
We have shown in Figure S1-5 that PC5 dominates in the area between Scandinavia and the Carpathian Basin, on the one hand, and in South Siberia and Inner Asia, on the other hand (subgraph B in Figure 7). We attributed this wide propagation to a prehistoric migration from eastern Europe to South Siberia inferred by genetic and archaeological results. According to our results, the substrate culture indicated by PC5 dominates in certain Siberian and Inner Asian cultures (Kyr, Uyg, Kaz), whereas it remained still a strong component in northeastern Europe combined with PC2 and PC1 – see the cultures represented by nodes (1,5), (2,5), and (1,2,5). The interaction of the substrate cultures represented by PC5 and (PC3, PC6) was detected by the combination of PC3, PC5, and PC6 in several cultures of the Balkans (Bul, Bal, Gre) as well as East Europe and the Baltic area (Russian: Rus, Komi: Pfu, Estonian: Est, Karelian Finnish Runo: Fir). As we have mentioned earlier, the main difference between the two groups lies in the high weights of PC3 in the former and the pair of PC5 and PC6 in the latter cases. This interaction can be well interpreted by the intensive and long-term migration process from the Near East to the Balkans and East Europe through Asia Minor and the Caucasus in the time interval between 6,000 and 3,000 BC (Juhász et al., 2019). The different weights of PC3 and PC6 may be attributed to two different populations both arising from the Near East, one of them colonizing the Balkans, and the other eastern Europe. European melody examples of PC5 with high ranges, major-like scales, and domed contours are shown in Example S1-6, while melodies of minor-like scales and low ranges are found in Example S1-7.
Subgraph C
The main actor of subgraph C is the Western substrate culture represented by PC2 (Figure S1-2 and Example S1-3). The interaction with PC5 in northeastern European cultures Cas, War, and Lit has been discussed earlier, and French and Basque relations can also be interpreted by the known historical contacts. In addition, PC2 has a significant impact in Scandinavian (Finnish: Fin, Norwegian: Nor) and East-Central European (Slovak: Slo, Moravian: Mor, Ruthenian: Rsn) cultures. An important new component not mentioned up to now is PC1, representing the substrate musical culture of the Carpathian Basin and several cultures in the steppe region. Thus, musical cultures assigned to node (1,2,5) have close contacts to the northeastern, western, and Carpathian-Steppe substrate cultures represented by PC5, PC2, and PC1, respectively.
Subgraph D
The central node of subgraph D is just PC1 having predominant impacts in the Carpathian Basin (Sek, Hun), the Caucasus (Kar), the steppe region (Mon, Bur), and also Anatolia (Sipos, 2000) and the Andes region (And), as we have shown in Figures 5 and 6. The interaction of PC1 with PC3 in East Europe (Romanian: Rom, Gagauz: Gag) can be interpreted by the Neolithic or later migrations of Near Eastern and Anatolian populations contributing PC3 to the substrate PC1. The reason for the shared dominance of PC1 and PC3 in Anatolian Turkish (Tur) and Mangistau Kazakh (Mng) cultures may be assigned to a reverse invasion of Turkish people from Inner Asia to Anatolia and the southern Steppe, where the substrate might be PC3 and the contribution might arise from Inner Asia where the inherence of PC1 was indicated in numerous cultures (Mongolian: Mon, Buryat: Bur, Kazakh: Kaz). Systematic musicological classification of Anatolian Turkish and Karachay folk music also distinguished between melody groups of narrow and high ranges, attributing them to Near Eastern substrate populations on the one hand, and the Inner Asian Turkish invasion on the other hand (Sipos, 2000; Sipos & Tavkul, 2015). Melody examples for PC1 having minor-like scales, descending contours, and high as well as medium ranges are found in Examples 1 and 2, in the main text.
The dominance of PC1 in West-Siberian Ob-Ugric culture (ObU) might also arise from the steppe region.
The shared dominance of PC1 with PC4 was observed in Japanese (Jap), two Chinese (Pek, Shn), and Chuvash (Chu) musical cultures, as shown in node (1,4). Although PC4 does not appear as solely dominating ancestral culture in our database, we consider it as the representative of a substrate, since this is the only PC representing consequently G- and A-pentatonic UMTs, with a weaker C-pentatonic contribution (Example S1-5). As both Peking and Shanxi districts of China are in the neighborhood of Inner Mongolia where our Mongolian data arise from, Chinese and Mongolian musical cultures studied here may have close historic contacts to the musical cultures of Nomadic people and empires; for example, Siberian Scythians, Huns, and Avars (Sipos, 1997). The “pentatonic branch” of the graph ends with node (1,4,7). Here, the pair of (PC1, PC4) is complemented by PC7 contributing mainly C-pentatonic UMTs to the model of the cultures in the Volga-Kama region (Cheremiss Cer, Tatar Tat, Bashkir Bas), and in North America (Dakota Dak).
Node (1,5) represents cultures where the Eastern version of PC5 interacts with PC1. Musicological studies have shown numerous major- and minor-like diatonic and pentatonic scales with both narrow and wide ranges in the music cultures of Kazakhs and Uyghurs (Kaz, Uyg) living in the territory of China (Sipos, 2001). On the other hand, 16th–18th century Hungarian melodies (Ahu) are also dominated by PC1 but southern and western contributions are also represented by PC3 and PC2. However, the only component consequently coexisting with PC1 in all of the three cultures is PC5.
Although the preceding discussions focused on detection of common ancient sources of folk music cultures, they do not exclude later culture-specific musical interactions and evolutions (drifts) also strongly determining the folk music traditions documented in the 19th–20th centuries. (As we have mentioned, the quality of our hypothesis is characterized by the estimation error values J of the PC-based linear combination models.) However, appearance of the Near Eastern PC3 and PC6 in northeastern European, the northeastern European PC5 in South Siberian, and the Carpathian-Caucasian-Anatolian PC1 in Chinese and native American cultures can be interpreted only by ancient migrations verified by archeological and archaeogenetic evidences.
Conclusions
In this work, we suggested a digital representation of folk songs by pairs of contour and degree distribution vectors, for comparative structural analysis of a big folk song database. This formulation allowed us to determine the set of UMTs, and the moments of the UMTs in the cultures studied. The PCA analysis of the moment vectors revealed that the UMTs can be grouped into seven hypothetical musical parent languages, while the linear combination analysis revealed that most of the folk music cultures studied can be traced back to the interactions of these seven hypothetical sources. Moreover, three of these sources (deduced from PCs 1, 2, and 3) could be identified as still existing predominant components in cultures between the Carpathian Basin and Inner Asia (PC1), West Europe (PC2), and the Near East (PC3). These results show that comparative folk music analysis applying computer science and mathematical tools can open important new opportunities to understand the origins of music in general.
The organization of our approach arises from the results of correlation analysis detecting simultaneous geographical propagations of certain groups of UMTs and genetic characteristics (mitochondrial haplogroups) (Juhász et al., 2019). These correlations identified associations of UMTs being very similar to the hypothetical musical parent languages shown here, and the corresponding genetic associations could be well interpreted by known prehistoric processes that can be traced back to at least the Bronze Age. At the same time, the results presented here show that an independent, pure musical analysis of folk music cultures that have only been documented in the last two centuries also can reveal these ancient musical parent languages. This result suggests the conclusion that living oral musical traditions preserve ancient roots of music that are much earlier than our written sources. In order to support this statement, most of our Examples S1-1 to S1-9 contain related melodies arising from geographically very distant cultures, suggesting the assumption that the common UMTs standing in the background may arise from common ancient sources, much rather than from interactions in the last few decades or centuries.
We hope that these results may inspire further interdisciplinary studies of folk music, since early musical cultures were strongly attached to the other areas of culture and life, so the study of such correlations is necessary to understand the history of oral musical traditions.
Supplemental Material
sj-doc-1-mns-10.1177_20592043241228982 - Supplemental material for Revealing Footprints of Ancient Sources in Recent Eurasian and American Folk Music Cultures Using PCA of the Culture-Dependent Moment Vectors of Shared Melody Types
Supplemental material, sj-doc-1-mns-10.1177_20592043241228982 for Revealing Footprints of Ancient Sources in Recent Eurasian and American Folk Music Cultures Using PCA of the Culture-Dependent Moment Vectors of Shared Melody Types by Zoltán Juhász in Music & Science
Footnotes
Action Editor
David Meredith, Aalborg University, Department of Architecture, Design and Media Technology.
Peer Review
Yuto Ozaki, Keio University, Graduate School of Media and Governance.
David Meredith, Aalborg University, Department of Architecture, Design and Media Technology.
Data Availability Statement
Data sharing not applicable to this article as no datasets were generated or analyzed during the current study.
Declaration of Conflicting Interests
The author declared no potential conflicts of interest with respect to the research, authorship, and/or publication of this article.
Funding
The author received no financial support for the research, authorship, and/or publication of this article.
Ethical Approval
This research did not require ethics committee or IRB approval. This research did not involve the use of personal data, fieldwork, or experiments involving human or animal participants, or work with children, vulnerable individuals, or clinical populations.
Supplemental Material
Supplemental material for this article is available online.
Appendices 1–4: Mathematical description of the algorithms
References
Supplementary Material
Please find the following supplemental material available below.
For Open Access articles published under a Creative Commons License, all supplemental material carries the same license as the article it is associated with.
For non-Open Access articles published, all supplemental material carries a non-exclusive license, and permission requests for re-use of supplemental material or any part of supplemental material shall be sent directly to the copyright owner as specified in the copyright notice associated with the article.