
Abstract
Cluster analysis provides insight into musical patterns in composition, performance, and perception. Despite its wide adoption in music research, understanding how specific features affect clustering solutions remains challenging. For example, features such as mode (i.e., major/minor), timing, signal amplitude, and pitch are often intercorrelated, making it difficult to understand their specific role within different clusters. To demonstrate how accumulated local effects (ALEs) can help with this challenge, here we analyze 48 excerpts from complete sets of preludes by Bach and Chopin, showing how specific features contribute to two- and three-cluster analyses. These exploratory analyses reveal that ALEs can identify salient or subtle data patterns from cluster analyses by tracking how changes in features affect cluster membership. We explore these insights in visualizations quantifying feature importance and an interactive companion application (https://maplelab.net/feature-importance/) featuring the analyzed audio. Following a demonstration of this method, we suggest how it can be applied to explore topics of interest to researchers in music information retrieval, empirical musicology, and music cognition alike.
Introduction
Music conveys meaning in part through structural features such as pitch, timing, and loudness. Listeners implicitly form expectations about these features and their relations, perceiving meaningful recurrences and deviations in salient musical moments (Huron, 2006). To identify patterns among musical features, music researchers increasingly turn to machine learning methods to explore data using nonparametric, bottom-up techniques. These explorations offer a quantitative counterpart to historical and theoretical accounts of music by evaluating musical phenomena with comprehensive analyses and data visualizations. Cluster analysis has been particularly useful for tracing the stylistic evolution of musical works (Harasim et al., 2021; Weiß et al., 2019), along with patterns in performers’ interpretations (Bisesi et al., 2012) and listeners’ perceptions (Behne, 2004) of them. Although cluster analysis offers a context-agnostic way to detect musical patterns, interpreting the significance of these patterns can be challenging.
Understanding the relative importance of specific features in cluster analyses can be difficult given their intercorrelations. Which specific cues (and groupings of cues) drive clustering outcomes? Lacking adequate tools for assessing feature importance makes it difficult to avoid spurious findings and misguided interpretations. To provide a step toward overcoming these issues, we outline a new approach for clarifying the contributions of specific features. By doing so, we parallel efforts in music information retrieval to improve music classification and recommendation with explainable machine learning methods (Melchiorre et al., 2021; Praher et al., 2021). To illustrate, we analyzed recordings of preludes by Johann Sebastian Bach and Frédéric Chopin, each performed by four internationally renowned performers (Vladimir Ashkenazy, Daniel Barenboim, Pietro de Maria, and Friedrich Gulda). By highlighting differences in the value of mode (i.e., distinction of major vs. minor pieces), timing, dynamics, and pitch for predicting clustering of each set of performances, our findings demonstrate how this suite of techniques can provide new insights into feature patterns. 1 To position this contribution within the literature, we first summarize cluster analysis and its adoption in music research. After demonstrating a new method for explaining clustering, we offer suggestions on how it can aid the interpretation of complex music data, focusing on three promising applications for future research.
A Brief Overview of Cluster Analysis
Cluster analysis refers to a class of unsupervised machine learning techniques evaluating the dissimilarity of measurable attributes. Unlike supervised learning techniques, which assess the effect of variables (or features) on a known label or outcome, clustering is unsupervised—using predictor variables to aid the discovery of interesting data patterns. Early descriptions of cluster analysis date back to the botanist Czekanowski (1911), who used it to explore patterns in the structure of human remains (Soltysiak & Jaskulski, 1999). However, it was not until the late 1930s that the psychologist Tryon began using the technique in behavioral research exploring individual differences (Blashfield & Aldenderfer, 1988; Czekanowski, 1911; Tryon, 1939). The quantitative and feature-agnostic nature of cluster analysis enables biologists to use reasonably objective criteria when developing taxonomic hierarchies for classifying similar species based on measurable characteristics (Michener & Sokal, 1957; Sokal, 1958). Modern computing streamlines previously laborious calculations, offering new possibilities for analysis and classification of large data sets. This means cluster analysis is now used in diverse disciplines such as biology (Sharma et al., 2019), psychology (Shensa et al., 2018; Stenlund et al., 2018), and sociology (Kabók et al., 2017; Stylidis, 2018).
A wide variety of clustering algorithms exist, often differing in manipulable parameters. The choice of clustering algorithm is an important one, as it can affect both methodological decisions and resultant clustering patterns (Rodriguez et al., 2019). 2 One widely used method is hierarchical clustering, which iteratively merges (agglomerative) or separates (divisive) observations, converging on a certain number of clusters (Bridges, 1966). In music, hierarchical methods have guided explorations of musical features’ importance across history and traced changes in how pitch class distributions delineate the major and minor modes (Albrecht & Huron, 2014; Horn & Huron, 2015).
Discovering Patterns in Music
Cluster analysis helps music researchers apply an objective framework to qualitative topics, such as differences in participants’ listening behaviors or musical changes over history. Musical applications of clustering are numerous, including research on the identification of similar sounds (Howard & Silverman, 1976), learning styles (Zhukov, 2007), classes of injuries among musicians (Cruder et al., 2021), and the prevalence of musical styles across cultures (Savage & Brown, 2014). More recently, clustering has been used to map expressive features and structural elements across history, providing insight into Western musical practice (Albrecht & Huron, 2014; Albrecht & Shanahan, 2013; Weiß et al., 2019; White, 2014). A growing body of research employs clustering in tandem with other statistical analyses to provide new insight into music's structure and perception.
Clustering High- and Low-Level Features
Clustering can shed light on patterns delineating abstract categories, such as musical eras, tonal organizations of pitch classes, and perceptual representations of musical meaning. Notably, features at different hierarchical levels can be clustered together to explore salient relations. A cluster analysis might include high-level features describing characteristics of a complete work, such as whether a piece is in a major or minor mode. It may also include low-level features, such as the pitch or amplitude of individual notes. Researchers have also evaluated how clustered low-level features (such as distributions of pitch) explain differences in high-level features like major/minor tonality (Albrecht & Huron, 2014; Harasim et al., 2021) or different musical styles (Behne, 2004; Cowen et al., 2020; Kelly et al., 2021; Weiß et al., 2019). By offering insight into the complex relationships between features, these applications show the potential of clustering to address inquiries more commonly explored with qualitative methods.
Cluster analyses have clarified intriguing shifts in major and minor pieces across four eras of Western music history (between 1400 and 1750; Harasim et al., 2021). For example, Harasim and colleagues developed a probabilistic model to cluster time-weighted pitch class distributions of 13,000 pieces composed between the Renaissance and late Romantic eras. They compared the clustering outcomes with pieces’ nominal mode labeled in music transcriptions, finding the major/minor distinction best characterizes Baroque and Classical music but distinguishes Romantic music less clearly. Another approach employed clustering to assess whether 2,000 compositions from 4 musical eras clustered together based on analyses of 65 stylistic features (Weiß et al., 2019). The authors projected the cluster analysis findings across a timeline of composers’ lifespans, finding that pieces with similar features often came from the same musical era—highlighting important stylistic similarities within, and differences between, eras.
Cluster analysis can inform perceptual research by offering insight into how listeners engage with and perceive music. For example, one longitudinal study clustered German children's responses to a questionnaire including questions regarding biographical and preferential factors about music, to identify distinct listening styles. This enabled the prominence of different listening styles to be traced over the course of development, such as an increase in using music to regulate emotion between ages 11 and 13 (Behne, 2004). Another study used labels from previous cluster analyses to show connections between musical features and listeners’ categorical perceptions of emotion (Kelly et al., 2021). In the latter study, participants listened to previously unheard musical stimuli and assigned each an emotive label during a listening experiment. The authors adopted these labels from a past study exploring changes in musical style across history (Horn & Huron, 2015), clarifying the degree of consistency between computational and perceptual patterns.
Toward an Understanding of Feature Importance
Despite its power, one shortcoming of cluster analysis is its lack of clarity as to how specific features influence clustering. In most applications, researchers first establish how many clusters to explore by using data visualizations like silhouette plots (depicting goodness of clustering), or domain expertise. They interpret the resultant clusters through visualizations or using more subjective analysis techniques (e.g., listening to the analyzed musical works). Although this helps in identifying patterns among analyzed features, it does not clarify how much each feature affects clustering: Some may explain clustering better than others.
Common techniques for addressing which features best explain a cluster analysis include (i) comparing different clustering models to assess which variables should be selected (Raftery & Dean, 2006) and (ii) generating post hoc estimates of feature importance using other analyses (Badih et al., 2019). Although the first approach provides a powerful and rapid solution to clustering problems, automated approaches may not be desirable for certain exploratory applications and often require the use of specific clustering paradigms (i.e., are model-dependent). Consequently, we focus on the second approach for evaluating feature importance. This involves applying supervised machine learning methods in tandem with cluster analysis to learn information from labeled observations.
Evaluating the importance of clustered features often requires subjective judgment. However, recent research has attempted to establish more objective methods for predicting feature contributions through data mining techniques—specifically, using a classification algorithm to learn from a subset of the full data (i.e., a training set), which includes the cluster label of each data point along with the corresponding features for analysis. The classification algorithm then learns feature patterns corresponding to each cluster label. Using information about the features, the algorithm predicts cluster membership of data points in a test set (i.e., the remaining data, excluding cluster labels). This approach essentially estimates importance by applying supervised machine learning to the clustered data, which has proven useful in applications outside of music, including student learning and management of COVID-19 symptoms (Križanic, 2020; Li et al., 2021). For example, one study combined cluster analysis with supervised learning methods to assess management of patients diagnosed with COVID-19 (Li et al., 2021). Clustering patient symptoms revealed groups differing in prognoses and severity of symptoms, allowing the authors to apply methods estimating how different symptoms and treatments affected the likelihood of health deterioration. Here we combine clustering and supervised learning to gain insight into musical works. Specifically, we apply clustering to identify similarities among performances and use supervised learning to clarify the characteristics of different features, as well as their importance, in each group.
Accumulating Feature Effects
We demonstrate a method for estimating the relative importance of features in cluster analyses by applying accumulated local effect (ALE) visualization (Apley & Zhu, 2020)—a recent statistical technique for explaining the output of black-box machine learning algorithms. ALE visualizations provide model-agnostic estimates of variable importance and show how changes in a feature's value can affect cluster membership. The estimates measure feature effects by calculating differences in their predictions along a grid, using the conditional distribution of each feature. Whereas related methods (such as partial dependency plots and M-plots) possess similar interpretive qualities, they calculate features’ average effects across their marginal distributions, leading to unreliable estimates when features intercorrelate (Apley & Zhu, 2020; Molnar, 2020). ALEs avoid problems with previous techniques for modeling variable effects by calculating differences in estimates and accumulating them. Consequently, this approach has the potential to offer unique insights into music's intercorrelated structure—which researchers have previously deemed “hopelessly confounded” (Juslin & Lindström, 2010).
To demonstrate the power of ALEs for revealing patterns in clustering, we cluster mode, timing, dynamics, and pitch values of the first eight measures from preludes in Book 1 of Bach's The Well-Tempered Clavier (WTC) (Bach, 1883 [originally published in 1722]) and Chopin's Preludes (Chopin, 2007 [originally published in 1839]). To provide a degree of control with respect to performer, we used albums by four pianists who recorded both Bach’s (Bach, 1995, 2006a, 2006b, 2015) and Chopin's preludes (Chopin, 1993, 2008a, 2008b, 2010) in their entirety: Vladimir Ashkenazy, Daniel Barenboim, Pietro de Maria, and Friedrich Gulda. By estimating how specific features delineate cluster analysis outcomes, we provide further insight into the musical patterns distinguishing clustered performances. Table 1 outlines the multi-step method we apply to explore musical features’ importance for clustering. This involves first assessing the optimal number of clusters (Table 1; row (a)) before clustering the data (Table 1; row (b)). After training a classification algorithm using the cluster labels (Table 1; row (c)), we evaluate which features best predict pieces’ cluster membership (Table 1; row(d)). To achieve this, we calculate ALE estimates for each feature.
Description of analyses.

Note. Summary of analyses and purpose in present study.
We focus our exploration on sets of well-known preludes by Bach and Chopin to provide a clear example of how these techniques could be applied to music research. We accompany our explorations with an interactive application (https://maplelab.net/feature-importance/) allowing readers to critically compare our musical descriptions to the auditory characteristics of the analyzed performances. Table 1 summarizes the analyses applied in the present study to (a) predict optimal clustering, (b) cluster data, and (c, d) predict feature importance; Figure 1 summarizes this information in a flowchart.

Sequence of analyses.
Methods
Encoding Musical Features
We analyzed a data set containing the number of distinct note attacks, pitch height, and nominal mode (as defined by the composer) from the first eight measures (appending pick-up measures where applicable) of each prelude in Bach's The Well-Tempered Clavier and Chopin's Preludes. Previous studies in empirical musicology (Poon & Schutz, 2015) and music psychology (e.g., Anderson & Schutz, 2022; Battcock & Schutz, 2022; Chowdhury & Widmer, 2021) have analyzed these corpora, providing an opportunity for exploring the broader musicological and perceptual implications of these analyses. Here, we limited our selection to eight-measure excerpts (appending pick-up measures where applicable) for methodological consistency with parallel work involving perceptual experiments.
Using the note attacks, we measured the attack rate of four performers’ interpretations of each piece. To achieve this, we divided the total number of attacks in the score by the duration of the same eight measures interpreted by each performer. Attack rate takes the combined effect of tempo and rhythmic structure into account—resolving ambiguity when pieces have similar tempi but different rhythmic schemes (Schutz, 2017). We encoded the average pitch from the score of each excerpt with keyboard numbers, collapsing across measures. We treated mode as a binary feature (major vs. minor).
Finally, we used Audacity to measure energy in each performance, taking the root mean squared (RMS) amplitude of the first eight measures in 16-bit waveforms of the excerpts (The Audacity Team, 2000). Because RMS amplitude values can differ according to recording conditions, we centered and scaled values within each recorded album. Attack rate and signal amplitude precisely capture differences in the dynamics and timing of performers’ interpretations; score-notated pitch and mode provide stable representations of composed features remaining reasonably consistent across different interpretations of the same piece.
Cluster Analysis
To examine differences between performances of each composer, we performed separate hierarchical cluster analyses of the Bach and Chopin pieces, using the attack rate, RMS amplitude, pitch height, and mode values of each excerpt. Performed pitches and mode are structural features and consequently remained consistent across different performers’ interpretations; conversely, timing and RMS amplitude differed across interpretations. We performed agglomerative hierarchical clustering, which accounts for differences between elements by measuring their distance. A “bottom-up” process differentiates clusters: every observation first comprises a unique cluster before they are iteratively fused to form a number of clusters specified by the analyst (Rodriguez et al., 2019).
Optimizing Cluster Solution
The supplemental material reports on the justification for choosing the number of clusters and linkage methods for clustering performances of each composer. The most suitable analyses comprised two clusters, using Euclidean distances and the average linkage method. We removed mode as an input to the two-cluster solutions and further related analyses because the output for both composers simply divided major and minor pieces.
To test the robustness of these methods, we performed additional cluster analyses using three clusters to evaluate ALEs in a multi-class context. In these analyses of both composers, we prepared separate three-cluster solutions using Ward's D linkage (Ward, 1961). We accounted for the mixture of continuous (attack rate, pitch height, RMS amplitude) and categorical (mode) variables using Gower distances (Maechler et al., 2022).
Understanding how features affect clustering requires disentangling their collinearity and quantifying their relative contributions. We suspected that these works may exhibit collinearities between features because past work has shown systematic relations between features in these sets. For example, Poon and Schutz (2015) compared timing of Bach's major and minor preludes using a score-based measure of attack rate. They reported that his major preludes were on average ∼55% faster (M = 6.87; SD = 2.06) than his minor preludes (M = 4.42, SD = 2.08). This pattern is not unique to one interpretation, as they found it consistent across seven different editions (another analysis found it consistent across seven commercially available recordings; Battcock & Schutz, 2021). Regarding pitch, Poon and Schutz reported that Chopin's major preludes are on average ∼3.2 semitones higher (M = 41.7; SD = 5.37) than his minor preludes (M = 38.6; SD = 6.51).
To overcome potential multicollinearity issues, we first used a random forest (RF) classification algorithm in R to assess how specific features predict cluster membership as a step for further analysis (for a technical overview of RFs, see Breiman, 2001). 3 Splitting the data into training and test sets, we used RFs to predict the cluster of each test set piece using the analyzed features as predictors. This clarified which features most strongly predicted the correct assignment of pieces into their corresponding clusters.
Quantifying Feature Importance
ALEs can estimate features’ effects on the output of a machine learning algorithm (Apley & Zhu, 2020), enabling detailed summaries of feature importance (Molnar, 2019). Accumulating local effects from the fitted RF model enabled clarifying (i) the predictive values of individual features to the clustering algorithm (as well as to individual clusters) and (ii) how changes in features’ values affect the probability that a piece belongs to a given cluster. Table 1 (in Introduction) summarizes each stage in the analysis outlined below and provides descriptions of the algorithms employed.
Interpreting ALEs
ALEs depict how changes in the values of features affect predicted outcomes. ALE plots depict feature values along the x axis and the associated main effect compared to the average data prediction along the y axis. In the present analyses, this highlights how changes in attack rate, RMS amplitude, and pitch height affect probability of membership within different clusters. ALEs for categorical features (such as mode) depict how changing categories affects outcomes, and they are sensitive to ordering effects (Molnar, 2019). In the three-cluster solutions, we examine how changing from major to minor mode affects clustering outcomes using the ingredients package in R (Biecek & Baniecki, 2023).
Results
Comparing Performance Features
To assess relationships between features, we prepared correlation tables for mode, attack rate, RMS amplitude, and pitch height in the four performers’ interpretations. We found significant correlations between three out of six features for the Bach and four out of six features for the Chopin (see supplemental material for details). 4 We also measured differences in the four performers’ attack rate and RMS amplitude. This revealed relatively consistent timing and loudness among interpretations of the same works. Kruskal Wallace rank sum tests showed no significant differences in attack rate and RMS amplitude of the four performers (see supplemental material). The absence of significant differences between performers’ loudness and timing suggested that different performance interpretations of a piece would cluster together.
Herein we refer to the clusters in the two-cluster solution as “B2a” and “B2b” for Bach, and “C2a” and “C2b” for Chopin. 5 We refer to clusters in the three-cluster solution as “B3a,” “B3b,” “B3c” for Bach and “C3a,” “C3b,” and “C3c” for Chopin.
Two-Cluster Solution
Clustering provides insight into feature-driven similarities between musical performances. The outer panels of Figure 2 depict scatter plots of the attack rate, RMS amplitude, and pitch height of each performance of Bach (left) and Chopin (right). Shades of green distinguish renditions of Bach, whereas shades of purple distinguish Chopin. For Bach, B2a performances exhibit a lower attack rate, a wider range of RMS amplitude, and a higher pitch than B2b pieces. In Chopin performances, RMS amplitude and timing distinguish clusters weakly, showing considerable overlap. C2a pieces are much higher in pitch than C2b pieces, with no overlap between clusters.
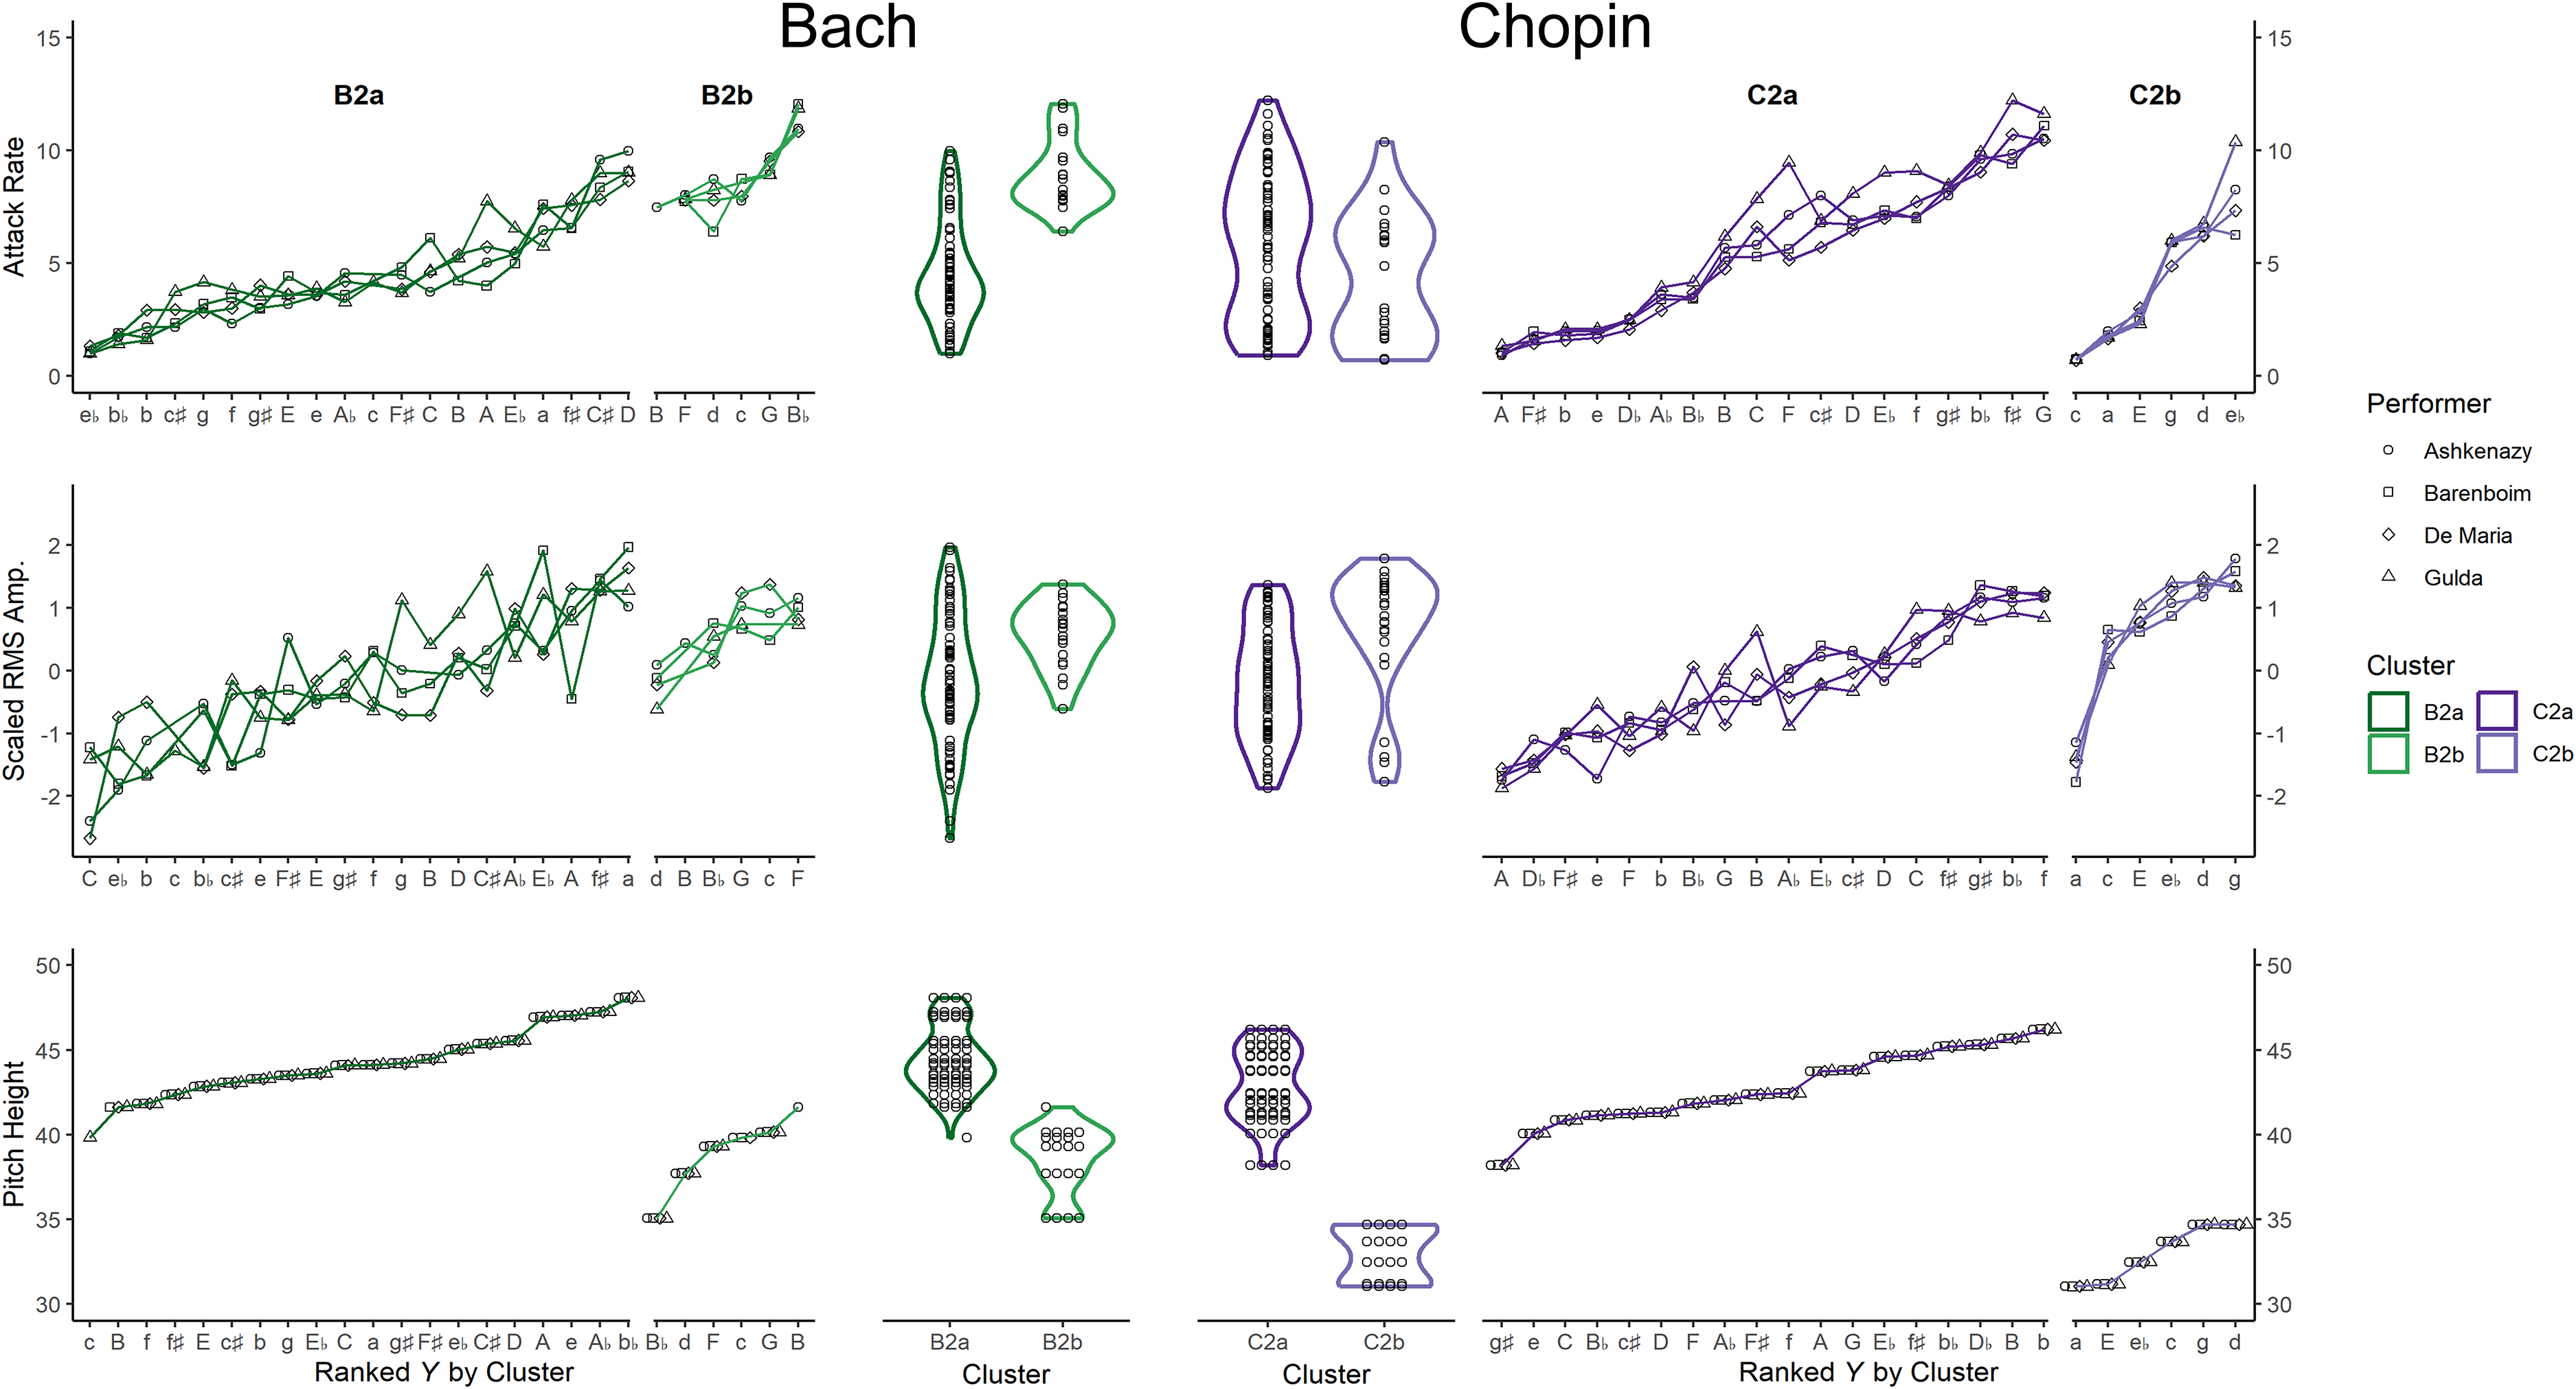
Feature patterns in two-cluster analysis.
The inner panels of Figure 2 clarify features’ relative contributions to the cluster analysis, depicting kernel density estimates of the outer panel values. The clustered Bach performances show a greater distinction in timing and amplitude than the Chopin performances, supported by a wider separation between the distribution of values in each cluster. Pitch most strongly demarcates clusters, suggesting it plays a central role.
Two-Cluster Feature Importance
Although Figure 2 clarifies how features differ between clusters, the importance of those features for clustering remains unclear without further analyses. To understand how well different features predict clustering, we trained a random forest algorithm on 80% of the pieces (i.e., training set) to predict the clusters of the remaining 20% (i.e., test set). 6 We used the same features as predictors (attack rate, RMS amplitude, and pitch height) and the cluster label as the classifier. The random forest comprised 500 trees and used one variable at each split (out of bag estimate of error rates from RF model: 2.63% for Bach; 0% for Chopin).
Next, we unpacked the RF predictions by estimating ALEs using the DALEX package in R (Biecek, 2018). This provides insight into how the RF algorithm used information from features to classify test set pieces. ALEs estimate changes in feature effects while accounting for multicollinearity by estimating differences within a “window” of the feature values (see Molnar, 2019 for summary and implementation details; Apley & Zhu, 2020). This method allows us to observe how specific values of attack rate, RMS amplitude, and pitch influence the probability of pieces’ assignment to each cluster. To understand differences in feature importance between clusters, we calculated RF importance estimates, which compare the number of correct classifications in the test data with random permutations of the same data, doing so for each feature. The difference in classification results between the test data and randomized data gives a numeric estimate of importance within each cluster (Breiman, 2001).
Figure 3 illustrates how differences in attack rate, RMS amplitude, and pitch height (top to bottom) affect the probability of correctly assigning a piece into its corresponding cluster. A single point along each curve in the outer panels represents the maximum ALE estimate in each cluster. For both composers, the outer panels depict how changes in feature values affect the probability of correctly assigning a piece to the respective cluster.

Accumulated local effects and importance estimates for two-cluster analysis.
For Bach (left), attack rates below 5.25 attacks per second (APS), amplitude below −1.01 (standardized), and pitch heights above 44.4 most strongly predict assignment of pieces to cluster B2a, whereas attack rates above 11.4, amplitude above 0.55, and pitch heights below 38.3 (∼B-flat3) yield the highest probability of assignment to B2b. Notably, the probabilities associated with cluster B2a are generally higher than those associated with B2b. This reflects a difference in sample size: B2a contains more pieces, so the probability that a piece will be assigned to it is generally higher. Differences in pitch explain clustering most, with pitches at the higher end of the distribution most predictive of cluster B2a, and pitches at the lower end most predictive of B2b. The inner left panel of Figure 3 depicts importance estimates from the random forest model. The estimates indicate pitch is most important for distinguishing clusters, followed by attack rate, and RMS amplitude.
The right panels of Figure 3 reveal a different pattern of feature importance for Chopin. The flatness of the ALE curves for attack rate suggests that increasing attack rate only marginally affects clustering. C2a reaches the highest ALE at attack rates above 8.75 APS, whereas C2b peaks at 1.75 APS. The ALE profile for signal amplitude is similarly flat, peaking at RMS values below −0.48 for C2a and above 1.43 for C2b. Of all cues, pitch affects clustering most strongly: The estimated probability of assigning pieces to cluster C2a rises from 20% to 96% at pitch heights above 40.3 (∼C4). This shows high-pitched pieces are far more likely to be clustered in C2a than C2b. The inner panels depict RF importance estimates for both composers, indicating pitch most strongly predicts clustering, whereas attack rate and RMS amplitude play weaker roles.
Three-Cluster Solution
Analyzing a three-cluster solution can illustrate how ALE visualizations clarify feature predictions in multiple classes. The outer panels of Figure 4 show differences in performance features from three-cluster analyses of the same performances. For both composers, major pieces appear in one cluster only, whereas minor pieces split into two clusters. Attack rate and RMS amplitude differ between the minor clusters of the Bach and Chopin performances, with a fast/loud cluster (Bach: B3b, Chopin: C3b) and a slow/soft cluster of performances for both composers (Bach: B3c, Chopin: C3c). Although pitch distributions differ among Bach's minor clusters, they show more overlap in Chopin's (bottom inner panels). To estimate how feature values influence clustering, we next visualized the ALEs in the three-cluster solution.

Feature patterns in three-cluster analysis.
Three-Cluster Feature Importance
We next evaluated how ALEs explain differences in clustering among the three-cluster analyses. These analyses included mode, enabling assessment of its effect on clustering. Before calculating ALEs, we trained RFs on the data from the three-cluster solution using the same hyperparameters as the two-cluster solution. The model successfully classified all pieces into the corresponding clusters (out of bag error estimates: 0% for Bach; 0% for Chopin). The outer panels of Figure 5 depict ALEs from the three-cluster solution; the inner panels depict local differences in variable importance between clusters from the RF classifier. To highlight how features play distinctive roles in each cluster, we briefly summarize their contributions below.

Accumulated local effects and importance estimates for three-cluster analysis.
Timing
Attack rates between 4.42 and 5.32 APS predict cluster B3a membership most strongly. Faster attack rates distinguish cluster B3b, reaching the highest classification probability above 6.94 APS. Slow attack rates below 2.48 APS predict assignment to B3c. B3b and B3c reach higher maximum ALEs (0.57 and 0.58, respectively) than B3a (0.31), indicating a stronger predictive role of timing. For the Chopin performances, attack rates between 2.9 and 3.6 APS predict cluster C3a, whereas attack rates above 9.27 and near 0.77 maximally predict C3b and C3c, respectively. The ALE profile of C3c exhibits a higher peak (ALEmax = 0.53) than C3a (0.36) and C3b (0.42), suggesting timing plays a more prominent role. For both composers, timing plays the second strongest role, next to mode, in distinguishing clusters.
Dynamics
For the Bach performances, RMS amplitudes near 0.65 most strongly predict B3a, whereas values above 1.56 and below −1.14 predict B3b and B3c, respectively. For the Chopin performances, RMS amplitude values near 0.68 distinguish cluster C3a, whereas values above 1.08 and below −0.89 predict C3b and C3c, respectively. The ALE curve of C3b reaches the highest peak (ALEmax = 0.48), suggesting the strongest predictive role of RMS amplitude compared to C3a (ALEmax = 0.36) and C3c (ALEmax = 0.45).
Pitch Height
Pitch height near 42.8 (near E-flat4) best predicts assignment to Bach cluster B3a. The maximum ALE of B3b is slightly higher, peaking at a pitch height of 39.8 (near C4), whereas B3c peaks at 47.1 (near G4). However, changes in pitch affect the corresponding ALE profiles minimally, suggesting pitch weakly predicts clustering. For Chopin performances, pitch height of 41.5 (near D4) predicts C3a most strongly, whereas pitch near 41.2 (near C-sharp4) and 31.2 (E-flat3) yield the highest ALEs for C3b and C3c. Again, ALEs vary minimally with changes in pitch, suggesting a weak role in clustering.
Mode
As with continuous variables, we can estimate ALEs of categorical variables. 7 In the Bach performances, major mode strongly distinguishes cluster B3a (ALE = 0.74; minor: ALE = -0.08). Conversely, the minor mode distinguishes clusters B3b (ALE = 0.43; major: ALE = 0.23) and B3c (ALE = 0.64; major: ALE = 0.02). For Chopin performances, major mode strongly predicts C3a (ALE = 0.73; minor: ALE = -0.06), whereas minor predicts assignment to C3b (ALE = 0.61; major: ALE = 0.06) and C3c (ALE = 0.45; major: 0.21). RF importance plots show that mode explains clustering most strongly, followed by attack rate. Signal amplitude and pitch height play the weakest role in explaining clustering of performances for both composers. However, RMS amplitude distinguishes clusters more prominently than pitch height for Chopin.
Discussion
We have demonstrated a method for estimating feature importance in cluster analyses of musical works, applying this method to prelude performances of Bach and Chopin by four pianists. Estimating the importance of clustered features with accumulated local effects clarified how specific values of pitch, timing, loudness, and mode affected two- and three-cluster analyses of the same data. As our goal is to explore new analytical possibilities, rather than a priori hypotheses, we focus our discussion on how these approaches can be applied in future music studies to better understand the outcomes of cluster analyses. To support our discussion, we highlight findings from our results to illustrate the strengths of feature importance estimates for clarifying observed patterns. We focus on applications for studies (i) connecting musical patterns to the perceptual responses they elicit, (ii) comparing performance patterns in different corpora, and (iii) exploring historic changes in music.
Estimating Importance to Perception
Researchers increasingly apply machine learning techniques to clarify relationships between music's structural features (from low-level acoustic features to mid-level perceptual ones) and participants’ perceptual responses (Chowdhury & Widmer, 2021; Cowen et al., 2020; Zhukov, 2007). Estimating the importance of analyzed features can help researchers identify which ones to assess in perceptual experiments. Importance estimates possess similar interpretability to explained variance in regression analyses. For example, a regression-based analysis in one perceptual study explored how manipulating 6 musical features affected listeners’ responses to 200 pieces conveying 4 target emotions (Eerola et al., 2013). The authors found that mode explained the most variance in listeners’ responses, followed by tempo (timing), register (capturing pitch), and dynamics (along with articulation and timbre; cf. Juslin & Lindström, 2010; cf. Scherer & Oshinsky, 1977). In our study, feature importance estimates offer similarly straightforward interpretations. For example, we found pitch was most important for explaining our two-cluster analyses, followed by timing and RMS amplitude. Curiously, pitch was among the least important features (along with RMS amplitude) in the three-cluster analyses—with mode taking the lead role in predicting clustering, followed by timing.
Estimating Importance to Performances
Feature importance estimates can help explain how different performers interpret musical works. Cluster analysis applications have explored differences in how listeners perceive different interpretations of the same work (Namba et al., 1991), as well as different performers’ use of interpretive cues like dynamics and musical phrasing (Bisesi et al., 2012; Ellis et al., 2018). Researchers have also applied clustering to explore how expert musicians perceive local structural events in Chopin's preludes (Bisesi et al., 2012) and how performers apply expressive timing and dynamics in his mazurkas (Kosta et al., 2018; Li et al., 2017). Other work has explored clusters of adjectives describing different performance interpretations. Cancino-Chacón et al. (2020) found listeners used similar adjectives to describe different interpretations of the same pieces; however, unusual performance characteristics could affect perceptions of expressivity. ALE estimates may offer additional insights into performance interpretations by identifying differences in the importance of expressive features. For example, our analyses revealed that most performers’ interpretations of Bach's C-minor prelude showed enough similarities in timing and dynamics to be clustered together; however, the two-cluster analysis separated Gulda's performance from the other interpretations. His performance was slower than the other performers’, suggesting his unique interpretation of timing led to this difference in clustering. Figure 2 reveals that Gulda's interpretation is the only one with an attack rate below five attacks per second. Timing ALEs indicate that attack rates below this value strongly predict assignment to B2a (the slower cluster), helping explain why Gulda's interpretation followed a different clustering pattern (Figure 3).
Feature Importance in Different Eras
Adoption of clustering to map structural elements across history has proven particularly valuable for exploring changes in Western musical practice (Albrecht & Huron, 2014; Harasim et al., 2021; Horn & Huron 2015; Weiß et al. 2019). For example, Horn and Huron (2015) used this technique to examine how mode's relationships with timing, dynamics, and articulation changed between the Classical and Romantic eras—periods reputed for notable stylistic differences. In pieces sampled from the Classical era, the authors concluded mode played a prominent role in separating clusters, followed by combinations of loudness and timing. In contrast, mode's role in separating clusters in Romantic era pieces was overshadowed by combinations of these prosodic cues. In future work, incorporating importance estimates will clarify the extent to which such feature patterns hold. Another study (Harasim et al., 2021) explored stylistic changes between the Renaissance and Romantic eras with clustering techniques. There, the authors used clustered pitch class distributions to predict mode (i.e., major vs. minor) in analyzed MIDI files. They evaluated these estimates against mode labels from each file's metadata to evaluate how clearly the major/minor distinction distinguished pieces from different eras—finding lower clarity in the Romantic era. Mode labels in the metadata provided a clear ground truth category against which the authors could compare results. Unlike that study, however, many exploratory applications of cluster analysis have no clear ground truth. For example, patterns of timing, dynamics, and pitch do not necessarily map onto any specific expressive category in our analyses. In these cases, feature importance estimates can help reduce spurious interpretations of data patterns.
Avoiding Misinterpretations of Clusters
Importance estimates can mitigate spurious interpretations by helping music analysts decide which features should receive more attention when comparing different cluster analyses. Here, two-cluster analyses of performances clearly separated high- and low-pitch pieces into distinct clusters for both composers (Figure 2, bottom panel). Although analyses of both composers revealed a cluster with high-pitched pieces (Bach: B2a; Chopin: C2a), ALEs suggest that high pitch was more important in the Chopin cluster analysis. Specifically, pitch heights above 40.3 yield a maximum ALE of 0.96 in C2a. Conversely, for the Bach pieces, pitch heights above 44.4 reach a maximum ALE of 0.86 in B2a (Figure 3). Importance estimates from the random forest support this difference in pitch. Consequently, although pitch strongly influenced clustering for both composers, it better explains the clustering of Chopin's works.
ALEs can also help identify differences in importance within a cluster analysis. In the three-cluster analyses, Chopin's minor pieces divided into two clusters—one with fast timing and high amplitude (C3b) and the other with slow timing and low amplitude (C3c; Figure 4). The right panel of Figure 5 reveals differences in the predictive value of timing and dynamics— specifically, attack rate ALEs reach a higher maximum value for C3c (ALEmax = 0.53) than C3b (ALEmax = 0.42), indicating attack rate is more important to the former. Conversely, ALEs reach similar maximum values for amplitude in C3b (ALEmax = 0.48) and C3c (ALEmax = 0.45), showing a comparable effect of amplitude on both clusters. This difference in importance, supported by RF importance estimates, shows that timing explains some clusters better than others.
Finally, ALEs can provide insight into how the importance of individual features might differ across two cluster analyses. Cluster analyses excluding mode show a clear separation in pitch between clusters (Figure 2). Conversely, when including mode, clusters in the three-cluster analyses show greater overlap in pitch (Figure 4). ALEs and importance estimates reveal a marked difference in pitch's role between two- and three-cluster solutions. Pitch explains clustering most strongly in the former analyses (Figure 3), yet it explains clustering poorly in the latter (Figure 4)—suggesting the inclusion of mode affects clustering patterns.
Limitations and Future Directions
Although feature importance estimates can help unpack patterns in musical works, it is important to recognize their limitations when interpreting findings. First, they assume a cluster's label provides a suitable stand-in for “ground truth” labels. However, combining clustering with supervised machine learning algorithms in this way can sometimes lead to problematic overfitting. This may cause the fitted model to explain features in the present data set with great accuracy but poor generalizability to other data sets (Zhu & Goldberg, 2009).
A second limitation concerns how we operationalize “importance.” We adopt the term's use in machine learning studies, referring to a feature's usefulness in predicting classifications (see Breiman, 2001, for example). Although these estimates capture strengths and weaknesses of clustering outcomes, they ignore perceptual, aesthetic, or experiential perspectives of “importance” (see Thompson et al., 2022 for review of how such ignored elements affect music perception). Consequently, the “actual” importance of ALEs for understanding musical style and perception is questionable if data are poorly clustered or if features have no useful relationships. Such problems might be mitigated by optimizing clusters through silhouette coefficients or related techniques for evaluating goodness-of-clustering (Rousseeuw, 1986). Ultimately, ALEs can mitigate inaccurate explanations of a cluster analysis, but they cannot mitigate bad clustering.
Finally, our data set is modestly sized by machine learning standards. This makes our findings difficult to generalize beyond the scope of the present study. We chose these data as they enable straightforward initial explorations of this technique through data visualizations and audio demonstrations. Additionally, using carefully analyzed excerpts from multiple performers provides a degree of control when conducting analyses of historically important music. However, the narrow scope of these data reduces their suitability for direct hypothesis testing. Because of these limitations, we decided not to report second-order ALE effects, though we provide an example and interpretation in the supplemental material. Future work with larger data sets could provide a more detailed example of these tools’ breadth of application.
Conclusion
Here we demonstrate a novel method for estimating the importance of clustered musical features. These explorations helped explain patterns in timing and dynamics from four professional pianists’ interpretations of Bach and Chopin—contributing to a larger body of work applying cluster analyses to musical stimuli. Future applications of these methods can provide additional insights into how musical works are structured by composers, interpreted by performers, and perceived by listeners. With a growing availability and accessibility of complex analysis toolkits, quantitative analyses on extensive corpora will shape the future for understanding patterns distinguishing different works. Establishing methods to unpack features’ individual effects in musical analyses will clarify their relative importance to composition, performance, and perception alike.
Supplemental Material
sj-pdf-1-mns-10.1177_20592043231216257 - Supplemental material for Understanding Feature Importance in Musical Works: Unpacking Predictive Contributions to Cluster Analyses
Supplemental material, sj-pdf-1-mns-10.1177_20592043231216257 for Understanding Feature Importance in Musical Works: Unpacking Predictive Contributions to Cluster Analyses by Cameron J. Anderson and Michael Schutz in Music & Science
Supplemental Material
sj-docx-2-mns-10.1177_20592043231216257 - Supplemental material for Understanding Feature Importance in Musical Works: Unpacking Predictive Contributions to Cluster Analyses
Supplemental material, sj-docx-2-mns-10.1177_20592043231216257 for Understanding Feature Importance in Musical Works: Unpacking Predictive Contributions to Cluster Analyses by Cameron J. Anderson and Michael Schutz in Music & Science
Footnotes
Acknowledgments
We would like to thank Max Delle Grazie for analyses of the scores studied, as well as Victor Kuperman for his helpful suggestions that inspired part of this project. Finally, we thank the reviewers for their invaluable feedback.
Action Editor
David Meredith, Aalborg University, Department of Architecture, Design and Media Technology.
Peer Review
Daniel Apley, Northwestern University, Department of Industrial Engineering and Management Sciences.
Carlos Cancino-Chacon, Johannes Kepler University Linz, Institute of Computational Perception.
Author Contributions
CA developed the analysis framework, created R code for analyses, performed the literature review, and wrote and edited the manuscript; MS performed project management, supervised writing, provided guidance on figure development, and edited the manuscript.
Declaration of Conflicting Interests
The authors declared no potential conflicts of interest with respect to the research, authorship, and/or publication of this article.
Ethical Approval Statement
This study did not require ethics committee or IRB approval. The study did not include personal data, fieldwork, experimental data from human or animal subjects, or work involving children, clinical populations, or vulnerable individuals.
Funding
The authors disclosed receipt of the following financial support for the research, authorship, and/or publication of this article: This work was supported by the Social Sciences and Humanities Research Council of Canada (grant number 435-2018-1448) and the Canada Foundation for Innovation (grant number CFI-LOF 3010).
Data Availability Statement
Supplemental Material
Supplemental material for this article is available online.
Notes
References
Supplementary Material
Please find the following supplemental material available below.
For Open Access articles published under a Creative Commons License, all supplemental material carries the same license as the article it is associated with.
For non-Open Access articles published, all supplemental material carries a non-exclusive license, and permission requests for re-use of supplemental material or any part of supplemental material shall be sent directly to the copyright owner as specified in the copyright notice associated with the article.