
Abstract
COVID-19 has profoundly disrupted national education systems, affecting the future well-being of school-age children. Bacher-Hicks and colleagues showed that the intensity of the search for online learning resources in the United States doubled with respect to pre-COVID-19 levels. However, areas of the country with higher incomes, better internet access, and fewer rural schools experienced significantly greater increases in search intensity. Using a similar method to study the case of Spain, we analyze the evolution of search intensity for a selection of digital educational resources over the period 2015 to 2021. Special attention is paid to the period of COVID-19 pandemic, namely, March 2020 to June 2021. The findings include a widespread rise in the use of digital resources with respect to the use in the last 5 years, which varies by digital educational resource and region. However, the use of digital resources in Spain does not seem to vary according to family income, at least in relation to open access digital educational resources. In addition, there appears to be a steady decline in search intensity for digital educational resources and a certain degree of substitutability following the surge due to the pandemic and the school closures.
Introduction
As the 2020/2021 school year comes to an end in Spain, the question of how the COVID-19 crisis has affected the welfare of school-age children remains unanswered. More specifically, to what extent has information and communications technology (ICT) reduced the impact of the pandemic? On 13 March, 2020, the Spanish education system underwent a government-imposed shutdown, which forced students to stay at home until the end of the 2019/2020 school year and led to major restrictions in the education system in the 2020/2021 school year.
Regarding what we already know at an international level, Bacher-Hicks et al. (2020) used internet search data to analyze in real time how U.S. households searched for online learning resources while schools were closed during the COVID-19 pandemic. Their study showed that, nationwide, the intensity of the search for online learning resources doubled with respect to pre-COVID-19 levels. However, areas of the country with higher incomes, better internet access, and fewer rural schools experienced significantly greater increases in search intensity. The authors concluded that the COVID-19 pandemic is likely to widen achievement gaps because different schools and families interact differently with online resources to compensate for lost learning time at school.
The cited study highlights an important academic and social debate. In the knowledge economy, COVID-19 and its effects must not be allowed to place current educational outcomes at risk, regardless of whether these outcomes are considered sub-optimal in terms of learning and educational attainment. Today, an economy’s growth potential and international competitiveness depend on the performance of the education system (Psacharopoulos et al., 2020). Furthermore, while COVID-19 has had an immediate impact on economic activity through temporary business closures and furlough schemes, widespread, prolonged closures of schools will have long-term effects, given the vital role of human capital in long-run economic growth (Fuchs-Schündeln et al., 2020).
Predicted Effect of COVID-19 on Learning and Future Graduate Salaries
Burgess and Sievertsen (2020) reported that the closure of schools in the last term of the 2019/2020 school year will negatively affect student learning by 6% of the standard deviation (equivalent to what is learnt in 2 months) and will reduce the future salaries of current students by 1%. Their conclusions are based on the research by Lavy (2015), who analyzed data from the Organisation for Economic Co-Operation and Development (OECD) on the Programme for International Student Assessment (PISA). Following analysis of the results of 400,000 students from 50 countries, it was found that 1 hr more per week throughout the school year (the same amount of school time as in the last term of the 2019/2020 school year) in core subjects increases exam performance by around 6% of the standard deviation. This amount corresponds to the difference in academic achievement between Spain and the OECD average. The main problem is that this impact will be non-uniform. There will be a small effect on students from advantaged backgrounds but a large effect on disadvantaged students and those who have fallen behind. Doing schoolwork from home while schools are closed partly relies on the educational skills and competencies of parents or guardians and heavily depends on access to and use of new technologies. ICTs are especially important, and their availability also depends on household income. Therefore, a greater negative impact on pupils from more disadvantaged households may be expected.
The economic and employment situation of families is another potential source of unequal opportunities. A student’s likelihood of graduating from school is significantly lower when parents or guardians have temporary employment contracts (Ruiz-Valenzuela, 2020). Similarly, when unemployment rates increase, students’ performance in mathematics may decrease by almost 8% (Ananat et al., 2011). In fact, the probability of repeating a school year in Spain is four times higher at different socioeconomic levels, even when the level of skills is similar (Gortázar & Moreno, 2017).
The reduction in the competencies, skills, and knowledge acquired by current students will negatively affect countries’ growth. For example, in a study for the OECD, Hanushek and Woessmann (2020) highlighted two long-term costs. First, by disrupting learning, the pandemic will mean long-term losses in the future income of the affected student cohorts. Hanushek and Woessmann (2020) estimated that the closure of educational institutions as a result of COVID-19 will lead to a loss of skills. Therefore, the expected income of students may fall by up to 3.9%. Second, from the point of view of the overall economy, a less well-qualified workforce will lead to lower economic growth. Hanushek and Woessmann (2020) estimate that a learning loss of half a year of schooling could lead to a 3.8% reduction in gross domestic product (GDP) by 2100. Fuchs-Schündeln et al. (2020) used a heterogeneous agent partial equilibrium model based on the human capital models of Cunha et al. (2010), including public expenditure on education and the financial and time investment by parents in their children, calibrated with data taken from U.S. students aged 4 to 14 years. They estimated that, on average, there will be a 3.8% increase in the share of young people without a high school degree and a 2.7% reduction in the share of young people who will obtain a college degree. Similarly, considering equivalent-consumption variation, they concluded that there will be an average welfare loss of 0.75% for students affected by COVID-19, 87% of which is attributable to losses directly caused by the closure of schools.
Months of quarantine and school closures raise the question of how well online teaching has been able to mitigate the disappearance of face-to-face teaching during lockdown. In some countries, the initial results indicate that online teaching has been a poor substitute for face-to-face teaching, with teachers being revealed as key figures in students’ future decision making. Woessmann et al. (2020) reported that, in Germany, the daily time spent by pupils on school activities halved, while the time spent watching television, playing video games, or using mobile phones increased. Worst of all, these asymmetries of online versus face-to-face teaching are much more pronounced for students from disadvantaged socioeconomic strata. Even at the same socioeconomic level, the students who lagged furthest behind have been the worst affected by replacing face-to-face teaching with online models. Following a study of algebra teaching in 17 schools in Chicago, Heppen et al. (2017) reported that when students in the same class were randomly assigned to either an online or a face-to-face format, the results of the former were 0.2 standard deviations below those of the latter, and they had a lower probability of passing (66% compared with 78%).
Some researchers have adopted a distributive point of view to study whether there has been an increase in inequality in learning as a result of the lockdown in most countries, using indicators that link the socioeconomic and educational situation of students with the uses and outcomes of various digital educational programs, many of which are free to access online. For example, Chetty et al. (2020) studied the indicators of the Zearn digital mathematics program in the United States. This program was used by many schools both before and after school closures due to COVID-19. The results could not be more disheartening. After analyzing the school population by postcode and classifying students by quartiles according to family income, they observed that, in districts in the lowest income quartile, academic progress fell by 60%, while the drop in academic progress in districts in the highest quartile was 20%. In a study of Flemish schools in Belgium for the period 2015 to 2020, Maldonado and De Witte (2020) used standardized end-of-year knowledge tests carried out annually by the Flemish Catholic school network to show that the cohort of students in the last year of primary education experienced substantial learning losses in all the subjects analyzed (19%–29% of standard deviation) following the closure of schools. They also reported an increasing trend in inequality in 2020 both within and between schools. This trend is even clearer when comparing students with low socioeconomic status. They also noted that, in view of other analyses such as those by Chetty et al. (2014), these results could indicate lifelong losses of just over 2.5% in annual salaries. They added that the losses observed in their study become even greater when the socioeconomic status of the student’s family is considered. Consequently, they argue that corrective policies must be implemented immediately, particularly to support the students and schools experiencing the greatest losses to maximize the recovery of lost learning. The studies by Chetty et al. (2020) and Maldonado and De Witte (2020) are the first to capture actual losses rather than simulated losses of student learning due to the closure of schools during the COVID-19 crisis.
At the start of the introduction, we cited the study by Bacher-Hicks et al. (2020), who analyzed 55 million students aged 12 years and below experienced a major disruption in the 2019/2020 school year as a result of the COVID-19 pandemic. Using Google search data to develop two indicators of intensity of use by schools (school-centered resources) and parents (parent-centered resources), they observed a surge in searches and the use of digital tools to support online teaching or help parents support their children with homework. The aim of using these tools is to bridge the gap in school learning due to the closure of schools during the pandemic.
Besides underscoring the usefulness and importance of real-time information in relation to actions by families and schools, this study reveals significant differences in the intensity of use of digital educational resources according to socioeconomic status (family income, parents’ educational level, and access to computers and the internet) and geographical area (rural vs. urban areas, etc.).
Given that parental and school investments are often substitutes, Bacher-Hicks et al. (2020) reported that, from the point of view of responses to the school closures, these investments will be crucial to observe the actual impact of the pandemic on education. Bacher-Hicks et al. (2020) showed that students in less favorable situations, in terms of family income, access to ICTs, and parents’ educational level, suffered greater disruption to their education and require additional measures and resources to alleviate these greater learning losses.
To apply the method developed by Bacher-Hicks et al. (2020) to the context of Spain, we performed an exhaustive data search using 12 wide-ranging educational resources and Google Trends. The data consisted of 59,280 observations over six annual periods from the week of 16 September to 2 October 2015, to the week of 12 to 18 September 2020 (Saturday to Friday). Data were also gathered from the Spanish Tax Agency to capture the disposable income in municipalities of more than 1,000 inhabitants over the same period. In addition, the analysis was performed for a full school year with COVID-19 (mid-June 2020 to 19 June 2021). The analysis covered 9,880 new observations following the inclusion of an additional digital educational resource. The academic year effect was not influenced by this period of analysis because the summer vacation period runs from mid-June to mid-September.
Data and Method
Data
To replicate the fundamentals of the study by Bacher-Hicks et al. (2020), we studied 12 most-searched-for digital educational resources in Spain in the weeks of school closures during the national state of emergency declared on 13 March 2020. These online tools are used to enable learning that cannot take place in person. They complement face-to-face teaching and help families and students throughout the school year. Google Trends was used to collect 59,280 observations. These observations correspond to weekly data from September 2015 to September 2020 for each of the 17 regions or “autonomous communities” (comunidades autónomas), as well as Ceuta and Melilla (12 search terms × 19 geographical areas × 52 weeks × 5 years = 59,280 observations).
Our initial idea was to collect weekly data. However, in this study, the weeks ran from one weekend to the following weekend. Therefore, they did not coincide with the calendar weeks of the year. There are several reasons for this difference. First, the last date of the data collection was 18 September 2020, which was a Friday. Second, the state of emergency was declared on a Friday. In addition to this decision regarding how to count the observations, we also needed to gather the data from a school-year perspective. Therefore, the year was taken to run from September to September and included the 52 weeks of the year (during both term time and non-term time) so that we could observe how the use of resources evolved throughout the school year.
Consequently, the data offer an approximation of school years in Spain, which start in mid-September of each calendar year. Specifically, Week 1 in this study is Week 39 of the calendar year, and Week 52 of the study is Week 38 of the calendar year. The data were gathered up until 18 September 2020. This week falls in Week 38 of the calendar year, so this week is the last one in this study (i.e., Week 52 of the 2019/2020 school year). Given the aims of this study, the data start in Week 39 of the 2015 calendar year, which is Week 1 of the 2015/2016 school year.
Having established this convention for counting the weeks and years, it is important to note that the state of emergency in Spain was declared on 13 March 2020. This date falls in Week 25 of the 2019/2020 school year. The state of emergency lasted until 21 June 2020, which falls in Week 39 of the study.
We also considered geographical data. We defined 19 regions, corresponding to the 17 autonomous communities plus the two autonomous cities of Spain. We also use dummies for the annual period and for each of the digital education resources analyzed.
In addition, we performed separate analysis of the most recent school year (2020/2021), which was affected in its entirety by the COVID-19 pandemic. Observations were taken from June 2020 (Week 1) to 19 June 2021 (Week 52). An additional educational resource was included in the analysis. As a result of this addition, 9,880 new observations were included. These dates were chosen to ensure that the effect on the academic school year remained unchanged given that the summer vacation in Spain runs from mid-June to mid-September. As the analysis shows, searches for digital educational resources during the holiday period decreased dramatically.
Model and Regression
To formalize the analysis, two regressions were carried out. In both cases, dummies of the characteristics under study were used. For example, to study the use of digital resources over the 52 weeks of the year, we took one of these 52 weeks as an omitted variable and used the value of the dummy coefficient for the week corresponding to this omitted value as a reference.
The reason for carrying out two regressions of these characteristics was that we needed to introduce a specific, separate period within the analysis corresponding to the weeks of term time during the school closures plus the subsequent weeks of non-term time until the beginning of the 2020/2021 school year. In the first regression, the analysis was carried out for all observations. Dummies were created for each of the 52 weeks, for each of the resources, for each of the annual periods, and for each region. The model for the first regression may be specified as

Here, IB is the intensity of the search for resource r in week s, in year a, and in region c. The variable of interest in this first regression is the dummy corresponding to the period since the schools closed. The coefficient associated with this dummy captures whether there was a significant increase in Google searches for digital educational resources in Spain since the declaration of the state of emergency with respect to the same period in previous years. The coefficient also indicates whether the level of search activity was above the upward trend in the use of digital educational resources that already existed before the COVID-19 outbreak.
In the second regression, dummies for each week in 2020 from the closure of schools until 18 September 2020 were added. Therefore, the model for this second regression may be specified as

In this equation, the regression is performed by disaggregating the 27 weeks of 2020 (from the school closures on 13 March 2020 to the last week of the study on 18 September 2020). The value and sign of the coefficient of the weekly dummies are benchmarked against the omitted variable for the first week of school closures. Before analyzing the results of these regressions, we first give a descriptive illustration of some interesting changes. Figure 1 shows how the searches for the five most-searched-for digital educational resources in Spain evolved over time. These five digital educational resources are examined in the next section along with a further seven resources (12 in total). An additional digital educational resource was included for the analysis of the 2020/2021 school year. In the week of 13 to 20 March 2020, there was a huge increase in searches for “Google Classroom” (search intensity in March 2020 increased by a factor of 6), “Zoom Video” (by a factor of 13), “Edmodo” (by 6), “Microsoft Teams” (by 13), and “ClassDojo” (by 2). Figure 1 also shows the variable to be explained in the regressions in the next section. This variable (search intensity) is defined as searches for a specific term as a percentage of total Google searches. On Google Trends, these data are also provided relative to the maximum search intensity over the period. In the last year in Spain, the maximum search intensity (100) was attained by Google Classroom in the third week of March. The data for the other weeks are expressed relative to this maximum.

Searches for the five most-searched-for digital tools in Spanish education over the last 5 years.
Intensity of Use of Digital Educational Resources Over Time
We offer separate analyses of the coefficients found in the regression analysis: weeks, years, each of the 12 search terms, and regions. To establish a relationship between COVID-19 and the use of online educational resources over the last 5 years, each of the 52 weeks in the study was converted into a dummy variable relative to the use of these digital educational resources in Week 15 of the study (i.e., the omitted variable). The dependent variable is the Google search intensity for the digital educational resources relative to total Google searches. Google Trends provides data relative to the maximum number of searches for each digital educational resources term over the period.
Table 1 reveals a significant variation in the use of online educational resources during the school year. Weeks 14 to 16 (Christmas period) and Weeks 40 to 51 (summer vacation) must be differentiated from the weeks during term time. A possible exception is the Easter vacation, which changes each year according to the lunar calendar. Therefore, it does not always fall in the same week of the calendar year. The interpretation of this period is omitted from the analysis.
Regression Analysis of the Intensity of Use of Digital Educational Resources.
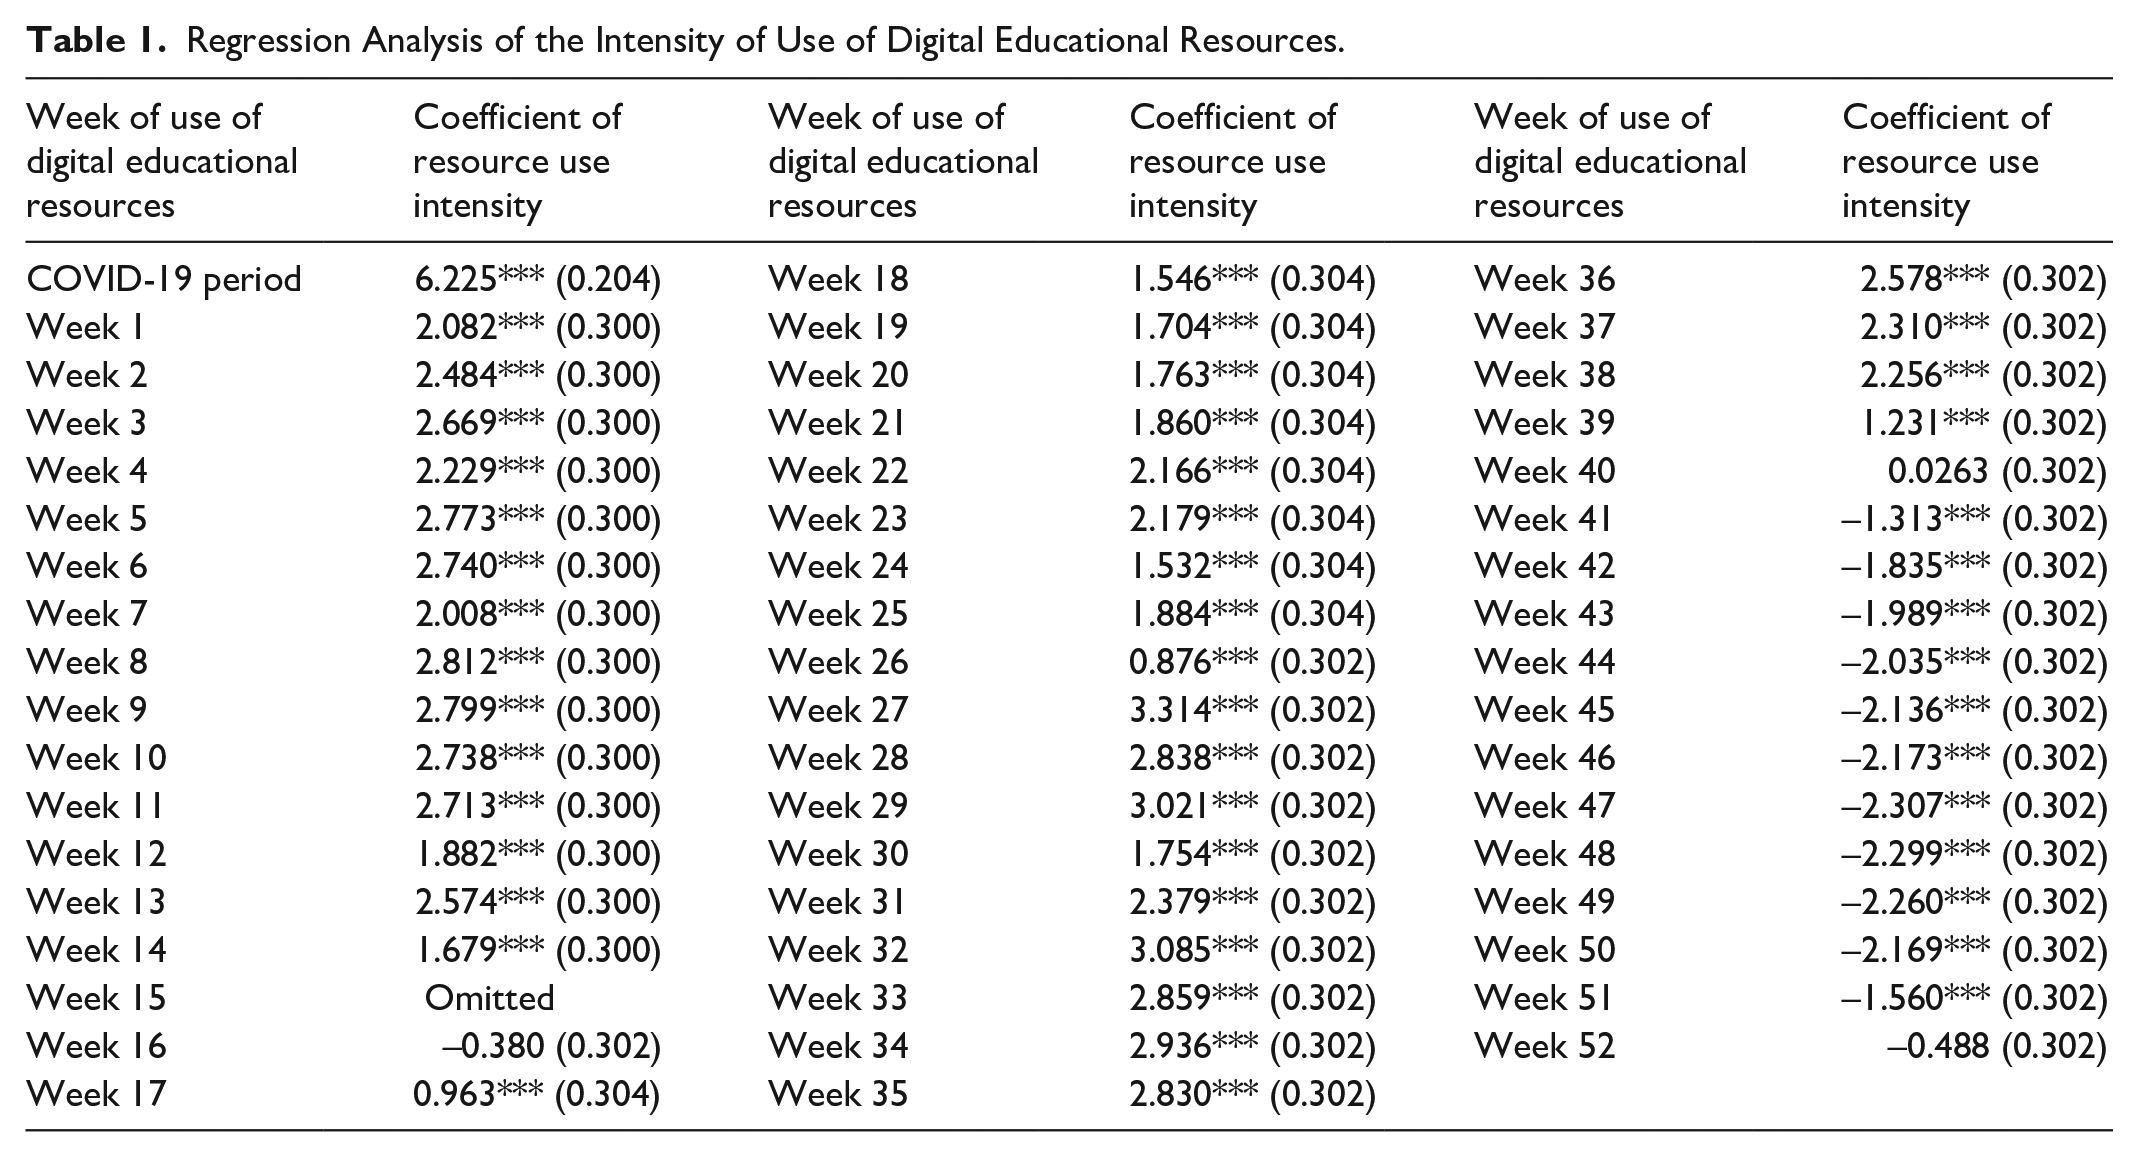


Source. Authors based on data from Google Trends.
Note. Standard errors in parenthesis.
p < .1. **p < .05. ***p < .01.
The initial conclusion is that during the school year (September to June), there is a more intense use of digital educational resources. After the lockdown, the search for these resources increased significantly. The coefficient associated with the period of the school closure had a positive value of 6.225, which is statistically significant at the 1% level.
The coefficient associated with the year 2016 is 0.409. This coefficient grew in successive years: 2017 (0.902), 2018 (1.507), 2019 (2.238), and 2020 (3.630). Digital educational resources have been used increasingly intensively over the years. This increase in use is not only because of the greater range of resources but also because the educational community has become aware of these resources and has developed learning activities that use them. While these resources are perceived as complementary, they are becoming increasingly present in the design and development of teaching curricula. The coefficient associated with the period of school closures on education-related search queries is 6.225, while the coefficient associated with the year 2020 dummy is 3.630. Therefore, following the COVID-19 outbreak, there was a surge in Google searches for digital educational resources. This increase in searches raised the level of use of digital resources in Spain above the previous trend. Consequently, the results reveal a major increase in the use of online educational resources during the closure of schools, with the intensity of use reaching levels that would not otherwise have been attained until 2022. COVID-19 has accelerated the adoption of digital educational tools.
Analysis of the resource use intensity indicates that Edmodo, Google Classroom, and Genially were the most-searched-for digital educational resources on Google in Spain before the schools closed during the COVID-19 crisis. The remaining resources had similar levels of penetration in Spanish education.
In the same way that analysis was performed by week, the usage data for these 12 digital resources were also broken down by autonomous community. The coefficient shows the intensity of use of these educational resources in each autonomous community. In this study, there were 19 geographical regions (17 autonomous communities plus Ceuta and Melilla). Andalusia was the omitted variable. Each autonomous community or city was represented by a dummy variable taking the value for that region relative to the use of these digital educational resources in Andalusia from September 2015 to September 2020.
The coefficient for Melilla and Ceuta is significant and negative, indicating a shift away from the broader pattern of use of digital educational resources in Spain over the study period. Besides the negative values for Melilla and Ceuta, which indicate a lower use intensity than in Andalusia, the values for Extremadura and Navarre are non-significant and should be assumed not to differ from the value for Andalusia. The educational systems in Asturias and the Basque Country used these digital resources most intensively. The coefficients are greater than 1.7 and are significant at the 1% level. This finding suggests a certain degree of variation in how each regional education system dealt with the government-imposed closure of schools.
Table 2 provides the same estimate as in Table 1 but with a weekly breakdown of the effect of the period of school closures (from 13 March 2020 onward). Instead of using the same dummy for all weeks following the declaration of a state of emergency, we assigned a dummy to each of the 27 weeks until 18 September 2020. These dummies captured the differences between Google searches for digital educational resources in the weeks after the closure of schools and searches in the same weeks in previous years. That is, we compared digital educational resource use intensity in the weeks of lockdown to use intensity in the same weeks in the school years of 2015 to 2019. The regression also included dummies for autonomous community, year, and digital resource. These dummies are not shown in Table 2 to reduce space.
Comparison Between Google Searches During School Closure and Searches During the Same Weeks for the Years 2015 to 2019.

Source. Google Classroom and authors’ own work.
Note. Standard deviation in parentheses.
p < .1. **p < .05. ***p < .01.
Figure 2 was plotted using the coefficients in Table 2, reflecting the surge in search activity during the weeks of closure due to COVID-19. Once the school year ended, the values for the 2019/2020 school year returned to normal levels. There was also a small dip in the first few weeks of April, coinciding with the Easter holidays. Once again, at the start of the 2020/2021 school year, the use of digital educational resources seemed to increase above the trend observed in recent years. This upturn in September 2020 is notable because it indicates that the use of digital educational resources is once again growing and that some of the effect of COVID-19 on the intensity of Google searches for educational resources has remained.
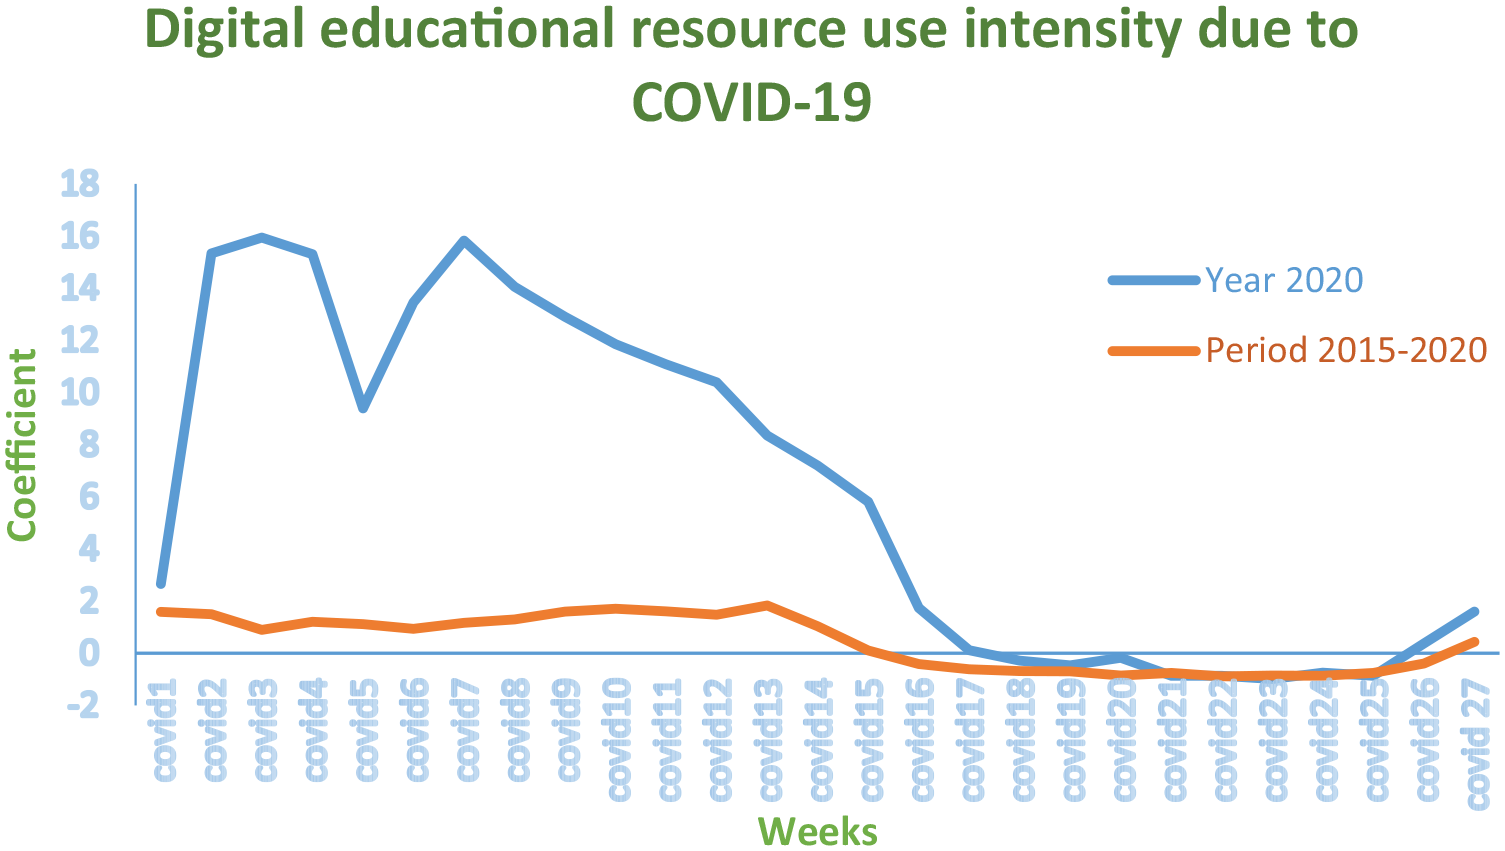
Digital educational resource use intensity by week of school closures due to COVID-19.
Intensity of the Use of Digital Educational Resources Over a Full School Year With COVID-19
This section presents analysis based on the data relating to the estimates for the full school year with COVID-19 and the data relating to the comparison over the last 5 years (from 19 June 2016 to 19 June 2021), shown in Figure 3, as well as the data relating to the intensity of digital educational resource use during a full year with COVID-19 (from mid-March 2020 to mid-March 2021), shown in Table 3.

Digital educational resource use intensity by week of school year due to COVID-19.
Comparison Between Google Searches Over a Full Year in Times of COVID-19 and Searches During the Same Weeks for the Years 2016 to 2020.

Source. Google Classroom and authors’ own work.
Note. Standard deviation in parentheses.
p < .1. **p < .05. ***p < .01.
Figure 3 illustrates the pattern of searches for digital resources in the 2020/2021 school year from mid-September 2020 to mid-June 2021. This was the first school year that was affected in its entirety by COVID-19. The data correspond to the coefficients of the regression, including the observations from 19 June 2016 to 19 June 2021. Due to space restrictions, this table is not shown, although it is available upon request. Comparison of Figure 3 with Table 1 reveals that the COVID-19 effect has steadily faded, given that the search intensity has decreased. Figures 1 and 3 and Table 1 show the same search pattern, with the bulk of searches clustered in the initial and final few weeks of the school year. The search intensity dropped significantly in both the Christmas and summer vacations.
Figure 3 also shows how the surge in searches for resources in mid-June 2020 continued in the first quarter of the 2020/2021 school year. Searches then followed a similar trend to that of recent years in the second quarter. Finally, the COVID-19 effect faded completely by the last quarter of the 2020/2021 school year.
We also analyzed the effect of the pattern of searches for digital educational resources over an entire year with COVID-19, instead of focusing solely on the school year. Table 4 shows the effect from mid-March 2020 to mid-March 2021 comparing this period with the months in the previous 5 years by including a dummy variable indicating the COVID-19 period for each week of the school year. Thus, Week 1 of the COVID-19 period corresponded to the same week (Week 38) in the regression for all 5 years, and so on.
Use of Different Digital Resources.

Source. Google, Spanish Ministry of Finance, and authors’ own work.
Note. Standard deviation in parentheses:
p < .1. **p < .05. ***p < .01.
First, from mid-March 2020 to the start of the summer vacation, there was a strong surge in search intensity compared with the last 5 years. This was the period during which the state of emergency was in force. Second, after the summer vacation, the coefficients indicate the ongoing intensity in searches for digital resources during the COVID-19 period. However, the value decreased significantly to levels similar to those of the 5-year estimate. Finally, following the Christmas vacation (Week 45 in the COVID-19 regression), the differentiating effect on the search for digital educational resources due to COVID-19 seems to have faded completely. This trend may reflect the inclusion of these digital resources in the daily school routine, thereby eliminating the need to search for them.
Intensity of Use of Each Digital Resource
In this section, we analyze the evolution over time of each of the 13 digital educational resource search terms on Google. We also control for weekly variation, the differences in the use of each resource in each autonomous community, and the growing use of digital educational resources in recent years.
The results in Table 4 show that the variable of interest relating to the period when schools were closed (COVID) is positive and significant for 11 of the 13 terms analyzed using Google Trends (p < .1 in the case of the Khan resource). Thus, there was a general increase in Google searches for digital educational resources across numerous resources. Search intensity during the school closures was lower only in the cases of Kahoot!, Kahn, and ClassCraft. The effect was positive but non-significant. The use of these digital resources during the school closures may have fallen because they are complementary tools for face-to-face teaching and are widely used by teachers in the classroom.
Some of the resources such as Microsoft Teams, Zoom Video, and Cisco Webex are used not only in educational settings. However, it may be assumed that some of the growth is linked to communication between teachers and students. The other seven digital resources (Google Classrooms, Socrative, Smartick, EdPuzzle, Edmodo, ClassDojo, and Genially), which received a higher number of Google searches during the school closures, are educational.
We now discuss the analysis of each week of the school year and the trends for each digital application. Week 1 (i.e., the week of 19 June 2016, or the last school week in Spain) was taken as the omitted variable. A similar pattern to the one shown in Table 1 was observed for each application, especially for the most education-oriented resources.
For all weeks between Weeks 2 and 13 (i.e., the summer vacation period), the coefficients were negative for the applications with significant coefficients. Also, from Week 14 onward, the coefficients were positive for all applications with statistically significant coefficients. Notably, in Week 24, there was a decrease in the coefficient due to the December long weekend (December 6 and December 8).
The coefficients were negative in Week 28, during the Christmas period, and were positive once again in Week 31. Although Week 30 was a school week, it was the first week after the Christmas vacation. Therefore, it may be expected that the classroom dynamics in relation to the use of digital resources would gradually build over time.
The Easter vacation (a 10-day period in Spain) is an important period in terms of the weekly use of digital applications. However, this holiday period depends on the lunar calendar and thus varies from year to year. By studying a given week over 5 or 6 years, the impact of this holiday period is nullified because any given week is not always a week of vacations. Finally, the intensity of use declined somewhat as the school year came to an end. This effect is especially striking for certain applications such as Google Classroom.
In relation to the rest of the variables, the signs of the coefficients of the regional dummies show that the school community in each region focused on different digital resources. Here, the region omitted to avoid perfect multicollinearity was Andalusia. Notably, there were few significant digital resources in Aragon, Asturias, Canary Islands, Cantabria, Castilla-La Mancha, Extremadura, Melilla, and Murcia. None of these regions had more than six significant digital resources out of a total of 13 resources. Also, very few resources were statistically significant in 13 or more regions (ClassDojo, Edmodo, Genially, Zoom Video). Other resources had a very low level of implementation. For example, EdPuzzle was significant in only two regions.
Few regions (Asturias, Galicia, Navarra, and Valencia) had significant positive coefficients for all digital applications. These coefficients highlight greater growth in the intensity of use in these regions. In contrast, Ceuta had significant negative coefficients for nine out of the 10 applications, and Madrid had significant negative coefficients for six out of eight. Similarly, in two regions, there were some significant negative coefficients (Google Classroom in Castilla–León, and Edmodo and Genially in Catalonia). However, these two regions had the highest number of significant applications (with 11), also indicating a more extensive use of digital resources.
Google searches for digital educational resources were already growing for some digital tools such as Classcraft, Genially, and Kahoot!, with the latter experiencing massive year-on-year increases in its coefficients, even before the lockdown. COVID-19 has accentuated this growth. Part of the school community has been introduced to these tools for the first time. However, for Cisco Webex, Edmodo, and Zoom Video, the period of school closures saw a steady decline.
School Closures and Convergence in Google Classroom Use Intensity
Bacher-Hicks et al. (2020) concluded that growth in the use of digital resources during the school closures was greater in postal districts with higher incomes, and consequently, that the school closures widened the gap between pupils from more disadvantaged backgrounds and those from more affluent households. To test whether this conclusion also applies to Spain, we analyzed these socioeconomic characteristics for Spain.
This analysis is based on data from the Spanish Tax Agency on per capita disposable income in municipalities with more than 1,000 inhabitants. We searched on Google Trends for data on the use of Google Classroom by municipalities during the school closures. We used data on Google Classroom only because, as Figure 1 shows, it is the most widely used digital educational resource. Therefore, observations were available for 249 municipalities, providing a fair representation of a substantial number of autonomous communities. We are aware that this choice may limit the conclusions of our analysis and the scope of our results. However, there was no way of addressing this issue with any guarantee of statistical significance using the data on the other digital resources.
The observations for the 249 municipalities were classified into percentiles according to disposable per capita income. The median income in the municipalities with Google Classroom data was 10,760 euros/year. The income at the 25th percentile was 9,128 euros/year, and the income at the 75th percentile was 12,595 euros/year. Consequently, by cross-referencing the data on per capita income and the use of Google Classroom in each municipality, we obtained the figures shown in Table 5. This table compares growth in searches for the term “Google Classroom” for the period June 2016 to June 2021 (including the COVID-19 outbreak) versus the period June 2020 to June 2021 (which includes 1 school year with COVID-19). The search by municipality allows for variation in intensity over the last school year. In municipalities with a per capita disposable income of less than or equal to 9,128 euros/year, the intensity of use of Google Classroom grew by 147.8%. In municipalities with the highest per capita income (i.e., a per capita income of greater than or equal to 12,595 euros/year), the increase was 128.9%. This increase is also large but is still smaller than in the previous group.
Growth in the Use of Digital Resources by Spanish Municipality by Income Level in the Weeks of COVID-19-Related School Closures: Comparison of the Period June 2016–June 2021 with June 2020–June 2021.

These findings for Spain contradict those of Bacher-Hicks et al. (2020) for the United States. However, in the case of their analysis, Google Trends provided data on other digital tools at a more detailed level than the state level.
The following section examines possible convergence to establish whether the municipalities that used Google Classrooms the least between June 2016 and June 2021 had the most growth over the last year? Table 6 shows that there was β-convergence. That is, municipalities with fewer Google Classroom searches over the last 5 years had the most growth in the use of this tool over the school year with COVID-19 (June 2020 to June 2021). Table 6 also shows the results of including a β-convergence estimate by adding a term that interacts the logarithm of the initial use of Google Classroom (2016–2021) by municipality with the income in the same municipality. The data show that municipalities with higher per capita income have had less growth in the use of Google Classroom.
β-Convergence in the Intensity of Use of Google Classroom by Per Capita Income (2016–2021).

p < .1. **p < .05. ***p < .01.
The same β-convergence estimate as in Table 6 is provided in Table 7 but this time by autonomous community. The results of the estimates are shown for autonomous communities with a sufficient number of municipalities with data on Google Classroom searches between June 2016 and June 2021 over the last year. The number of observations for each autonomous community is given in parentheses.
β-Convergence in the Intensity of Use of Google Classroom by Autonomous Community.

Note. CI = confidence interval.
p < .1. **p < .05. ***p < .01.
In the five autonomous communities shown in the table, which includes the three most populous Spanish regions (accounting for more than half of Spain’s total population), there was β-convergence. That is, the municipalities in all regions that used Google Classroom least intensively between June 2016 and June 2021 had the greatest growth over the last year. Given this convergence in the intensity of use of Google Classroom, it is also worth examining the possible existence of σ-convergence. Table 8 shows that the coefficient of variation (standard deviation divided by the mean) is falling.
σ-Convergence in the Use of Google Classroom.

Conclusion
As explained in the introduction, a country’s education system is one of the pillars of economic and social growth. In view of this reality, no country can afford to allow COVID-19 and the effects of the pandemic to jeopardize its future well-being. However, the latest international studies show that the pandemic poses a genuine threat to younger generations. The novelty and value of the present study lies in its analysis of the COVID-19 period from a dual perspective: both during the weeks of government-imposed school closures and during the 2020/2021 school year (i.e., September 2020 to June 2021). The first education-related threat of the pandemic is the possible reduction in the acquisition of knowledge and skills by today’s students. The second is a distributive effect, given the possible increase in social inequality for students from households with lower incomes and therefore less access to digital educational resources and a dependence on the skills and competencies of parents.
Based on this dual research premise and in an attempt to address this challenge, we first examined the evolution of internet searches for digital educational resources when face-to-face classes were suspended due to the COVID-19 outbreak in Spain and the following school year with COVID-19 (2020/2021). The results show a significant increase in the use of digital educational resources in Spain since the state of emergency was decreed on 13 March 2020. The lockdown led to a surge in the use of digital educational resources in Spain, with this use reaching levels that would not otherwise have been attained until 2022. This trend of greater intensity in internet searches for digital resources is widespread, occurring for 10 of the 13 resources analyzed in this article.
In addition, the analysis of the 2020/2021 school year shows that this surge in searches became less intense as the school year progressed, eventually fading away after the Christmas vacation. This trend is highlighted by the results of analysis of a full year with COVID-19, from March 2020 to March 2021. The findings imply that, because of the inclusion of these digital resources in daily school routines or the adoption of technology in daily life, there has been a notable reduction in searches for these digital resources.
Given the considerations related to distribution the fact that the income data were broken down by municipalities of a certain size, the analysis focused on Google Classroom, which is the only tool for which municipality-level data were available. This analysis shows that the increase in the use of digital tools due to school closures was greater in municipalities that used this resource less before the lockdown. That is, unlike in the United States (Bacher-Hicks et al., 2020), in Spain, the gap in the use of the most popular digital educational resource has not grown. In fact, in municipalities with the lowest per capita income, the use of digital educational resources seems to have intensified for all periods analyzed, at least in terms of this free digital educational resource.
Finally, during both the period of remote learning during the COVID-19 pandemic and the following school year (i.e., 2020/2021), the COVID-19 crisis has not only boosted the use of digital educational resources, accentuating the upward trend that has existed since 2015, but has also led to possible convergence in the use of internet searches for digital resources. Naturally, this convergence does not mean that students from disadvantaged backgrounds have learnt more than other students. It may be that families from low-income municipalities or from areas that used digital educational resources less before the outbreak of COVID-19 reacted most strongly in the search for digital educational resources.
Moreover, due to data availability, the evidence of this convergence at the municipal level relates only to Google Classroom, which is a largely free resource. This convergence must be further tested to ascertain whether it also exists for other tools, especially those that users must pay to use. In any case, possible equality in internet searches for digital resources does not preclude other sources of inequality. For example, parents would have been able to help their children during lockdown in very different ways depending on their cognitive and non-cognitive skills and competencies. Furthermore, the availability of digital devices and the quality of connectivity vary greatly. Nevertheless, the evidence provided here suggests that the reaction and willingness of schools and the school community to search for digital tools to address the challenge of remote learning due to the COVID-19 pandemic and the subsequent period until June 2021 does not differ depending on the use of these resources prior to the lockdown or the per capita income of the school’s local area. The results also have major implications for economic and development policy, given that they highlight the importance of investing in digital infrastructures for a country’s social development and cohesion.
Footnotes
Acknowledgements
We thank Gonzalo Romero (Director of Google Education for Spain) and José Ramiro Martínez (GlobalNET Solutions) for their help and support in the search for data and the most representative digital educational search terms.
Declaration of Conflicting Interests
The author(s) declared no potential conflicts of interest with respect to the research, authorship, and/or publication of this article.
Funding
The author(s) received no financial support for the research, authorship, and/or publication of this article.