
Abstract
Background
Hardware changes can be an unavoidable confound in imaging trials. Understanding the impact of such changes may play an important role in the analysis of imaging data.
Objective
To characterize the effect of equipment changes in a longitudinal, multi-site multiple sclerosis trial.
Methods
Using data from a clinical trial in progressive multiple sclerosis, we explored how major changes in imaging hardware affected data. We analyzed the extent to which these changes affected imaging biomarkers and the estimated treatment effects by including such changes as a time-dependent covariate.
Results
Significant differences whole brain atrophy (brain parenchymal fraction, BPF) and microstructure (transverse diffusivity, TD) between scans with and without changes were found and depended on the type of hardware change. A switch from GE HDxt to Siemens Skyra led to significant shifts in BPF (p < 0.04) and TD (p < 0.0001). However, we could not detect the influence of hardware changes on overall trial outcomes– differences between placebo and treatment arms in change over time of BPF and TD (p > 0.5).
Conclusions
The results suggest that differences among hardware types should be considered when planning and analyzing brain atrophy and diffusivity in a longitudinal clinical trial.
Keywords
Introduction
There is an urgent need for better imaging biomarkers for progressive multiple sclerosis (MS). 1 The Secondary and Primary Progressive Ibudilast NeuroNEXT Trial in Multiple Sclerosis (SPRINT-MS) was a phase II trial of ibudilast that used changes in Brain Parenchymal Fraction (BPF), a measure of whole-brain atrophy, as a primary outcome and found a significant treatment effect. 2 Secondary outcomes included four advanced imaging biomarkers, including diffusion tensor imaging (DTI). 3 Of particular interest is transverse diffusivity (TD, also known as radial or perpendicular diffusivity). The treatment effect on TD (difference in change over time between placebo and treatment groups) was nearly 200%, larger than that of the other secondary outcomes, but was not statistically significant due to high variability. Interest in TD was driven by early work showing the correlation between TD and demyelination. 4 However, the correspondence between TD and diffusion perpendicular to fiber tracts is not strict due to the presence of complex tissue geometries.5,6
The objective of this work is to assess the impact of equipment changes, a common confound in imaging-based trials. We examine the degree to which hardware changes influenced BPF, TD and the estimated effect of ibudilast. To take advantage of innovations in imaging technology, clinical radiology units routinely update scanner technology. Such updates are undesirable in trials because they may introduce systematic errors that can affect trial outcomes. We examine the extent to which such systematic errors affected the study. To contend with scanner changes, there are several common approaches. Some analyses drop scans affected by a scanner change but risk losing statistical power due to lost data. Another strategy is to consider hardware changes as a covariate in the statistical plan, 7 which makes it possible to indicate if details of the differences among imaging measures and among hardware need to be considered.
Methods
Study overview
SPRINT-MS was a double-blind placebo-controlled trial of ibudilast in secondary and primary progressive MS. The trial adhered to ethical guidelines in the Declaration of Helsinki. 8 All patients provided written informed consent. The trial included 27 scanning sites and acquired images at baseline, 24, 48, 72 and 96 weeks. 9 Randomization was stratified by use of immunomodulating therapy and MS diagnosis. As in the original study, analysis was confined to the 244 patients (of 255 randomized) who received at least one dose of study medication and completed one or more MRIs after baseline. Major changes in scanner hardware affected 39 subjects. Each affected subject experienced only one hardware change. The most common change (6 sites) was an upgrade from Siemens Trio to Siemens Prisma. A switch from GE HDxt to Siemens Skyra occurred at one site. One subject moved from a site with a GE HDxt to another with a GE MR750. Table 1 summarizes the prevalence of each change. Within each scanner type, major hardware components, such as head coil, are the same (Siemens Trio: a 12-channel coil. Siemens Prisma, Skyra: 20-channel coil. All GE: 8-channel coil).
Types and prevalence of hardware changes in the SPRINT-MS trial in terms of number of subjects affected and number of scans performed after a hardware change for treatment (Trt) and placebo (Pbo) groups, with selected demographic information and disease status.

When different from the number of scans used for BPF measurements, the number of DTI scans performed after a hardware change is in parentheses. The difference results from failure of some scans to meet quality control criteria.
Imaging
The nature of the imaging acquisition and postprocessing used in deriving BPF and TD differ substantially. Thus, the impact of hardware changes on each parameter was considered separately.
BPF is a measure of brain atrophy and has been used in many MS clinical trials and research studies. 10 BPF was calculated by combining T2-weighted 2 D turbo/fast spin-echo images (matrix 256x256, TR/TE = 4500-6300/66-84 msec, slice thickness 3 mm, in plane resolution 1x1mm) and 2 D T2-weighted FLAIR (matrix 192x256 or 256x256, TR/TE/TI = 9000-9400/77-98/2500 msec, FA = 90-120, slice thickness 3 mm, in plane resolution 1x1mm) as described in Fisher et al., 11 then taking the ratio between brain parenchymal volume and outer contour volume, a smooth contour around the brain. 11 TD is calculated based on diffusion tensor imaging (DTI). 12 DTI scans were harmonized across all platforms in terms of spatial resolution and diffusion-weighting scheme (2.5 mm isotropic voxels, 255x255 × 150mm field of view, 6/8 partial Fourier factor, 64 diffusion-weighted volumes with b = 700 sec/mm2, 8 b = 0 volumes), and led to high concordance across different platforms. 13 All calculations were performed using software that was developed in house.14,15 Further details were described previously.9,16,17 and in the Appendix (supplementary material) for MRI methodology.
Statistical analysis
The original statistical analysis plan for the SPRINT-MS trial did not adjust for hardware changes. In this analysis, we modify the original models to examine the effect of hardware changes.
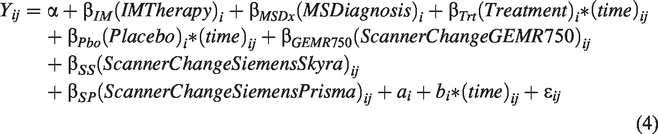
A linear mixed effects model was used to estimate the rate of change in BPF by treatment group adjusted for randomization strata:


The analyses of BPF and TD were modified to assess the impact of hardware changes in four ways. First, data acquired after a major hardware change were excluded from the models and the treatment effect estimated. This approach provides a simple indicator as to whether a hardware change impacted results by excluding 80 (77) data points from the BPF (DTI) model (Table 1). Second, the original model was modified to include hardware change as a time-dependent binary yes/no covariate. Equation (1) for BPF was modified to include a binary time-varying indicator, 

where
To assess whether accounting for hardware change improved goodness-of-fit, the Akaike information criterions (AICs) were compared to the original model using Maximum Likelihood (ML) estimation. Model residuals were assessed graphically. Statistical analyses were performed in SAS 9.4 Software (SAS Institute, Cary, NC). As this is an exploratory study, no corrections for multiple comparisons were performed.
Results
Table 2 summarizes the impact of accounting for hardware changes on overall outcomes. For BPF, accounting for hardware changes had only a slight impact on estimates of the treatment effect. For example, the original treatment effect of 0.89 (0.04, 1.74) parts per thousand per year changed to 0.84 (0.02, 1.67) parts per thousand per year after accounting for specific type of hardware change, a difference of 5.6%. For TD, accounting for hardware changes had a larger impact on the treatment effect. For example, the treatment effect went from −2.92 (−6.85, 1.02) × 10−6 mm2/sec per year with no adjustment to −3.38 (−7.16, 0.41) × 10−6 mm2/sec per year after accounting for the specific type of hardware change, a difference of 16%. For BPF and TD, adjusting for the existence of or type of hardware change led to a slight increase in precision, reflected by narrowing of the confidence intervals of the treatment effect. Values of AIC suggest that adjusting for hardware changes improved the model goodness-of-fit. The model adjusting for scanner upgrade type, which allowed for each scanner upgrade type to have a different effect, was optimal.
Effect of adjusting for hardware changes.
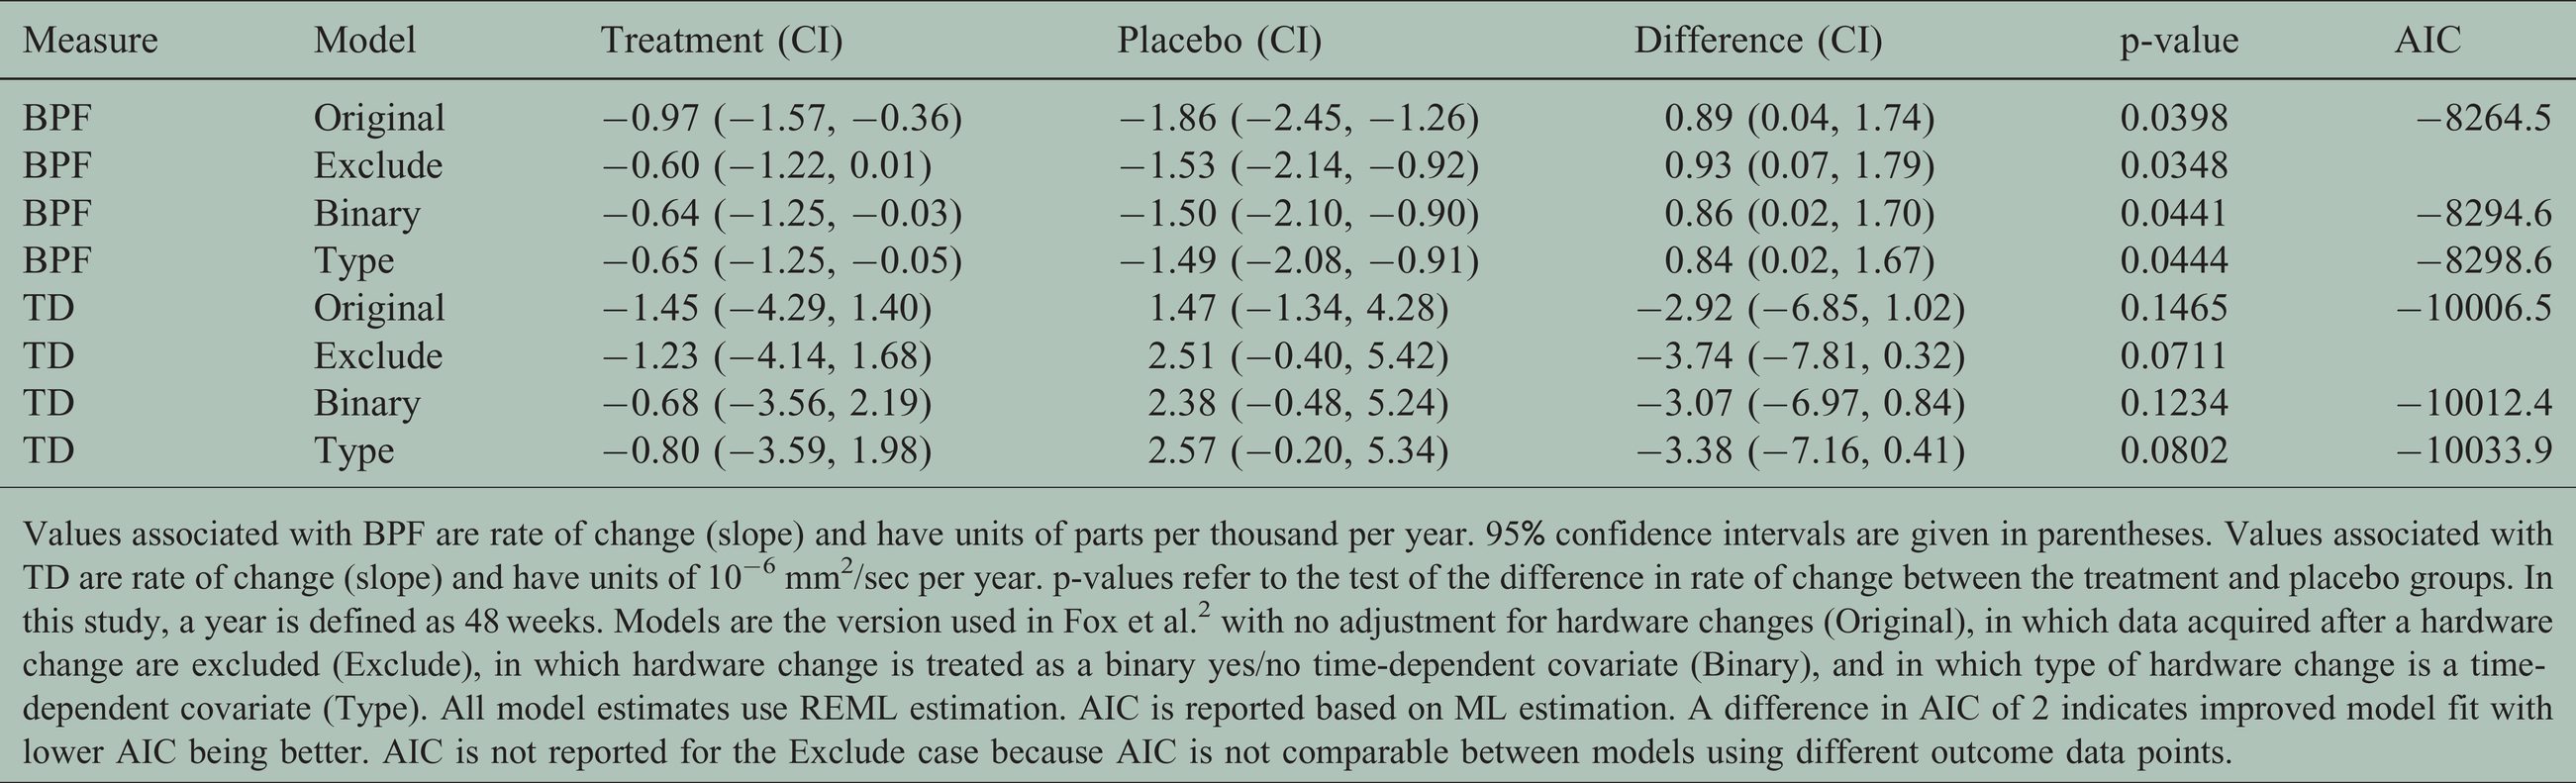
Values associated with BPF are rate of change (slope) and have units of parts per thousand per year. 95% confidence intervals are given in parentheses. Values associated with TD are rate of change (slope) and have units of 10−6 mm2/sec per year. p-values refer to the test of the difference in rate of change between the treatment and placebo groups. In this study, a year is defined as 48 weeks. Models are the version used in Fox et al. 2 with no adjustment for hardware changes (Original), in which data acquired after a hardware change are excluded (Exclude), in which hardware change is treated as a binary yes/no time-dependent covariate (Binary), and in which type of hardware change is a time-dependent covariate (Type). All model estimates use REML estimation. AIC is reported based on ML estimation. A difference in AIC of 2 indicates improved model fit with lower AIC being better. AIC is not reported for the Exclude case because AIC is not comparable between models using different outcome data points.
Closer examination of the covariate analysis shows that different types of hardware changes have qualitatively different behavior. Table 3 shows the impact of type of hardware change on imaging measures. Values are systematic differences between imaging measures due to a particular type of hardware change. The change from Siemens Trio to Siemens Prisma is associated with a systematic lowering of BPF. Among those affected by this change, an equal number were in the treatment and placebo arms (12 each, Table 1). The number of scans within each arm was nearly equal—23 (27) in the treatment (placebo) arm. This balance between may explain why the systematic shift in BPF did not affect the overall outcome. In contrast, the change from GE HDxt to Siemens Skyra, associated with a systematic lowering of TD, affected nearly twice as many scans within the placebo (17) than in the treatment arm (9). Together, the systematic shift and the imbalance could explain why the treatment effect is larger after accounting for the hardware change. To understand why, consider that TD decreases over time within the treatment arm, as can be seen by the negative values of slope in Table 2, while TD increases over time within the placebo arm, as can be seen by the positive values of slope. A hardware change will affect later time points, and a systematic reduction in TD will decrease the slope of change over time (less positive slope for placebo and more negative slope for treatment). Such a trend is exemplified within the placebo arm, Table 2. The slope is smaller without adjustment for hardware changes (1.47 (−1.34, 4.28) × 10−6 mm2/sec per year) than with adjustment (2.38 (−0.48, 5.24) to 2.57 (−0.20, 5.34) × 10−6 mm2/sec per year). In the treatment arm, the effect of hardware changes follows the same pattern (−1.45 (−4.29, 1.40) × 10−6 mm2/sec per year without adjustment, −0.68 (−3.56, 2.19) to −1.23 (−4.14, 1.68) × 10−6 mm2/sec per year with adjustment), but is less pronounced, perhaps reflecting the lower number of scans affected by the hardware change within the treatment arm.
Effect of hardware change on BPF and TD.
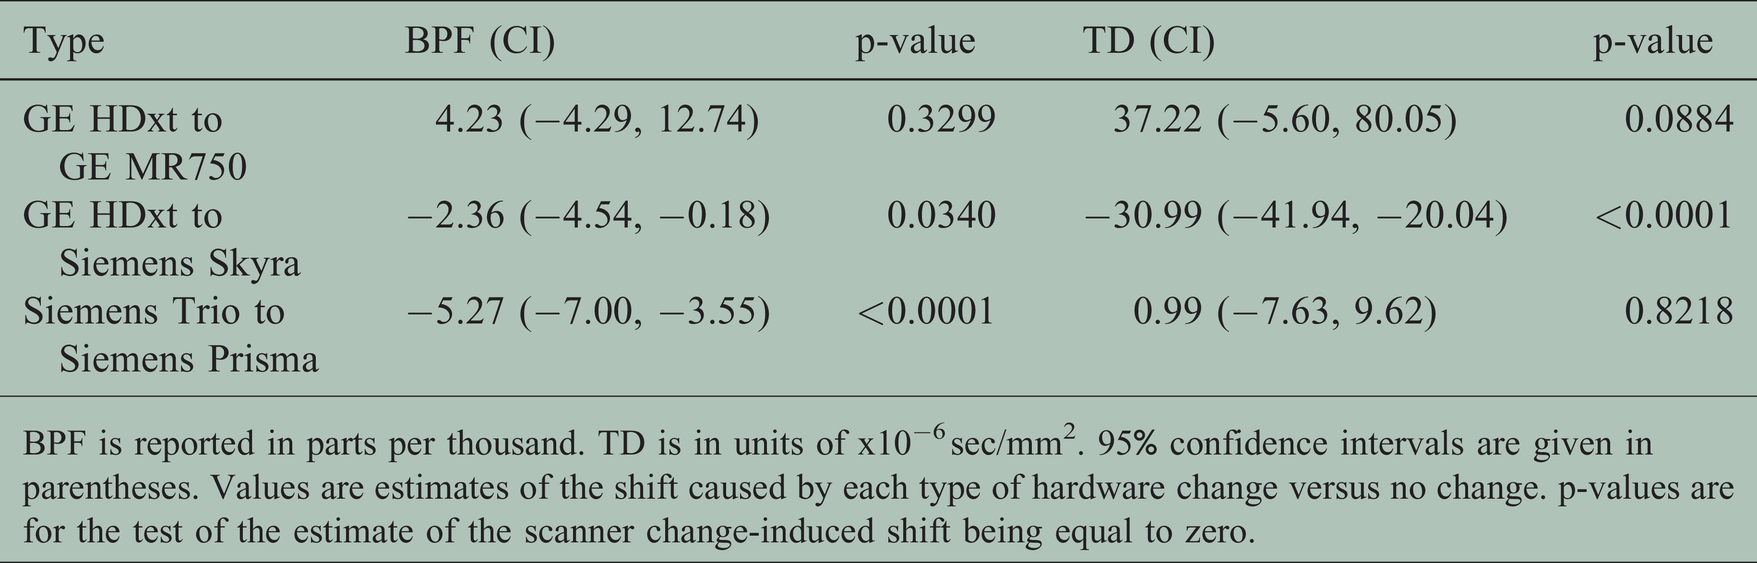
BPF is reported in parts per thousand. TD is in units of x10−6 sec/mm2. 95% confidence intervals are given in parentheses. Values are estimates of the shift caused by each type of hardware change versus no change. p-values are for the test of the estimate of the scanner change-induced shift being equal to zero.
Scanner changes affected imaging measures, but there was no indication that the effect of treatment varied by scanner upgrade type. Analysis including a time by treatment by type of change term found no significant interaction between type of scanner change and treatment effect for BPF or TD (Table 4, p > 0.5). However, this study was probably not sufficiently powered to draw a conclusion from this result.
Impact of scanner change on overall outcomes.

Values are differences in treatment effect for BPF (parts per thousand) or TD (x10−6 sec/mm2) over 48 weeks by a particular type of hardware change versus no change. p-values are for the test of this difference. The GE HDxt to GE MR750 change could not be analyzed because only one subject was affected.
Figure 1 illustrates the findings for BPF and a scanner change from a Siemens Trio to a Siemens Prisma at week 72. The scanner change led to a negative shift in BPF values. The magnitude of the rate of change was overestimated when hardware changes were ignored as in the original models. However, accounting for hardware changes had little impact on the treatment effect, the difference in slopes between treatment groups.
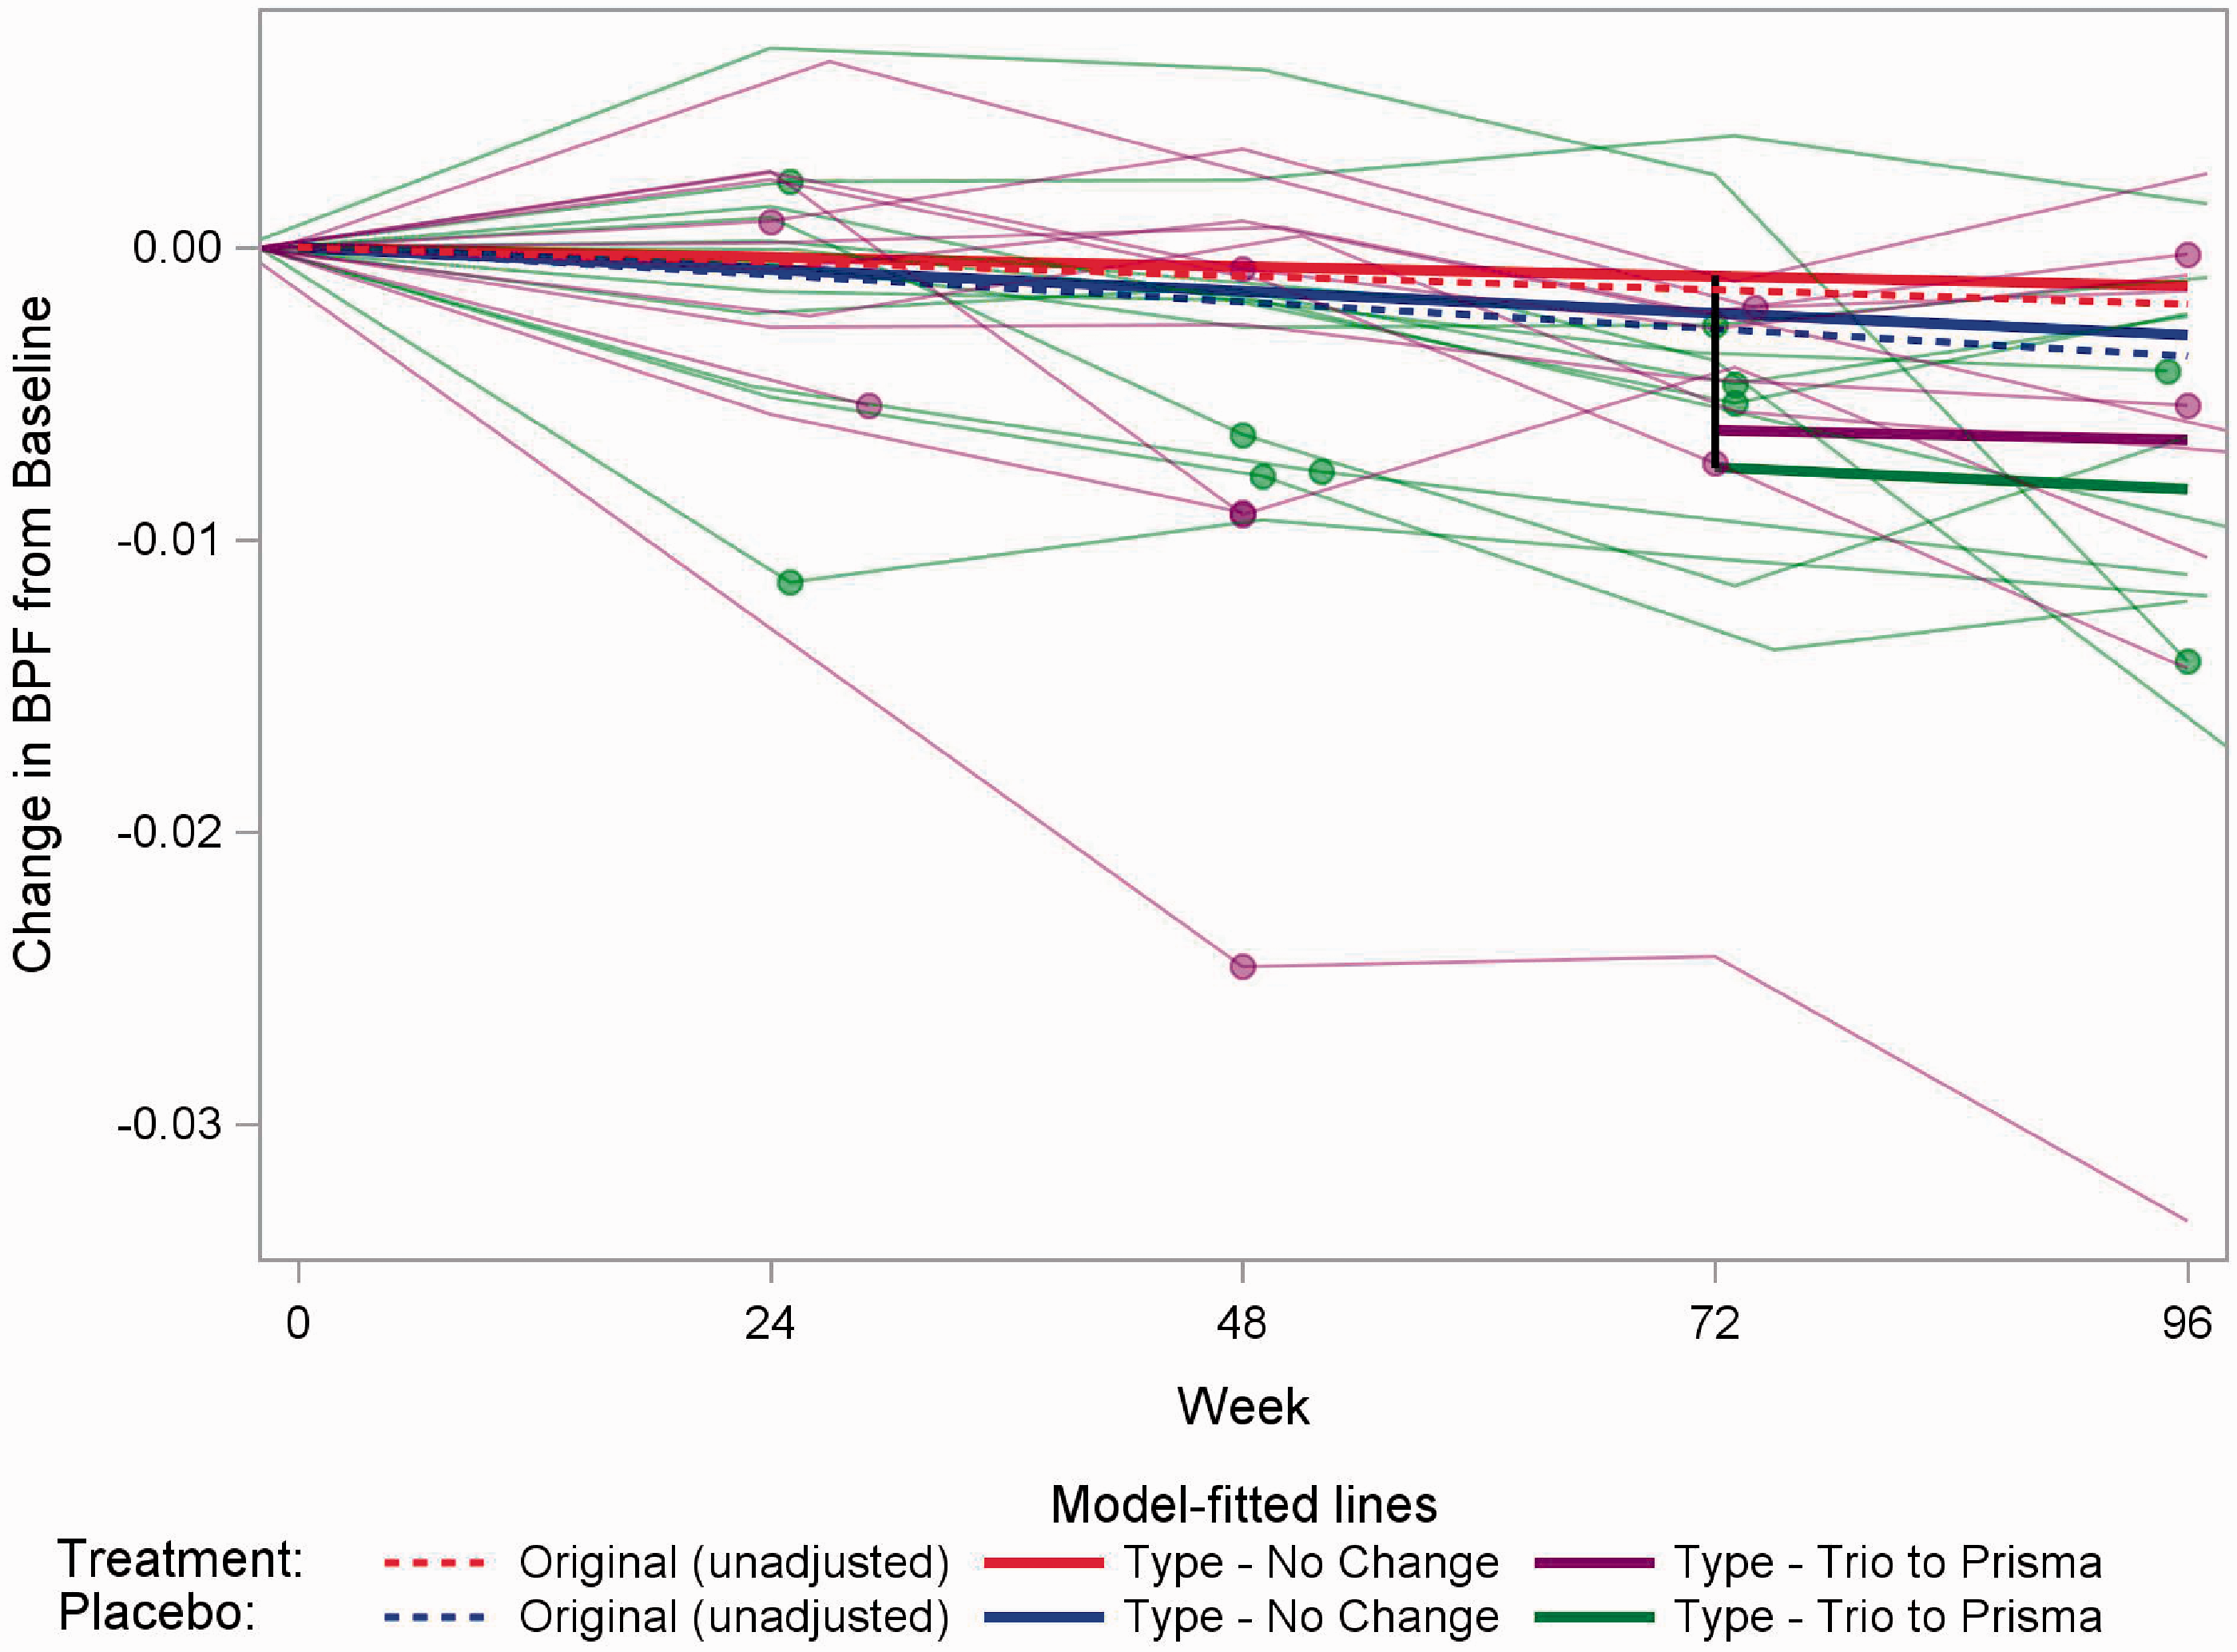
Illustration of results for BPF and the effect of one of the three common types of scanner change (Siemens Trio to Siemens Prisma). The dashed red (blue) line is the result from the model for the treatment (placebo) group in the original model, in which there was no adjustment for scanner change. The solid red (blue) line is the estimate for the treatment (placebo) group assuming no scanner change from the model that adjusts for type of scanner change. The values of the slopes of the red and blues lines are given in Table 2. The vertical black line indicates the shift in values associated with an example scanner change occurring at week 72 (Table 3). The solid thick purple (green) line is the estimated change over time for the treatment (placebo) group after the example scanner change at week 72 from the model that adjusts for type of scanner change. The solid red (blue) and purple (green) lines are parallel; the effect of the upgrade is illustrated by the shift down (black line). The solid thin purple (green) lines show individual patients’ data for the subset of treatment (placebo) patients who experienced a scanner change from a Siemens Trio to a Siemens Prisma. The dots indicate the time of the first scan after the scanner change for a patient (not necessarily occurring at week 72). Sensitivity analyses excluding the outlying subject (purple line at bottom) were considered and had no effect on the conclusions drawn.
Figure 2 focuses on TD and the effect of a scanner change of GE HDxt to Siemens Skyra. Here the estimated change over time within the treatment (placebo) groups was underestimated in the original model not adjusting for scanner changes. The magnitude of the shift due to scanner change is large, but had only a slight impact on the overall treatment effect.

Illustration of results for TD and the effect of a scanner change of one of the three common types of scanner change (GE HDxt to Siemens Skyra). The dashed red (blue) line is the result from the model for the treatment (placebo) group in the original model, in which there was no adjustment for scanner change. The solid red (blue) line is the estimate for the treatment (placebo) group assuming no scanner change from the model that adjusts for type of scanner change. The values of the slopes of the red and blues lines are given in Table 2. The vertical black line indicates the shift in values associated with an example scanner change occurring at week 72 (Table 3). The solid thick purple (green) line is the estimated change over time for the treatment (placebo) group after the example scanner change at week 72 from the model that adjusts for type of scanner change. The solid red (blue) and purple (green) lines are parallel; the effect of the upgrade is illustrated by the shift down (black line). The solid thin purple (green) lines show individual patients’ data for the subset of treatment (placebo) patients who experienced a scanner change from a GE HDxt to Siemens Skyra. Individual patient TD values were averaged over the left and right side when plotting. The dots indicate the time of the first scan after the scanner change for a patient (not necessarily occurring at week 72).
Discussion
This analysis found that hardware changes affected estimates of atrophy and diffusivity but had little impact on the overall outcomes of the trial. The direction and magnitude differed among type of hardware change and between imaging-based measures. Retrospective analyses of the effect of scanner changes have been performed,7,18 but typically focus on a single imaging measure. Our results highlight the need to consider different imaging measures separately and to account for the type of hardware change. Although BPF and TD are measured on the same scanner at each visit, the nature of the measures differs and thus are differently affected by scanner changes. Different behavior may be seen among other secondary measures, which will be examined in future work.
The study design can offset some of the effect of equipment changes. If equipment changes are randomly distributed between treatment and placebo arms, occur relatively infrequently and largely affect shifts in the outcome, the consequences may be minimal (Table 2) even if the shift and associated variability due to hardware change is large (Table 3). The shifts associated with hardware changes (Table 3) are an order of magnitude larger than the annual changes (Table 2), but accounting for these changes had only small impacts on treatment effect. Assessments of longitudinal change within a treatment group and single-arm trials may be more susceptible to biases introduced by equipment changes. A sensitivity analysis could be performed to determine the degree to which imbalances in equipment changes might affect the results.
Much work has investigated imaging hardware associated differences. Prospective measurement can determine if systematic differences are smaller than physiological differences of interest.19,20 Phantom measurements can be used to measure differences17,20–23 and can help minimize systematic differences prospectively, 24 but may not relate to in vivo measurements. 25 It may be difficult to access newly-released hardware for prospective measurements. Retrospective harmonization26,27 is an active field but has not, to our knowledge, been extensively tested in a randomized controlled trial.
A number of other factors have been explored. Retrospective analysis of the SPRINT-MS data showed that the time by treatment effect differs between the secondary and primary progressive groups. 28 We used a four-way interaction of time, treatment group, MS diagnosis and scanner upgrade to explore if the treatment effect differed by scanner upgrade within each MS diagnosis group. We did not detect an effect, but this analysis is likely to be underpowered. We reported differences arising from hardware types among healthy controls 16 and variances may differ among hardware types but such differences were not included in the original models. In an exploratory analysis, we adjusted for baseline differences in acquisition systems by adding a categorical variable for baseline scanner type in equation (4). We also investigated differences in variance in the imaging outcomes across scanner model by specifying scanner model-specific residual variance. 29 This was done by modifying the covariance parameters of equation (4) to allow heterogeneous residual variance across scanner models in addition to the random intercept and slope. Neither of these analyses resulted in substantial changes in the results.
Conclusions
Because imaging hardware changes can be expected in imaging-based clinical trials, anticipating the impact of such changes on the trial outcomes and adjusting the analysis plan is prudent. Accounting for the hardware change can be important, but the specific type of imaging metric and hardware change should be considered.
Supplemental Material
sj-pdf-1-mso-10.1177_20552173211010843 - Supplemental material for Influence of equipment changes on MRI measures of brain atrophy and brain microstructure in a placebo-controlled trial of ibudilast in progressive multiple sclerosis
Supplemental material, sj-pdf-1-mso-10.1177_20552173211010843 for Influence of equipment changes on MRI measures of brain atrophy and brain microstructure in a placebo-controlled trial of ibudilast in progressive multiple sclerosis by Ken Sakaie Josef Debbins Paola Raska Robert J Fox in Multiple Sclerosis Journal–Experimental, Translational and Clinical
Footnotes
Declaration of Conflicting Interests
The author(s) declared the following potential conflicts of interest with respect to the research, authorship, and/or publication of this article: KS has received salary support from Genzyme and Novartis. RJF has received personal consulting fees from AB Science, Actelion, Biogen, Celgene, EMD Serono, Genentech, Immunic, Novartis, Sanofi, Teva, and TG Therapeutics, has served on advisory committees for Actelion, Biogen, Immunic, Novartis, and Sanofi, and has received clinical trial contract and research grant funding from Biogen and Novartis. JKF, JWY, KN, JD, MJL and PR have no relevant conflicts to disclose.
Funding
The author(s) disclosed receipt of the following financial support for the research, authorship, and/or publication of this article: This work was supported by grants from the National Institute of Neurological Disorders and Stroke (U01NS082329) and the National Multiple Sclerosis Society (RG 4778-A-6) and by MediciNova through a contract with the National Institutes of Health.
Supplemental Material
Supplemental material for this article is available online.
References
Supplementary Material
Please find the following supplemental material available below.
For Open Access articles published under a Creative Commons License, all supplemental material carries the same license as the article it is associated with.
For non-Open Access articles published, all supplemental material carries a non-exclusive license, and permission requests for re-use of supplemental material or any part of supplemental material shall be sent directly to the copyright owner as specified in the copyright notice associated with the article.