
Abstract
Objective/Background
The majority of multiple sclerosis patients experience impaired walking ability, which impacts quality of life. Timed 25-foot walk is commonly used to gauge gait impairment but results can be broadly variable. Objective biological markers that correlate closely with patients’ disability are needed. Diffusion tensor imaging, quantifying fiber tract integrity, might provide such information. In this project we analyzed relationships between timed 25-foot walk, conventional and diffusion tensor imaging magnetic resonance imaging markers.
Design/Methods
A cohort of gait impaired multiple sclerosis patients underwent brain and cervical spinal cord magnetic resonance imaging. Diffusion tensor imaging mean diffusivity and fractional anisotropy were measured on the brain corticospinal tracts and spinal restricted field of vision at C2/3. We analyzed relationships between baseline timed 25-foot walk, conventional and diffusion tensor imaging magnetic resonance imaging markers.
Results
Multivariate linear regression analysis showed a statistically significant association between several magnetic resonance imaging and diffusion tensor imaging metrics and timed 25-foot walk: brain mean diffusivity corticospinal tracts (p = 0.004), brain corticospinal tracts axial and radial diffusivity (P = 0.004 and 0.02), grey matter volume (p = 0.05), white matter volume (p = 0.03) and normalized brain volume (P = 0.01). The linear regression model containing mean diffusivity corticospinal tracts and controlled for gait assistance was the best fit model (p = 0.004).
Conclusions
Our results suggest an association between diffusion tensor imaging metrics and gait impairment, evidenced by brain mean diffusivity corticospinal tracts and timed 25-foot walk.
Introduction
Over 80% of multiple sclerosis (MS) patients experience impaired walking ability during the course of their illness, and intact ambulation has been ranked as one of the most important factors for maintaining a good quality of life. 1 Subsequent need of assistive devices signifies disease progression and accrual of disability, as reflected by an emphasis on ambulatory function in the Expanded Disability Status Scale (EDSS), the most widely used MS disability scale. Given the influence of ambulation on everyday life activities, gait impairment has been a target of rehabilitation strategies and of dalfampridine, a broad spectrum potassium channel blocker that is the only US Food and Drug Administration-approved symptomatic treatment for gait disturbances.2–4
Among multiple disease monitoring methods utilized for gait and disability assessment, timed 25 foot walk (T25FW) has been commonly used in clinical practice and research trials. Recent meta-analysis found T25FW to be a well-characterized assessment tool with high reliability and validity; however, these advantages are offset by possible practice effects, differences in administration and day-to-day performance variability, especially in patients with greater disability.5,6 We have previously shown a widely variable therapeutic response to dalfampridine using this measure. 7 This observation reflects an unmet need for more objective assessment methods correlating closely with patients’ disability.
Conventional magnetic resonance imaging (MRI) techniques have significant limitations in MS, including only modest correlation with clinical measures of disability, such as T25FW. 8
Diffusion tensor imaging (DTI) measures diffusional (Brownian) motion of water molecules, yielding information about the integrity of white matter (WM) tracks. 9 The combination of mean diffusivity (MD) and index of fractional anisotropy (FA), derived from tensor calculations, provides more sensitive information regarding potential interruption of neural pathways and demyelination than can be seen on conventional MRI sequences.10,11 The role and utility of DTI in MS has previously been studied in the brain.9,12,13 For example, there is a well-established significant correlation between brain DTI and conventional MRI metrics, such as T2 lesion volume, grey matter (GM) and WM volume. Brain DTI metrics have also been shown to correlate with level of disability as measured by the EDSS and MS Functional Composite (MFSC).14,15 However, fewer studies have evaluated DTI metrics in the spinal cord, and T25FW has not been widely reported as a separate outcome measure of clinical disability.15,16
To develop initial pilot data in the field of imaging biomarkers of clinical disability this project aimed to identify the relationship between T25FW and both conventional MRI and DTI metrics. We hypothesized that characterization of neural pathways with DTI metrics will be associated more closely with T25FW impairment than will conventional MRI metrics.
Methods
This study was approved by the institutional review board of the Icahn School of Medicine at Mount Sinai and all participants provided informed consent.
Participants
Patients with a diagnosis of relapsing–remitting multiple sclerosis (RRMS), secondary progressive multiple sclerosis (SPMS) and primary progressive multiple sclerosis (PPMS) based on current diagnostic criteria17,18 were enrolled at the Corrine Goldsmith Dickinson Center for Multiple Sclerosis. Eligible subjects were all participants in a previously established database of gait impaired patients we intended to treat with dalfampridine. Additional eligibility criteria for this study included treatment with dalfampridine for 3 months or longer, start of dalfampridine treatment within 2 years from the enrolment and at least two T25FW measurements within 2 years before dalfampridine treatment. Of a total of 61 patients included in the database, 41 were excluded from this study because of: (a) dalfampridine treatment duration of less than 3 months (10 patients); (b) insufficient T25FW measurements (seven patients); (c) dalfampridine start more than 2 years before enrolment (21 patients); and (d) patients with uncertain MS diagnosis (three patients). Thirteen of 18 eligible patients agreed to participate, and after providing informed consent underwent MRI of the brain and cervical spine including DTI scans between October 2013 and March 2014.
The timed 25 foot walk
The T25FW data were extracted from the medical records. This measure is obtained during each routine visit, using a standardized test track, in accordance with methods described in the Administration and Scoring Manual published by the National Multiple Sclerosis Society. 19 Mean T25FW time was calculated using data obtained during at least two separate clinical visits. For this project we used only dalfampridine pre-treatment baseline T25FW data.
MRI acquisition
All brain and cervical spinal cord MRI studies were performed on a 3-Tesla scanner (Magnetom Skyra, Siemens Healthcare, Erlangen, Germany), using a 20-channel head and spine coil. The brain MRI protocol included: (a) axial T2 fluid-attenuated inversion recovery (FLAIR) (TR/TE/TI: 9000/96/2504 ms; field of vision (FOV): 201 × 230; matrix: 280 × 320; yielding 50 contiguous 3 mm-thick slices); (b) sagittal 3D T1 MPRAGE (TR/TE/TI: 2400/2.1/1000 ms; yielding 0.9 × 0.9 × 0.9 mm3 isotropic voxels); (c) single-shot echo planar imaging (EPI) sequence for DTI (TR/TE: 11300/91 ms; b-values: 0, 1000 s/mm2, 20 non-collinear directions, pixel size: 1.95 × 1.95 mm2 yielding 50 contiguous, axial 3 mm-thick slices). The cervical spine MRI protocol included: (a) sagittal short tau inversion recovery (STIR) (TR/TE: 5840/37 ms; FOV: 236 × 140; matrix: 192 × 227; yielding 15 contiguous 4 mm-thick slices); (b) axial T2 MEDIC (TR/TE: 757/14 ms; FOV: 180 × 180; matrix: 320 × 356; yielding 30 contiguous 3 mm-thick slices); (c) sagittal 3D T1 MPRAGE (TR/TE/TI: 1670/2.1/1000 ms; yielding 1 × 1 × 1 mm3 isotropic voxels); (d) axial single-shot EPI for DTI (TR/TE: 4100/75 ms; b-values: 0, 500 s/mm2 20 non-collinear directions, pixel size: 1.37 × 1.37 mm2; yielding 30 contiguous, axial 3 mm-thick slices).
MRI analysis
Lesion volume assessment
The T2-hyperintense and T1-hypointense lesion volumes were measured by experienced assessors using a semi-automated segmentation technique based on user-supervised local thresholding (Jim version 3; Xinapse Systems, Northants, England). 20 The T2-weighted lesion area was measured by determining lesions’ borders on FLAIR images. The T1-hypointense lesions were defined as lesions with signal intensity between cerebrospinal fluid (CSF) and GM using T1-weighted scans. The total brain T2 and T1 lesion volume was calculated by multiplying lesion area by slice thickness.
Brain volume assessment
The normalized brain volume, and normalized GM and WM volumes were measured on lesion-filled T1-weighted image using SIENAX, 21 part of FMRIB Software Library (FSL). 22 Briefly, SIENAX performs brain extraction, followed by tissue segmentation to separate GM, WM and CSF. A normalization factor is calculated based on the subject’s skull size and is applied to the calculated volumes.
Cervical spinal cord lesion load, volume and cross-sectional area
Spinal cord lesions hyperintense to normal-appearing cord tissue were detected and counted on T2-weighted scans by a neuroradiologist. Spine volume (SV) and cervical cord cross-sectional area were measured on the STIR scan from C2 to C3 using a semi-automatic segmentation method. 23 First, the sagittal STIR was reformatted and resampled axially, with the image plane perpendicular to the cord at the C2/C3 disk level. On this image, a marker was placed in correspondence to the inferior border of C3. Then, moving back up from C3, two markers were placed after every two slices, until the fifth slice from the first marker was reached. An active surface method was therefore applied, using the markers of the cord centerline as input. Using these landmarks, automatic calculation of spine volume was derived. The mean cord area was calculated dividing the cord volume by the cord length. To compensate for the biological variation of structural measurements unrelated to disease effects, SV was subsequently normalized dividing by the number of slices (SVn). 24
Brain DTI
Analysis of diffusion-weighted brain and spine data was performed with the FSL
diffusion toolbox, FDT. First, images were corrected for head movement and distortions
caused by eddy currents using affine registration of each volume to the first volume
(b = 0). FA and MD maps were calculated by fitting the diffusion
tensor at each voxel using DTIFIT. The FA map was used for affine registration of
individual diffusion images to the corresponding T1-weighted images using
FLIRT.25,26 All T1-weighted images
were then registered to a common standard space template (MNI 152 atlas at 1 mm
resolution) using affine registration. We used the JHU WM tractography atlas
(thresholded at 25% probability) provided with FSL to identify the left and right
corticospinal tract (CST).
27
Inverting the transformations from diffusion to MNI space
calculated above we registered the JHU WM tractography atlas to each individual
diffusion space and averaged the FA and MD values within the left and right CST mask
(Figure 1). Axial and radial
diffusivity measures were obtained from the brain DTI scans. The
fractional anisotropy (FA) map with overlaying corticospinal tract (CST) mask
derived from the JHU white matter tractography atlas. Mean FA values were
calculated within each CST.
Cervical spinal cord DTI
As described for the brain, diffusion-weighted images were first corrected for eddy
current distortion and head movements by affine registration to the first volume
(b = 0). Then, coarse masks of the spine were drawn by hand and the
diffusion tensor was fitted at each voxel within the mask by DTIFIT, resulting in MD and
FA maps of the spine. Next, we created more conservative masks of the spine, based on
the FA map, of the top five slices, roughly corresponding to C2–C3. The calculated mean
FA and MD within these masks were used for statistical analysis (Figure 2). The spine fractional anisotropy
(FA) map with overlaying principal vector map. This was used to identify the main
direction of the tracts. The manual C2/C3 mask was used to obtain mean spine FA
and mean diffusivity values. Univariate association between T25FW and brain DTI
metrics. Univariate association between T25FW and conventional brain
MRI metrics.

Statistical analysis
All statistical analyses were performed using IBM SPSS Statistics 22 (Chicago, Illinois, USA). P values of less than 0.05 were considered statistically significant. Participants’ demographic data and imaging data were characterized using descriptive statistics. Distribution of data was tested using the Shapiro–Wilk normality test. Association between basic demographic data and T25FW was assessed using Pearson correlation analysis, t-test and analysis of variance (ANOVA). Multivariate linear regression was used to identify relationships between T25FW and MRI data. We first constructed graphic plots of all independent variables and T25FW to inspect the linearity of relationships visually. We then constructed linear regression models for each imaging metric individually to identify the model with the best fit.
Results
Baseline demographic characteristics
Baseline clinical characteristics.

RRMS: relapsing–remitting multiple sclerosis; SPMS: secondary progressive multiple sclerosis; PPMS: primary progressive multiple sclerosis.
Gait/and imaging assessments
Timed 25 foot walk (T25FW).
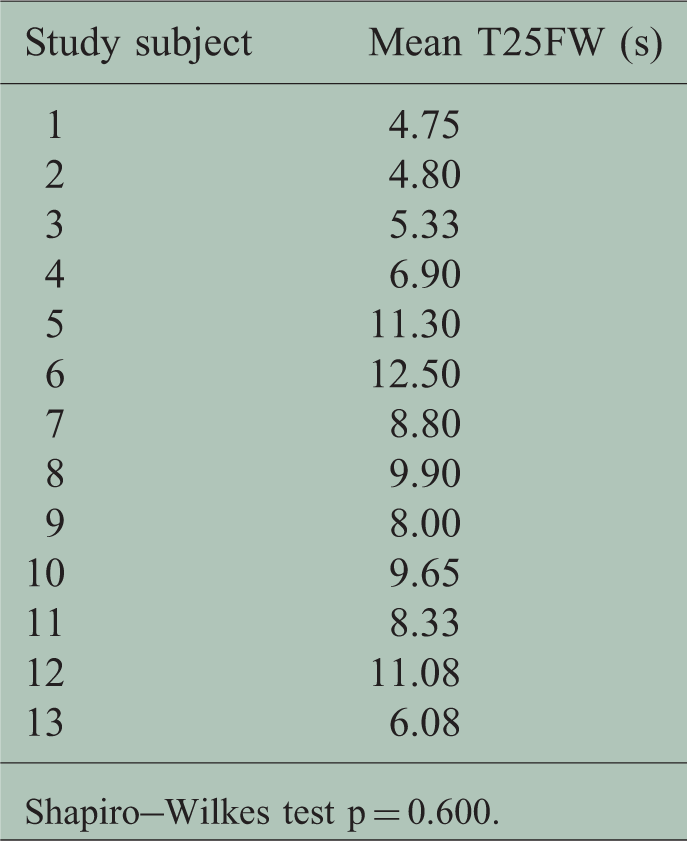
Shapiro–Wilkes test p = 0.600.
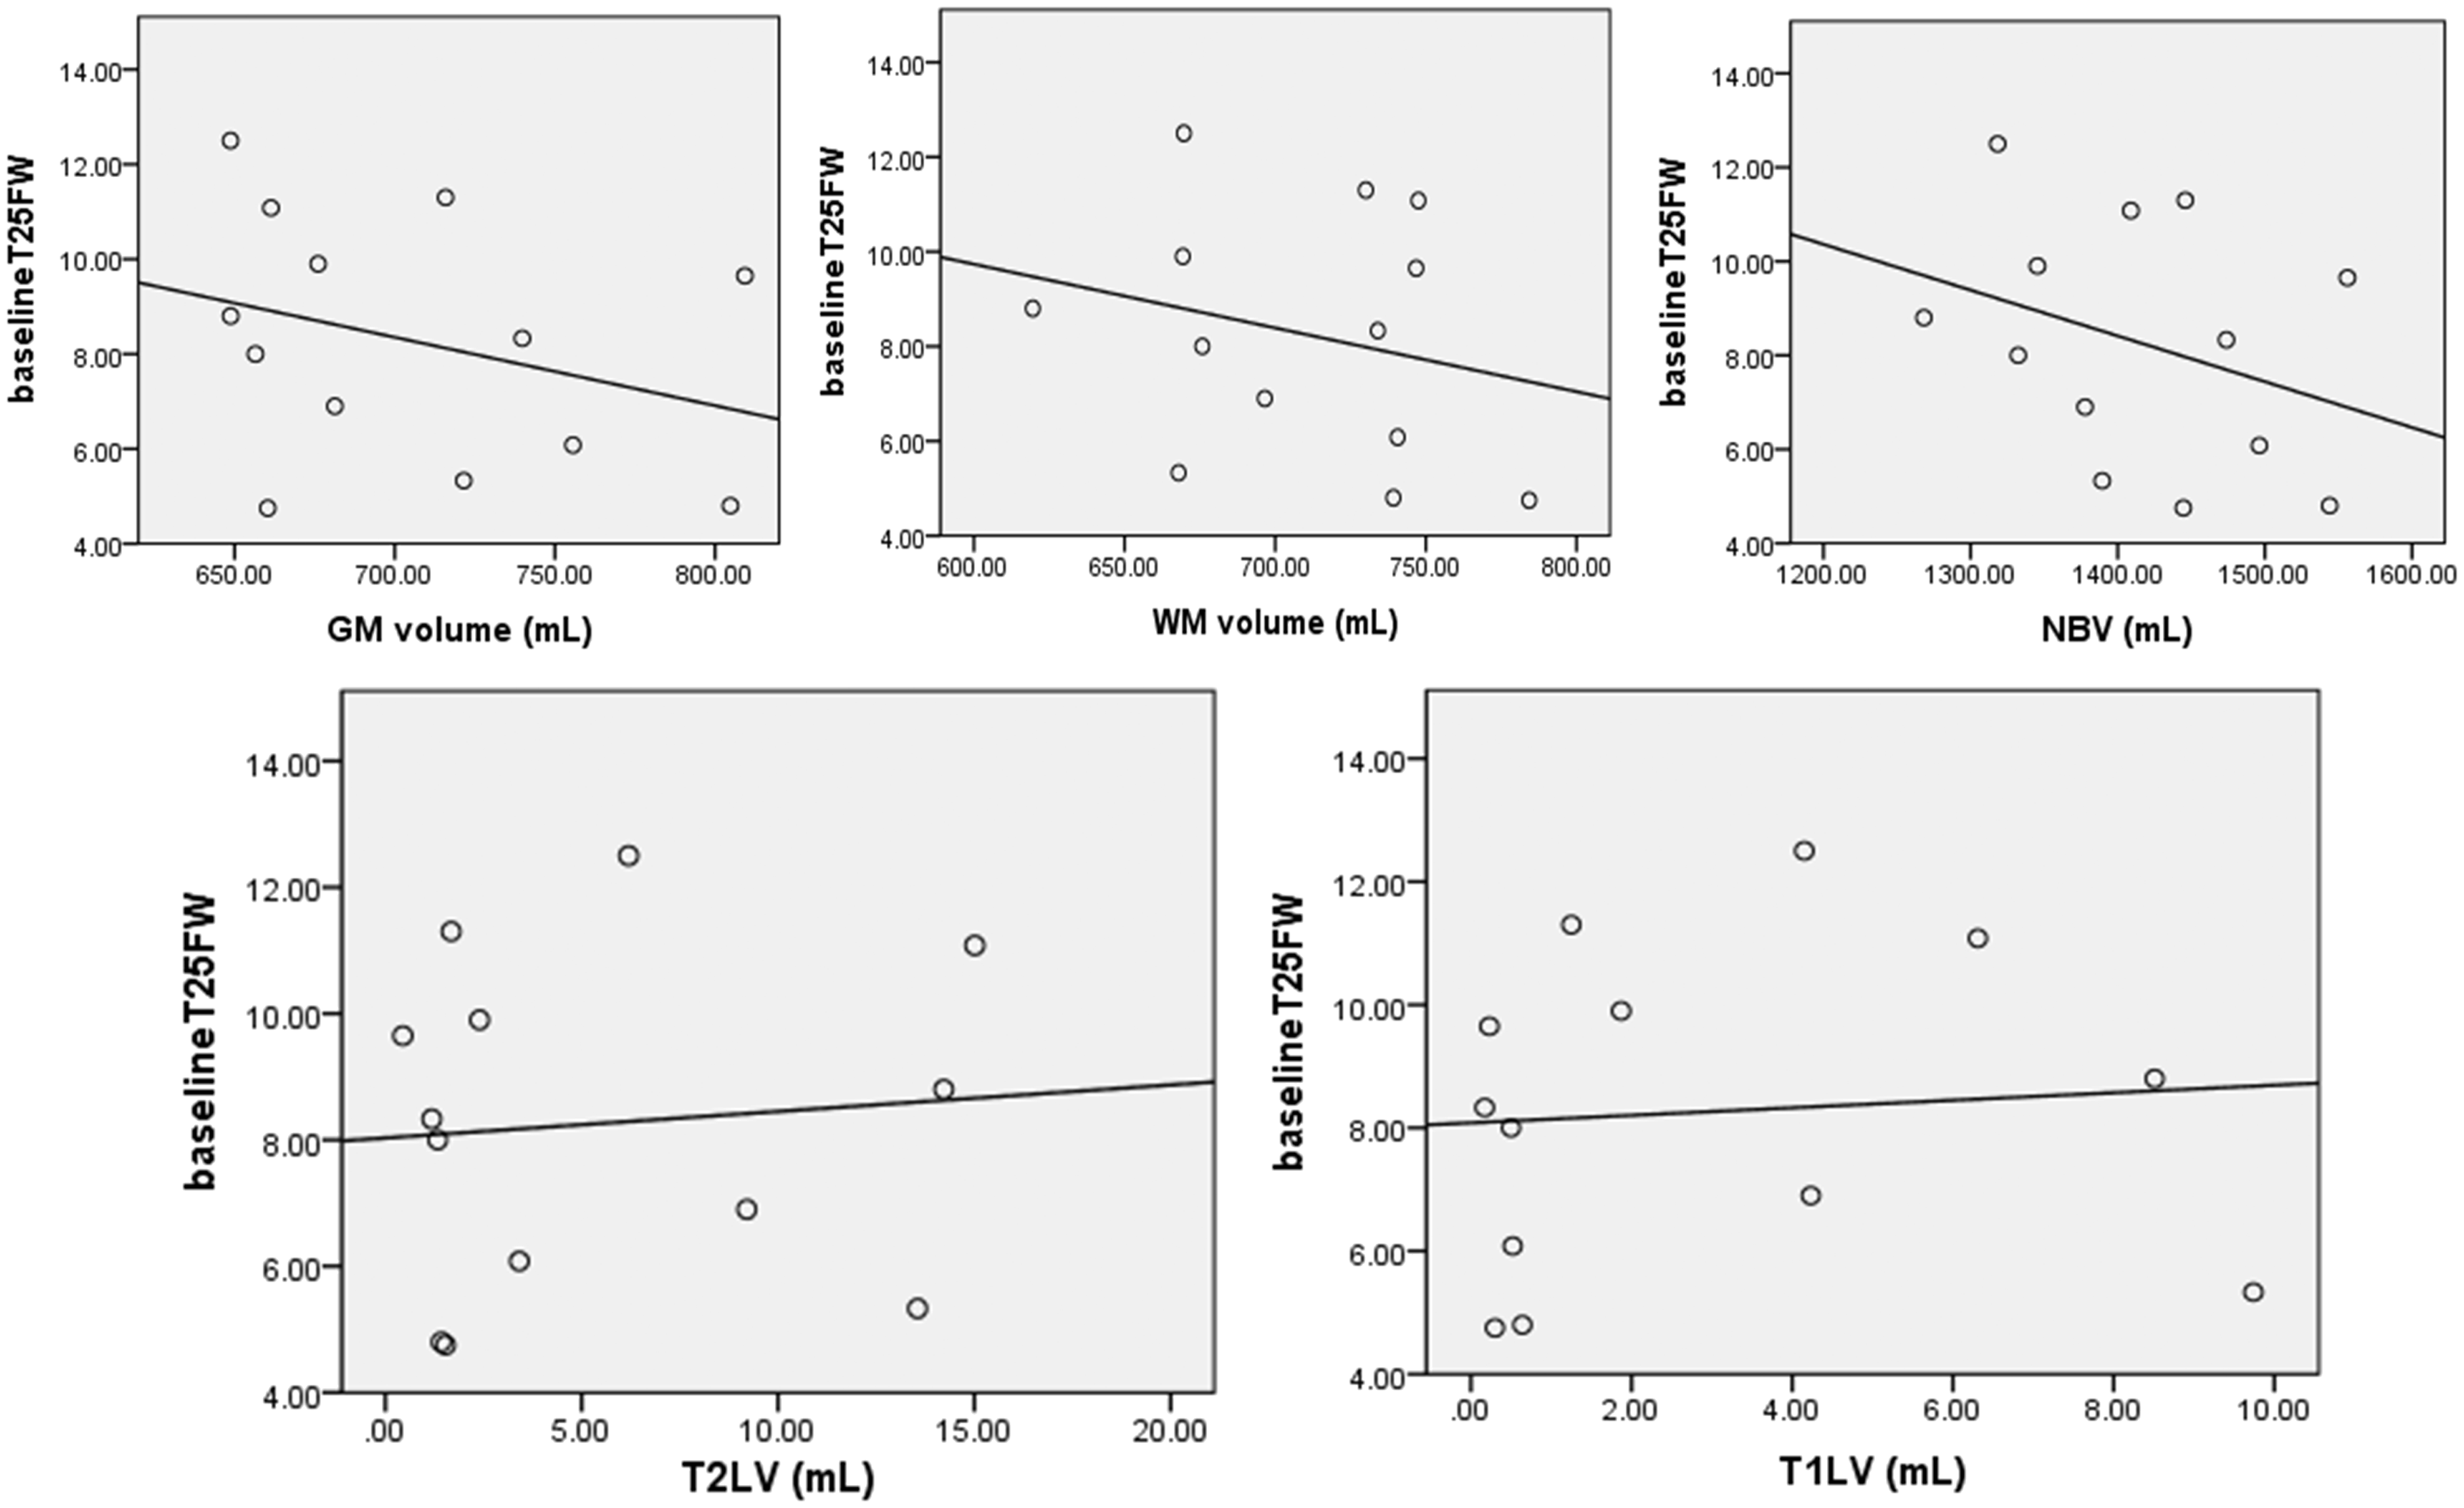
Conventional MRI metrics.

Values not calculated.
MRI: magnetic resonance imaging; T1LV: T1 lesion volume; T2LV: T2 lesion volume; GM: grey matter; WM: white matter: NBV: normalized brain volume.
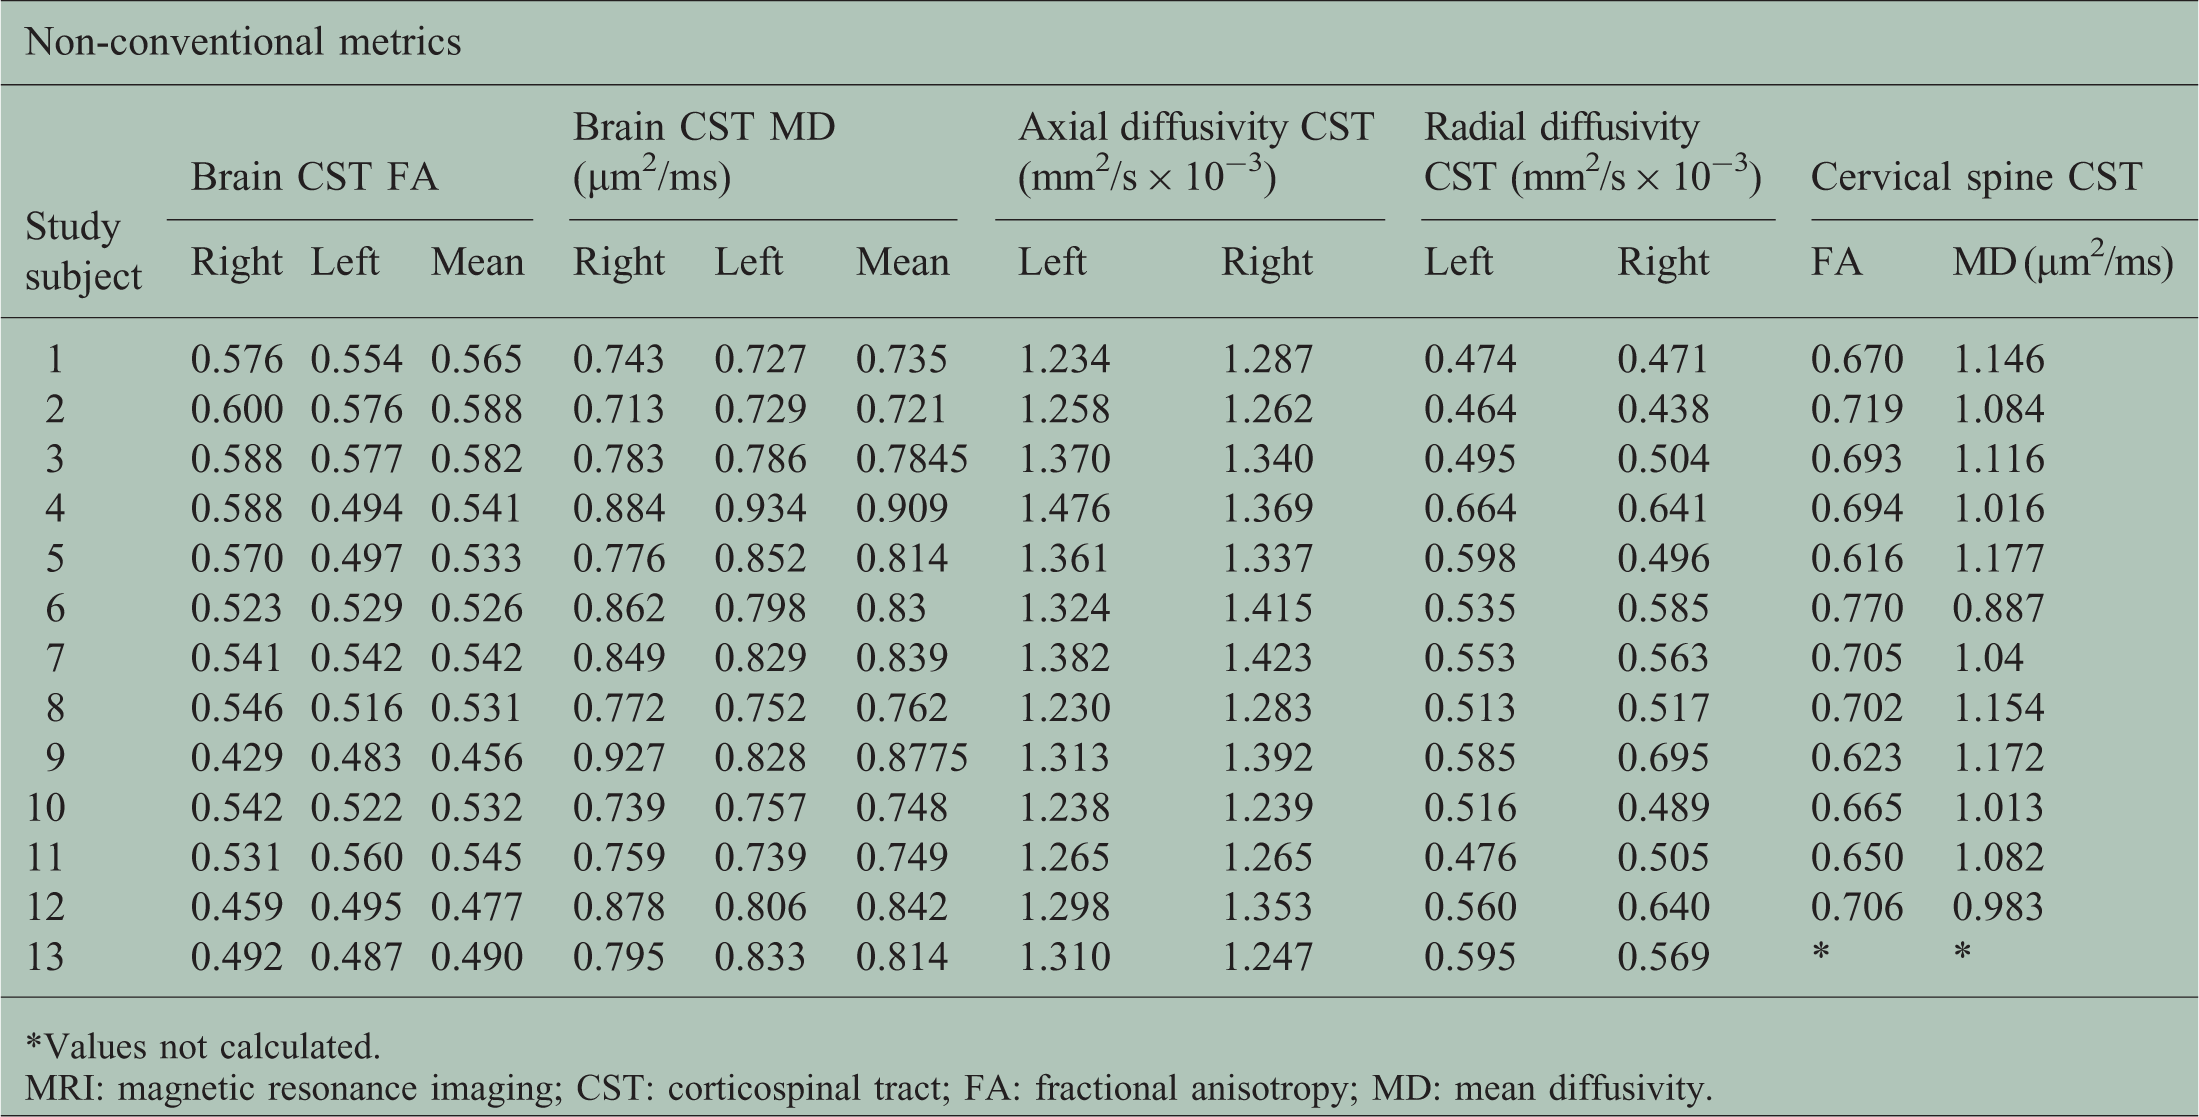
Non-conventional MRI metrics.
Values not calculated.
MRI: magnetic resonance imaging; CST: corticospinal tract; FA: fractional anisotropy; MD: mean diffusivity.
Association between MRI metrics and gait impairment.

MRI: magnetic resonance imaging; CST: corticospinal tract; FA: fractional anisotropy; MD: mean diffusivity; NS: not significant; GMV: grey matter volume; WMV: white matter volume; T1LV: T1 lesion volume; T2LV: T2 lesion volume; CSV: Cervical spine volume.
MD and FA were measured in brain CSTs and in the cervical cord at C2/3 region. Axial and radial diffusivity were measured in brain CST. Table 4 further depicts the DTI metrics in our sample. Mean brain CST FA was 0.53 (SD 0.038), mean CST MD was 0.8 × 10⁻³ µm2/ms (SD 0.06). Mean brain CST axial diffusivity was 1.32 mm2/s × 10−3 (SD 0.06) and mean brain CST radial diffusivity was 0.54 mm2/s × 10−3 (SD 0.06). Mean spinal FA was 0.68 (SD 0.04) and mean MD was 1.08 × 10⁻³ µm2/ms (SD 0.087) (Table 4).
Association between T25FW and baseline clinical characteristics (age, gender, race, disease duration, type of MS and gait assistance) were assessed using t-test and ANOVA. Only disease type (RRMS, SPMS or PPMS) and type of gait assistance (none, unilateral or bilateral) were significantly associated with T25FW (p = 0.05 and 0.003, respectively).
The relationship between T25FW, conventional MRI and DTI metrics was assessed using
multivariate linear regression while controlling for gait assistance as a potential
confounder. Graphic representations of the univariate association between independent
variables (brain and C spine conventional and DTI metrics) and T25FW are depicted in Figures 3–5.
Multivariate linear regression analysis showed a statistically significant association
between the following MRI and DTI metrics and T25FW: brain MD CST (p = 0.004), brain CST
axial and radial diffusivity (p = 0.004 and 0.02), GM volume (p = 0.05), WM volume
(p = 0.03) and NBV (p = 0.01). The linear regression model containing MD CST and
controlled for gait assistance was the best fit model (p = 0.004) (Table 5). Univariate association between
T25FW and cervical spine DTI and conventional MRI metrics.
Discussion
This study evaluated relationships between T25FW and conventional and DTI MRI metrics, thus contributing to existing data exploring the role of advanced imaging techniques in MS.
The novelty of our approach lies in the attempt to identify the relationship between modern neuroimaging techniques and an objective measure of gait impairment, noting that only a few previous studies utilized T25FW in this way. Our analysis of the association between T25FW and basic demographic characteristics showed a statistically significant correlation between MS clinical phenotype, gait assistive device and T25FW. These findings are in agreement with earlier work showing that substantial gait impairment was present in the majority of patients who transitioned into SPMS 28 and serves as an internal consistency marker for our database.
We found a statistically significant relationship between gait impairment as measured by the T25FW and measures of brain volume loss, including grey, white and whole-brain atrophy. We did not find a relationship between T25FW and lesion metrics in the brain or spinal cord, nor with spinal cord volume. These findings are congruent with previous research showing, at most, a weak relationship between clinical disability and conventional MRI metrics in the brain or spinal cord.29,30 This aspect of our results further emphasizes the need for novel MRI metrics to understand better the pathological substrate of clinical disability in MS.
Using DTI metrics, we demonstrated a significant association between tract integrity of the brain CST (measured by CST MD) and gait impairment (measured by T25FW) while controlling for use of an assistive device. Our findings are in agreement with a previously observed relationship between brain CST MD and corticospinal tract impairment using T25FW as a clinical measure. 31 Comparison of associations between conventional MRI and DTI metrics and gait dysfunction in our study suggested DTI metrics, specifically brain CST MD, have the stronger association with gait impairment. This could be explained by the higher sensitivity of DTI metrics for axonal damage and consequent disability. Recent work by Tovar-Moll and colleagues 32 showed a significant association between brain CST FA and motor and sensory functional systems of the EDSS and T25FW. In their analyses of the univariate relationship between DTI metrics and EDSS and T25FW, respectively, FA showed higher statistical significance. After controlling for chronic T1 lesion volume, only the association between CST FA and EDSS, but not T25FW, remained statistically significant. 32 Using a different methodological approach, we were able to demonstrate an association between brain CST MD and T25FW. However unlike another previous study of cervical spine DTI metrics and measures of clinical disability by Naismith and colleagues, we did not demonstrate a relationship between T25FW and cervical cord DTI indices. 16
The results of our study should be interpreted with caution and several limitations must be recognized. Project participants were part of an established database of gait impaired patients we intended to treat with dalfampridine, and as such had to meet inclusion criteria for this database as well as for the current imaging sub-study. Application of these criteria resulted in a small sample size with consequences on the generalizability of our analyses. However, this was a pilot project and we intend to use these data to develop a larger sample for further investigation, including novel imaging predictors of dalfampridine response. Known technical difficulties related to spinal DTI are due to small cord size and increased cord mobility resulting in motion artifacts. 9 Present anatomical distortions on DTI maps, often seen in column-specific tract region of interest, can also prevent accurate localization of anatomical tracts. To address these technical limitations, we measured mean FA and MD indices using a single fixed and easily measured area of interest at C2–3, as this region has maximal yield for DTI analysis. 33 Using multiple regions of interest at different cord levels could provide more data and the possibility of finding additional correlations. A similar technique with use of an area of interest at the C3–4 level was previously reported; however, the sample size in that study was substantially higher (124 MS patients). 15
The atlas methodology used in our project also confers certain analysis limitations. Recognizing that regional atrophy can cause partial volume effects that might affect the results, we tried to minimize this impact by using a very conservative threshold to create the individual tracts (80% probability). While using tractography to construct individual tracts could have been preferable to the atlas methodology, the available diffusion data with 20 directions are unsuitable for a tractography approach, as a minimum of 25 directions is required to resolve fibers successfully. 34
In conclusion, our study adds to existing data focusing on the clinical utility of DTI in MS and constitutes a platform for our ongoing research in dalfampridine response predictors. We specifically analyzed brain DTI markers using gait impairment as the target outcome. We plan to utilize these results to investigate brain and spinal cord DTI metrics further, focusing on brain CST MD as a main candidate biomarker to predict dalfampridine response.
Footnotes
Declaration of conflicting interests
S Klineova and R Farber have received compensation for advisory board work with Teva. BN Delman has received compensation for consulting and advisory board work with Bayer HealthCare. LN Tanenbaum has received compensation for consulting with Siemens. M Inglese has received research grant support from NIH, NMSS, Novartis Pharmaceuticals and Teva Neuroscience. FD Lublin has received compensation for consulting and advisory board work with Bayer HealthCare Pharmaceuticals, Biogen Idec, EMD Serono, Inc., Novartis, Teva Neuroscience, Actelion, Sanofi/Genzyme, Acorda, Questcor/Malinckrodt, Roche/Genentech, Celgene, MedImmune, Osmotica, Xenoport, Receptos, Forward Pharma, BBB Technologies, Akros, TG Therapeutics and Abbvie, and sources of funding for research from Biogen Idec, Novartis Pharmaceuticals Corp, Teva Neuroscience, Inc., Genzyme, Sanofi, Celgene, Transparency Life Sciences, NIH and NMSS. S Krieger has received compensation for consulting and advisory board work with Acorda Therapeutics, Bayer HealthCare, Biogen Idec, EMD Serono, Genentech, Genzyme, Questcor, and Teva, and has given non-promotional lectures with Biogen Idec and Genzyme. C Farrell, C Saiote and J Friedman have nothing to disclose.
Funding
The imaging portion of this project was supported by grant UL1TR000067 from the National Center for Research Resources, National Institutes of Health.