
Abstract
Background
Cognitive dysfunction is a known symptom of multiple sclerosis (MS), with memory recognized as a frequently impacted domain. Here, we used high-resolution MRI at 7 tesla to build on cross-sectional work by evaluating the longitudinal relationship of diffusion tensor imaging (DTI) measures of the fornix to episodic memory performance.
Methods
A sample of 80 people with multiple sclerosis (mean age 51.9 ± 8.1 years; 24% male) underwent baseline clinical evaluation, neuropsychological assessment, and MRI. Sixty-four participants had follow-up neuropsychological testing after 1–2 years. Linear regression was used to assess the relationship of baseline imaging measures to follow-up episodic memory performance, measured using the Selective Reminding Test and Brief Visuospatial Memory Test. A reduced prediction model included cognitive function at baseline, age, sex, and disease course.
Results
Radial (β = -0.222, p < 0.026; likelihood ratio test (LRT) p < 0.018), axial (β = -0.270, p < 0.005; LRT p < 0.003), and mean (β = -0.242, p < 0.0139; LRT p < 0.009) diffusivity of the fornix significantly added to the model, with follow-up analysis indicating that a longer prediction interval may increase accuracy.
Conclusion
These results suggest that fornix DTI has predictive value specific to memory function in MS and warrants additional investigation in the drive to develop predictors of disease progression.
Keywords
Introduction
Cognitive decline affects more than half of people with multiple sclerosis (pwMS) and is increasingly recognized as one of the more disabling symptoms of the disease.1,2 Increased understanding of the impact of cognitive dysfunction is reflected by the swell of research into the neuropsychological characteristics of cognitive phenotypes in MS, environmental and neuropathological precursors to decline, and development of measures that can identify individuals at risk. 3 A measure that quantifies individual risk of cognitive decline could serve as an inclusion/exclusion criterion for clinical trials of novel drug therapies and ultimately be used to guide treatment decisions.
Multiple phenotypes of cognitive dysfunction have been identified in pwMS, although previous work reports processing speed and memory as the most frequently impaired domains. 4 The hippocampus plays a key role in episodic memory, with both hippocampal atrophy and demyelination well-described in pwMS.5,6 However, the thin and undulating layer of hippocampal white matter complicates in vivo assessment of myelin integrity. An alternative is the largest efferent white matter tract of the hippocampus, the fornix (Figure 1). In healthy adults, tissue integrity measured by diffusion tensor imaging (DTI) of the fornix is related to episodic memory performance, 7 and transection of the fornix leads to deficits in spatial episodic memory in animal models. 8 In pwMS, fornix diffusion is consistently abnormal9,10 and has been associated with verbal and visual spatial episodic memory.9–12 Taken together, these findings suggest that DTI of the fornix reflects tissue integrity in a region that has significant implications for memory.

Example of fornix region of interest. Thalamus and hippocampus are included for orientation. (a) Left hemisphere view from posterior midline. (b) Left hemisphere view from midline. Red = fornix, dark blue = thalamus, cyan = hippocampus.
Here, we use high-resolution MRI at 7 tesla (7 T) to evaluate the longitudinal relationship of DTI measures of the fornix and memory performance in pwMS, building on previous cross-sectional findings at 3 tesla. 10 We first confirm the cross-sectional relationship in a new sample, then use longitudinal data to evaluate the hypothesis that DTI of the fornix predicts later memory function.
Methods
Sample
Eighty-two pwMS took part in baseline visits (time point 1, T1) from January 2017 to February 2019. Two participants could not complete the MRI scans and were administratively withdrawn, resulting in a final T1 sample of 80. Sixty-four of 80 participants returned for follow-up testing after 1 year (time point 2, T2). Half of the sample (n = 40) was asked to return for a third visit after 2 years (time point 3, T3). Of those, 35 completed T3. Figure 2 illustrates the sample at each time point and details reasons for non-completion. All data were acquired after written informed consent, approved by the Cleveland Clinic Institutional Review Board (Federalwide Assurance number 00005367).

Visualization of sample at each time point, including sample size and study procedures. Half of the T1 sample was asked to return for T3 (n = 40). Tf combines data from the last available visit, either T2 (n = 29) or T3 (n = 35), for all participants with follow-up data. Research suspension refers to visits that were canceled due to COVID-19-related suspension of research activities in March 2020. COG = neuropsychological assessment; NE = neurological exam; Tf = time point final.
Clinical and neuropsychological evaluations
At T1 and T2, participants underwent a neurological assessment and rating on Kurtzke Expanded Disability Status Scale (EDSS) 13 by an experienced MS neurologist. They completed the Beck Depression Inventory (BDI), Nine-Hole Peg Test, including dominant hand (9HPd) and non-dominant hand (9HPnd), and the Timed 25-Foot Walk (25FW).
A trained psychometrist administered neuropsychological tests at T1, T2, and T3 (Table 1). Starting at T1, counterbalanced alternate forms were used to mitigate test-retest effects. For each measure, z-scores were calculated by correcting for demographic variables and were used for all subsequent analyses. Selective reminding test (SRT) measures were corrected for age and sex. 14 All other measures in Table 1 were corrected for age, sex, and years of education (EDU). 15 The Nine-Hole Peg test, 25-Foot walk, and symbol digit modalities test (SDMT) were used to derive the multiple sclerosis functional composite (MSFC) score. 16
Neuropsychological tests.

The following measures were derived for analysis:
MEMAVG—As in previous work,
17
we calculated a composite score by averaging normalized performance on relevant measures. Here, a domain score representing episodic memory was calculated by averaging z-scored measures from the SRT (long-term storage, consistent long-term retrieval, and delayed recall) and the brief visuospatial memory test (BVMT; total learning and delayed recall). MEMAVG serves as the primary outcome measure. ΔMEMAVG—The change in MEMAVG was calculated as [T2 or T3 MEMAVG z-score - T1 MEMAVG z-score], so that a negative ΔMEMAVG value indicates decline. MEMAVG intact and impaired—A secondary analysis split participants by T1 MEMAVG, where MEMAVG > -1.5 was considered intact memory and ≤ -1.5 was considered impaired memory, as previously published.
4
COGAVG—To estimate general cognitive ability at baseline, all T1 z-scored measures listed in Table 1 were averaged.
MRI acquisition
Both T1 and T2 included MRI scanning. The current study tests the predictive power of imaging data collected at T1 and does not include analysis of T2 imaging data. Participants were scanned on a Siemens Magnetom 7 T MRI scanner with SC72 gradient (Siemens Medical Solutions, Erlangen) using a 1 Tx/32 Rx head coil (Nova Medical, Wilmington). Scans included:
Whole-brain coverage, T1-weighted MP2RAGE
18
: 255 0.75 mm thick axial slices; field of view (FOV) 192 × 192 mm; matrix 256 × 256; voxel size 0.75mm3; TI/TE/TR/flip angle, 800 ms and 2700 ms/3.0/6000 ms/4° and 5°; BW 238 Hz/pixel; scan time 9 min, 51 s. Whole-brain coverage, SPACE 3D FLAIR: 144 1 mm thick sagittal slices; FOV 192 × 192 mm; matrix 192 × 192; voxel size 1mm3; TI/TE/TR/FA = 3120 ms/321 ms/8000 ms/120°; BW 401 Hz/pixel; scan time 7 min, 21 s. DTI: 100 1 mm thick axial slices; FOV 192 × 192 mm; matrix 192 × 192; voxel size 1mm3; TE/TR = 61.1 ms/11,400 ms; BW 1532 Hz/pixel; 60 noncollinear diffusion-weighting gradients with b = 1000 s/mm2 and 5 with b = 0 s/mm2; GRAPPA 3; scan time 12 min.
MRI post-processing
DTI post-processing included motion correction, 19 unwarping, 20 and the voxel-wise calculation of diffusion tensors, resulting in 21 axial diffusivity (AD), radial diffusivity (RD), and the derived measures fractional anisotropy (FA) and mean diffusivity (MD).
Bilateral fornix regions of interest (ROIs) were drawn manually for each participant using the MP2RAGE in Talairach space. 22 In the coronal view, the fornix ROI began at first slice showing the posterior commissure and continued to the fimbria (Figure 1). The MP2RAGE was coregistered to the unwarped mean b = 0 image 23 and the resulting transformation matrix was applied to the fornix ROIs. ROIs were inspected in DTI space to ensure accuracy. Bilateral fornix volume and mean FA, RD, MD, and AD were calculated for each participant. Lesion volume (LV) and brain parenchymal fraction (BPF) were calculated using the MP2RAGE and FLAIR images.24,25
Statistical analysis
Final time point sample (Tf). Due to the large amount of missing data at T3, our main analysis used two, rather than three, time points for each participant. To take advantage of the T3 data while using all participants, we selected the last available data point for all participants with follow-up data (final time point dataset (Tf); Figure 2). Tf consisted of T2 data for the 29 participants for whom T2 was the final time point and T3 data for the remaining 35 participants. For each participant, the time point used in Tf was indicated by the variable YEARS, calculated as: (days between T1 and Tf)/365.
Initial analysis. T1 neuropsychological and imaging measures were compared to age, EDU, disease duration (DD), and BDI using Pearson correlations. Unpaired t-tests were used to assess sex differences. Paired t-tests were used to compare clinical and neuropsychological variables between time points. Pearson correlations were used to assess the relationship of T1 imaging measures to MEMAVG. After false discovery rate (FDR) correction, 26 T1 imaging measures that showed a significant relationship to Tf MEMAVG were included in subsequent analysis.
Main analysis: Linear mixed effects regression (LME) assessing the relationship of MRI to MEMAVG. LME implemented in R 27 was used to assess the relationship of T1 imaging measures to Tf MEMAVG. For each imaging measure, the full model was [YEARS + T1 COGAVG + age + sex + disease course + imaging measure]. YEARS accounts for the time from T1 to Tf. COGAVG was entered to control for baseline cognitive ability. Covariate selection was based on the relationship to neuropsychological and imaging measures and included age, sex, and disease course (in this sample, relapsing remitting MS (RRMS) or secondary progressive MS (SPMS)). Random intercepts were used for the effect of participant. Each imaging variable was tested separately using an omnibus approach, where a reduced model (omitting the imaging variable) was compared to the full model using the likelihood ratio test (LRT). The FDR was applied to the LRT results for all included imaging measures.
Sub-analysis: Comparison of T2 and T3. A subset of our cohort had MEMAVG measures at both T2 and T3, allowing a direct investigation of time and the utility of MEMAVG as a long-term predictor. For imaging variables that reached significance in the main analysis, two LME analyses were run using an identical set of participants—one used the T2 MEMAVG score and the second used the T3 MEMAVG score. Because this analysis used a relatively small dataset and compared the same participants, only covariates that were significant in the main analysis were included (T1 COGAVG). Model fit was compared using Akaike's information criterion (AIC).
Sub-analysis: Contribution of T1 MEMAVG. To investigate the potential impact of T1 memory performance, participants were split into intact and impaired groups by T1 MEMAVG. Group comparisons used unpaired t-tests for T1 imaging variables that reached significance in the main analysis. Within-group correlations were used to investigate if relationships between imaging measures and MEMAVG were driven by either the intact or impaired groups, and imaging measures were correlated with ΔMEMAVG.
Results
Sample
The final sample consisted of 80 pwMS at T1, 64 at T2, and 35 at T3 (Figure 2). Table 2 shows baseline demographic and clinical characteristics. The T1 sample included 64 participants with RRMS and 16 with SPMS. Fifty-nine participants were on some form of disease modifying therapy at T1 (see Supplementary Information). Table 3 shows clinical characteristics at each time point. Paired t-tests did not show a significant change in EDSS (p < 0.456) or MSFC (p < 0.247) from T1 to T2, although 11 participants showed an increase in EDSS of 1 point or more at T2.
Baseline demographic and clinical characteristics.
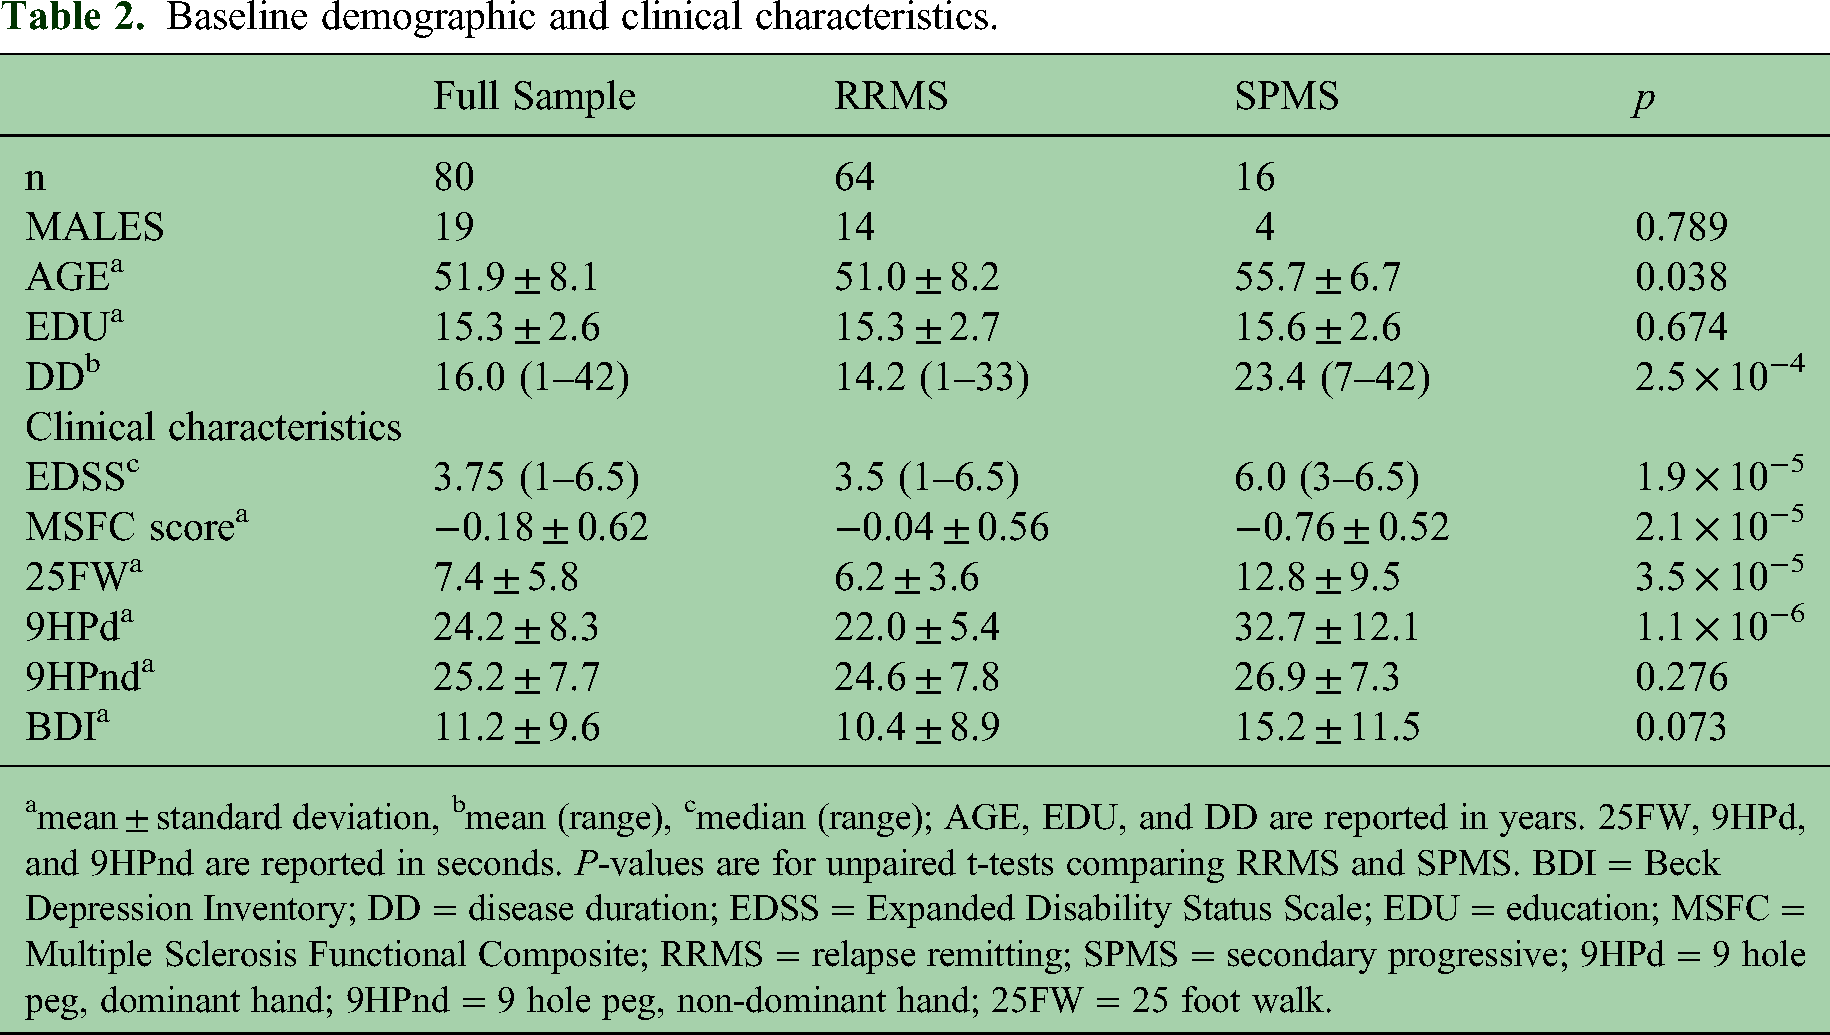
mean ± standard deviation, bmean (range), cmedian (range); AGE, EDU, and DD are reported in years. 25FW, 9HPd, and 9HPnd are reported in seconds. P-values are for unpaired t-tests comparing RRMS and SPMS. BDI = Beck Depression Inventory; DD = disease duration; EDSS = Expanded Disability Status Scale; EDU = education; MSFC = Multiple Sclerosis Functional Composite; RRMS = relapse remitting; SPMS = secondary progressive; 9HPd = 9 hole peg, dominant hand; 9HPnd = 9 hole peg, non-dominant hand; 25FW = 25 foot walk.
Clinical characteristics measured at each time point.

mean ± standard deviation, bmedian (range); 25FW, 9HPd, and 9HPnd are reported in seconds. BDI = Beck Depression Inventory; EDSS = Expanded Disability Status Scale; MSFC = Multiple Sclerosis Functional Composite; YEARS = mean years from baseline; 9HPd = 9 hole peg, dominant hand; 9HPnd = 9 hole peg, non-dominant hand; 25FW = 25 foot walk.
Neuropsychological measures
Table 4 shows mean z-scored neuropsychological test performance at T1 and Tf (raw scores are reported in Table S1). Despite the use of alternate test forms, paired t-tests showed improved performance at Tf on D-KEFS-CS, D-KEFS-DES, SDMT-TOT, PASAT-TOT, and COGAVG (p < 0.02). Age was related to BVMT-TOT, SDMT-TOT, COWAT-TOT, and PASAT-TOT (p < 0.05).
Neuropsychological test performance.

Z-scores reported as mean ± standard deviation. T1 v Tf shows p-values for paired t-tests. Bold indicates significance at the p < 0.05 level. COGAVG = average cognitive score; MEMAVG = average memory score; SRT=selective reminding test. See Table 1 for additional neuropsychological test abbreviations.
Figure S1 shows the percent of participants scoring ≤ -1.5 (impaired) on each test. At T1, 58 participants scored > -1.5 (intact) on MEMAVG and 22 scored impaired. Among the 47 intact participants with follow-up data, five showed a ΔMEMAVG score of ≤ -1.0 (consistent with decline). None of the 17 impaired participants showed a ΔMEMAVG score of ≤ -1.0.
Imaging measures
T1 diffusion measures were not related to age, EDU, DD, or BDI, but were related to T1 MSFC (p < 0.027). BPF was related to age (r = -0.285, p < 0.010), DD (r = -0.351, p < 0.001), and MSFC (r = 0.343, p < 0.002). LV was related to DD (r = 0.348, p < 0.002) and MSFC (r = -0.371, p < 9.8 × 10⁻⁴). Fornix AD was significantly higher in males compared to females (p < 0.034). LV was significantly higher in SPMS compared to RRMS (p < 0.006), although other imaging measures showed no differences. T1 imaging measures that showed a significant relationship to Tf MEMAVG (Table 5) were included in subsequent LME analyses, resulting in the exclusion of fornix volume from further analysis. Table S2 shows the relationship of imaging measures to performance on individual cognitive tests at T1.
Pearson correlations of baseline imaging measures and MEMAVG at each time point.
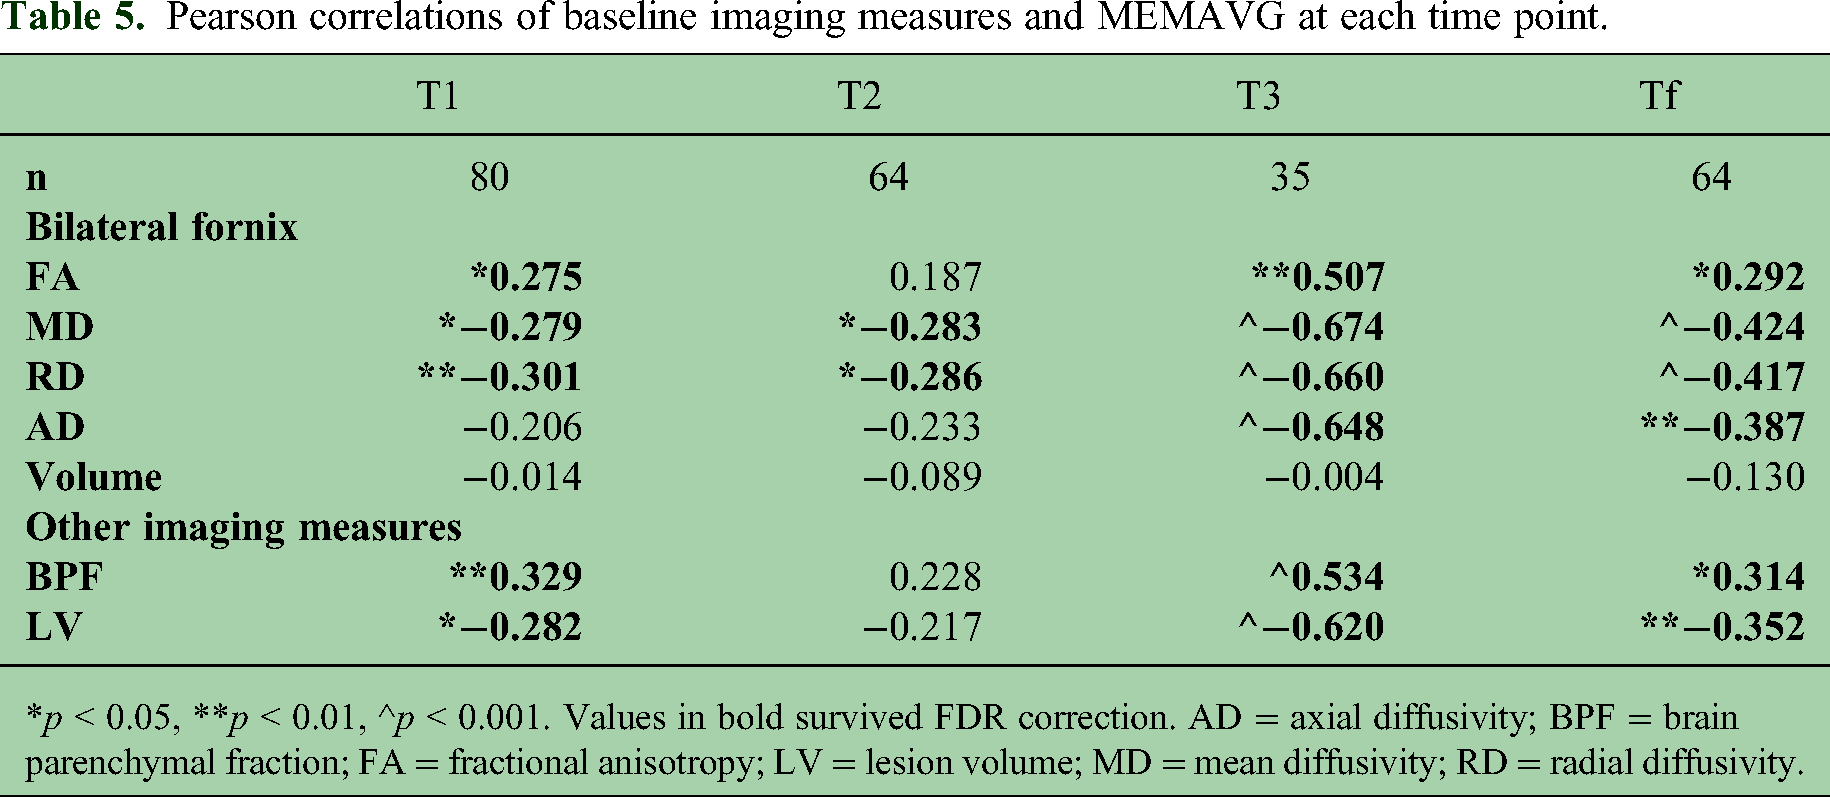
*p < 0.05, **p < 0.01, ^p < 0.001. Values in bold survived FDR correction. AD = axial diffusivity; BPF = brain parenchymal fraction; FA = fractional anisotropy; LV = lesion volume; MD = mean diffusivity; RD = radial diffusivity.
Main analysis: LME assessing the relationship of imaging to MEMAVG
Sixty-four participants were included in the LME analysis of Tf. Full and reduced LME model comparisons assessing the relationship of T1 imaging measures to MEMAVG are shown in Table 6. Column “LRT p” shows that MD, RD, and AD fornix values survived FDR correction (p < 0.02), all with a significant effect of the corresponding imaging variable in the full model (p < 0.03; see Table 6 column “Imaging”). As expected, T1 COGAVG was highly significant in all models (p < 4.0 × 10⁻⁸), although none of the models showed a significant effect of YEARS, age, sex, or disease course. Table S3 shows that separate analysis of the left and right fornix returned similar results to those of bilateral measures, with the bilateral analysis returning the greatest change in AIC for MD and RD.
Results of LRT and full LME models for the relationship of baseline imaging variables to Tf MEMAVG. n = 64.

LRT p-values in bold survived FDR correction. LR = likelihood ratio; LRT = likelihood ratio test; AIC = Akaike's Information Criterion; RMSE = root mean square error; AD = axial diffusivity; BPF = brain parenchymal fraction; FA = fractional anisotropy; LV = lesion volume; MD = mean diffusivity; RD = radial diffusivity; DC = disease course.
Sub-analysis: comparison of T2 and T3
Thirty-five participants had MEMAVG measures at both T2 and T3. For MD, RD, and AD, a simplified LME model [COGAVG + imaging measure] was run twice, once with outcome measure T2 MEMAVG and once with T3 MEMAVG. Table 7 shows that no imaging variables reached significance in the T2 analysis, while all were significant at T3 (p < 0.001; although note this analysis did not include comparison to a reduced model). For all imaging measures, AIC values were lower for the T3 analysis.
Comparison of LME results for T2 MEMAVG and T3 MEMAVG. n = 35.

AIC = Akaike's Information Criterion; RMSE = root mean square error; AD = axial diffusivity; MD = mean diffusivity; RD = radial diffusivity.
Sub-analysis: contribution of T1 MEMAVG
Compared to intact (n = 58), the impaired group (n = 22) had higher MD (p < 0.046) and RD (p < 0.032) but no difference in AD (p < 0.094). Within-group correlations between T1 MEMAVG and imaging measures did not reach significance, suggesting that the T1 correlations shown in Table 5 are driven by impaired and intact differences. However, relationships of Tf MEMAVG to MD (r = -0.359, p < 0.013), RD (r = -0.335, p < 0.021), and AD (r = -0.348, p < 0.017) were significant for the intact group (n = 47) but not for the impaired group (n = 17). Figure 3 shows RD plotted against T1 and Tf MEMAVG. The distribution suggests that, although the impaired group contributes to the overall relationship, the intact group may be responsible for the predictive relationship over time. This suggestion is bolstered by the significant relationship of ΔMEMAVG to AD (r = 0.300, p < 0.041) in the intact group (Figure 4), although MD and RD did not reach significance. No relationships to ΔMEMAVG were found in the impaired group.

Fornix RD at T1 plotted against MEMAVG at T1 (top) and tf (bottom), with associated Pearson correlation coefficients. INT = intact; IMP = impaired; RD = radial diffusivity.

Relationship of fornix AD and ΔMEMAVG in INT participants (n = 47), with associated Pearson correlation coefficients. Participants with higher AD at T1 have a larger decline in MEMAVG. Negative ΔMEMAVG indicates decline. AD = axial diffusivity.
Discussion
Alterations in fornix DTI measures have been repeatedly reported in pwMS,9,10,28,29 with multiple studies finding relationships between fornix DTI measures and cognitive function. Early work, including the cross-sectional data that formed the basis for the current study, found relationships to visual and verbal episodic memory9–12 and speed of processing. 11 The current work finds similar cross-sectional relationships in a sample of 80 pwMS (Table S2), and our longitudinal analysis confirms that fornix DTI has predictive value specific to memory function. MD, RD, and AD all reached significance in the main analysis, suggesting that both axonal damage30,31 and demyelination31,32 may contribute to our results.
BPF and LV did not reach significance in the main analysis, despite previous reports of predictive value in MS.33,34 In contrast to DTI, BFP and LV were significantly related to clinical variables such as DD, disease course, and MSFC. Although baseline relationships of BFP and LV to MEMAVG were similar to that of RD, they did not show the same strengthening at the final time point. It is possible that BFP and LV are more suited to the prediction of overall disease progression rather than specific domains such as memory or cognitive function.
Baseline DTI was more strongly related to MEMAVG at T3 than at T2 (Table 5), suggesting that DTI may function as a long-term predictor. The direct comparison of T2 vs. T3 confirmed this finding, showing a clear advantage to the longer prediction interval (Table 7). Although based on a small sample, this finding suggests that DTI-based prediction of cognitive decline in pwMS may be optimized by the use of a longer prediction interval.
Participants were enrolled without regard to cognitive status, resulting in a range of memory function at baseline. Although there is no standard definition of “impairment” in the MS literature, 35 our categorization used an average composite score and the commonly published normalized score ≤ -1.5 to indicate memory impairment.4,35 Impaired vs. intact participants showed differences in baseline imaging measures, raising the possibility that “prediction” was driven by changes that had already occurred at baseline. Indeed, the lack of within-group relationships of DTI to baseline MEMAVG suggested this may be the case. However, the significant relationship between baseline DTI and later memory function in the intact group provides evidence that a change in those with intact memory function at baseline is driving prediction, bolstered by the relationship of AD to the change in memory function. Although the smaller size of the impaired group means that a lack of power cannot be ruled out, early changes in fornix microstructure have been reported in pwMS. 29 Additional work focusing on those with intact memory performance could result in a more accurate predictive model of decline.
Recent publications suggest language and attention impairment may be more common than previously reported in pwMS, 36 and have reported relationships of fornix DTI to cognitive performance in domains other than memory.28,37 In that light, our intentional focus on memory could be considered a limitation. Although our neuropsychological battery probed multiple domains, the majority were represented by a single test, precluding a detailed evaluation of domain-specific performance and prediction.
Using high-resolution 7 T MRI, this analysis confirmed a cross-sectional relationship between DTI of the fornix and memory performance in pwMS. Baseline measures of fornix MD, RD, and AD significantly added to a prediction model of memory even after accounting for cognitive function at baseline, suggesting that DTI measures of the fornix could be developed as predictors of disease progression. Follow-up analysis found that accuracy of prediction may be optimized by the use of a longer prediction interval and a focus on patients with intact memory function. A critical criterion for any such marker is clinical application. The high-resolution DTI used here requires long scan times and the measurement of COGAVG requires administration of a lengthy cognitive battery. Future work will focus on development and testing of clinically suitable substitute measures, such as shorter DTI scans and the use of readily available information as a substitute for baseline cognitive function.
Supplemental Material
sj-docx-1-mso-10.1177_20552173241240937 - Supplemental material for High-resolution diffusion tensor imaging of the fornix predicts memory function in multiple sclerosis
Supplemental material, sj-docx-1-mso-10.1177_20552173241240937 for High-resolution diffusion tensor imaging of the fornix predicts memory function in multiple sclerosis by Katherine A. Koenig, Ken E. Sakaie, Daniel Ontaneda, Kedar R. Mahajan, Se-Hong Oh, Kunio Nakamura, Stephen E. Jones, Stephen M. Rao and Mark J. Lowe in Multiple Sclerosis Journal – Experimental, Translational and Clinical
Supplemental Material
sj-docx-2-mso-10.1177_20552173241240937 - Supplemental material for High-resolution diffusion tensor imaging of the fornix predicts memory function in multiple sclerosis
Supplemental material, sj-docx-2-mso-10.1177_20552173241240937 for High-resolution diffusion tensor imaging of the fornix predicts memory function in multiple sclerosis by Katherine A. Koenig, Ken E. Sakaie, Daniel Ontaneda, Kedar R. Mahajan, Se-Hong Oh, Kunio Nakamura, Stephen E. Jones, Stephen M. Rao and Mark J. Lowe in Multiple Sclerosis Journal – Experimental, Translational and Clinical
Footnotes
Acknowledgements
We thank Siemens Healthineer Tobias Kober for use of WIP944.
Data availability statement
Due to privacy concerns, the datasets generated during the current study are not publically available. They are available from the corresponding author dependent on a formal data sharing agreement with the Cleveland Clinic.
Declaration of conflicting interests
K.S. has received salary support from Genzyme and from Novartis. K.R.M. is funded by NIH NINDS and has received consultation fees from Bristol-Myers Squibb and Genentech. K.N. has received licensing fees from Biogen and fees from INmune Bio.
Funding
The author(s) disclosed receipt of the following financial support for the research, authorship, and/or publication of this article: This work was supported by the United States Department of Defense [MS150097].
ORCID iDs
Supplemental material
Supplemental material for this article is available online.
References
Supplementary Material
Please find the following supplemental material available below.
For Open Access articles published under a Creative Commons License, all supplemental material carries the same license as the article it is associated with.
For non-Open Access articles published, all supplemental material carries a non-exclusive license, and permission requests for re-use of supplemental material or any part of supplemental material shall be sent directly to the copyright owner as specified in the copyright notice associated with the article.