
Abstract
Background
Mesenchymal stem cells (MSC) have immunomodulatory and neuro-protective properties and are being studied for treatment of multiple sclerosis (MS). Tractography-based diffusion tensor imaging (DTI), cortical thickness (Cth) and T2 lesion volume (T2LV) can provide insight into treatment effects.
Objective
The objective of this study was to analyse the effects of MSC transplantation in MS on exploratory MRI measures.
Methods
MRIs were obtained from 24 MS patients from a phase 1 open-label study of autologous MSC transplantation. DTI metrics were obtained in lesions and normal-appearing white matter motor tracts (NAWM). T2LV and Cth were derived. Longitudinal evolution of MRI outcomes were modelled using linear mixed effects. Pearson’s correlation was calculated between MRI and clinical measures.
Results
Lesional radial diffusivity (RD) and axial diffusivity (AD) decreased pre-transplant and showed no changes post-transplant. There were mixed trends in NAWM RD and AD pre/post-transplant. Transplantation stabilized T2LV growth. NAWM RD and AD correlated with Cth, T2LV and with leg and arm function but not with cognition. Lesional DTI demonstrated similar but less robust correlations.
Conclusions
Microstructural tissue integrity is altered in MS. DTI changes pre-transplant may be influenced by concomitant lesion accrual. Contributor to DTI stabilization post-transplant is multifactorial. DTI of major motor tracts correlated well with clinical measures, highlighting its sensitivity to clinically meaningful changes.
Background
Multiple sclerosis (MS) is an immune-mediated demyelinating and neurodegenerative disease of the central nervous system (CNS). Current disease modifying therapies for MS reduce relapses and disability worsening. There are currently no approved medications to reverse neurological disability or repair injury in the CNS. Mesenchymal stem cells (MSC) are multipotent stromal cells with a high degree of plasticity. MSC have attracted attention as a potential treatment for MS because of their immunomodulatory and tissue repair properties 1 and because they can be isolated from various tissues, including bone marrow and adipose tissue, and culture-expanded for autologous administration. 2
Several phase-half studies of MSC in MS have been published.3–5 However, the majority have focused on clinical measures or conventional imaging measures as exploratory outcomes. Advanced quantitative imaging may provide more detailed insight into the effect of MSC on MS brain tissue pathology. Diffusion tensor imaging (DTI) enables characterization of tissue integrity through the measurement of water diffusion and thus can be sensitive to various pathological processes. DTI metrics include radial diffusivity (RD), a measure thought to relate to myelin integrity, axial diffusivity (AD), a proposed measure of axonal injury, fractional anisotropy (FA), a measure of overall tissue organization, and mean diffusivity (MD), an averaged measure of all water diffusion in tissue. 6
Conventionally, DTI analyses are either voxel-based, or local regions-of-interest (ROI) based. Although each has its own set of advantages, these methods may not be robust enough to correlate with clinical findings. 7 It has been reported that tractography-based DTI measures correlate better with clinical measures than whole brain or local DTI analyses,8–10 and that tractography-based methods can increase specificity of DTI to detect clinically meaning correlations.11,12
A previously published report of phase 1 study of autologous culture expanded MSC in MS included analysis of T1 lesion volume, brain parenchymal fraction, grey matter fraction and whole brain DTI. 13 In this study, we analysed regional lesion DTI and we utilised clinically relevant local ROIs to generate motor tract ROIs for tractography-based DTI analysis in an attempt to better reflect clinical changes in this cohort. In addition, we measured cortical thickness (Cth) as it has been proposed as a robust measure of grey matter integrity. 14 We also analysed the effect of MSC on T2-weighted lesion volume (T2LV) as it is one of the most well established MRI outcome measures in MS clinical trials. 15 We hoped to gain further insight on MSC mechanisms in MS from the combination of quantitative imaging measures.
Methods
Study design and intervention
An open-label, phase 1, pre-post comparison study with administration of MSC obtained through bone marrow aspiration with subsequent isolation and culture expansion was conducted. Participants enrolled into the study were followed for two months pre-transplantation, received MSC transplantation at the baseline visit (month 0), and were followed for six months post-transplantation. Study visits occurred at months –2, –1, 0, 1, 2, 3 and 6. The study was conducted at a single site (Cleveland Clinic Mellen Center for MS Treatment and Research) with MSC collection and expansion procedures conducted at Case Western Reserve University. Details on MSC isolation and culture expansion were previously published. 13 After MSC cultures met defined release criteria, participants received a single intravenous dose of 1–2 × 10⁶/kg body weight MSCs without premedication.
Participants
The study included participants with relapsing remitting (RR) or secondary progressive (SP) MS with brain MRI fulfilling McDonald 2010 criteria; age 18–55 years; Expanded Disability Status Scale (EDSS) 3.0–6.5; documented relapse, worsening disability, or new MRI lesions within two years prior to enrollment; evidence of involvement of the anterior visual pathway. The participants were allowed to continue injectable disease-modifying treatments (glatiramer acetate and beta-interferon) only.
Clinical outcome measures
Clinical outcome measures, including relapses, EDSS, multiple sclerosis functional composite (MSFC) and vision (high- and low-contrast letter acuity) were obtained at all visits. For these analyses, we used components of the MSFC instead of EDSS due to its continuous numerical scale and its sensitivity in detecting changes. 16 Timed 25 foot walk (T25FW), averaged reciprocals of right- and left-hand performance on 9-hole peg test (9HPT) and paced auditory serial addition test (PASAT) were chosen for correlation analysis.
MRI imaging protocol
Brain MRI was performed at months –2 (screening), –1, 0 (baseline, MRI performed before MSC infusion), 1, 2, 3 and 6 on a 3 Tesla Trio (Siemens, Erlangen, Germany). MRI sequences included DTI (2 mm isotropic voxels, 60 axial slices with 256 mm × 256 mm field of view, TE = 86 ms, TR = 7500 ms, 30 diffusion-weighting gradients with b = 1000 s/mm2 and 1 b = 0, 2 averages), SPACE 3D FLAIR (1 mm × 1 mm × 1.4 mm, TE = 404 ms, TR = 6500 ms, T = 2000 ms, flip angle = variable), T1 3D magnetization prepared rapid gradient echo (MPRAGE) (0.9 mm isotropic voxels, TE = 3.44 ms, TR = 1860 ms), and T1 gradient echo with and without contrast (0.7 mm ×0.7 mm × 3.0 mm slice thickness, TE = 2.46 ms, TR = 300 ms).
Image analysis
Given that motor deficits are one of the driving factors in disability in MS, we analysed DTI values in lesional areas and normal appearing white matter (NAWM) comprising the two major motor pathways in the brain: corticospinal tract (CST) and transcallosal motor tract (TCM). Probabilistic tractography was conducted with an automated software algorithm developed in-house to allow analysis of the NAWM tracts. 17 For TCM mapping, bilateral hand knobs were used as seed and target ROI. The hand knob ROIs were drawn on T1MPRAGE images and then co-registered into DTI space. For CST mapping, ROIs were drawn in the hand knob, ipsilateral internal capsule, and ipsilateral midbrain pyramidal tract using T1 MPRAGE images assisted by colorized FA maps. Overlapping areas on white matter tracts with lesional tissue were removed. DTI metrics were derived from NAWM tracts. Values from right and left CSTs were averaged.
For lesional analysis, T2 lesion masks were co-registered to DTI maps of FA, MD, RD and AD. Once in DTI space, a brain parenchyma map was overlaid and cerebrospinal fluid artifacts in non-parenchymal areas were eliminated after visual inspection. Finally, DTI measures were derived from the lesional maps. To simplify reporting, we focused on RD and AD values, the only statistically independent measures in DTI. Since any changes in FA and MD are due to changes in RD and/or AD, 18 they are included in tables and figures for reference only.
T2LV was obtained using previously validated semi-automated software developed in-house using FLAIR images. 19 Cth was measured using another validated software algorithm (cortical longitudinal atrophy detection algorithm (CLADA)), 20 which uses a combination of the maps generated for lesions, brain tissue and white matter. The algorithm used data from all time points to create a subject-specific deformable model of the inner and outer cortex from which Cth is calculated across different time points. An averaged Cth across all cortical regions was then obtained at each time point.
Statistical methods
Descriptive statistics for clinical measures (T25FW, 9PHT and PASAT), DTI, T2LV and Cth were calculated. Pearson’s correlation coefficients were calculated for DTI with Cth, T2LV and clinical measures. Linear mixed effect models were used to describe the evolution of MRI measures pre-(months –2, –1, 0) and post-transplantation (months 1, 2, 3, 6). The models included fixed effects for age, gender, time, disease type and random effect for participants. Estimated effects (mean changes in slopes) pre/post-transplantation were derived from the model. A separate linear mixed effects model was used to describe the evolution of MRI measures over the entire course of the study, including fixed effects for age, gender, time, disease type, transplantation status (pre or post), interaction between transplantation status and time, and random effect for participants. Results of these exploratory analyses were considered hypothesis-generating. Therefore, significance was set at p ≤ 0.05.
Results
Screening visit characteristics
Baseline clinical characteristics and conventional MRI metrics of the 24 participants are summarized in Table 1 (further details can be obtained from the main trial manuscript.) 13 Baseline Cth, T2LV and DTI metrics are also presented in Table 1. Imaging and clinical outcomes are presented in Table 2, grouped by disease type. At the screening visit, SPMS group exhibited greater impairment on T25FW (12.14 versus 5.98 s, p = 0.001) and 9HPT (0.03 versus 0.05, p = 0.002). There were no significant differences in MRI measures between SPMS and RRMS groups. There was a trend for higher RD and AD in lesions as compared to NAWM.
Baseline characteristics of subjects undergoing bone marrow aspiration and culture and MRI characteristics.
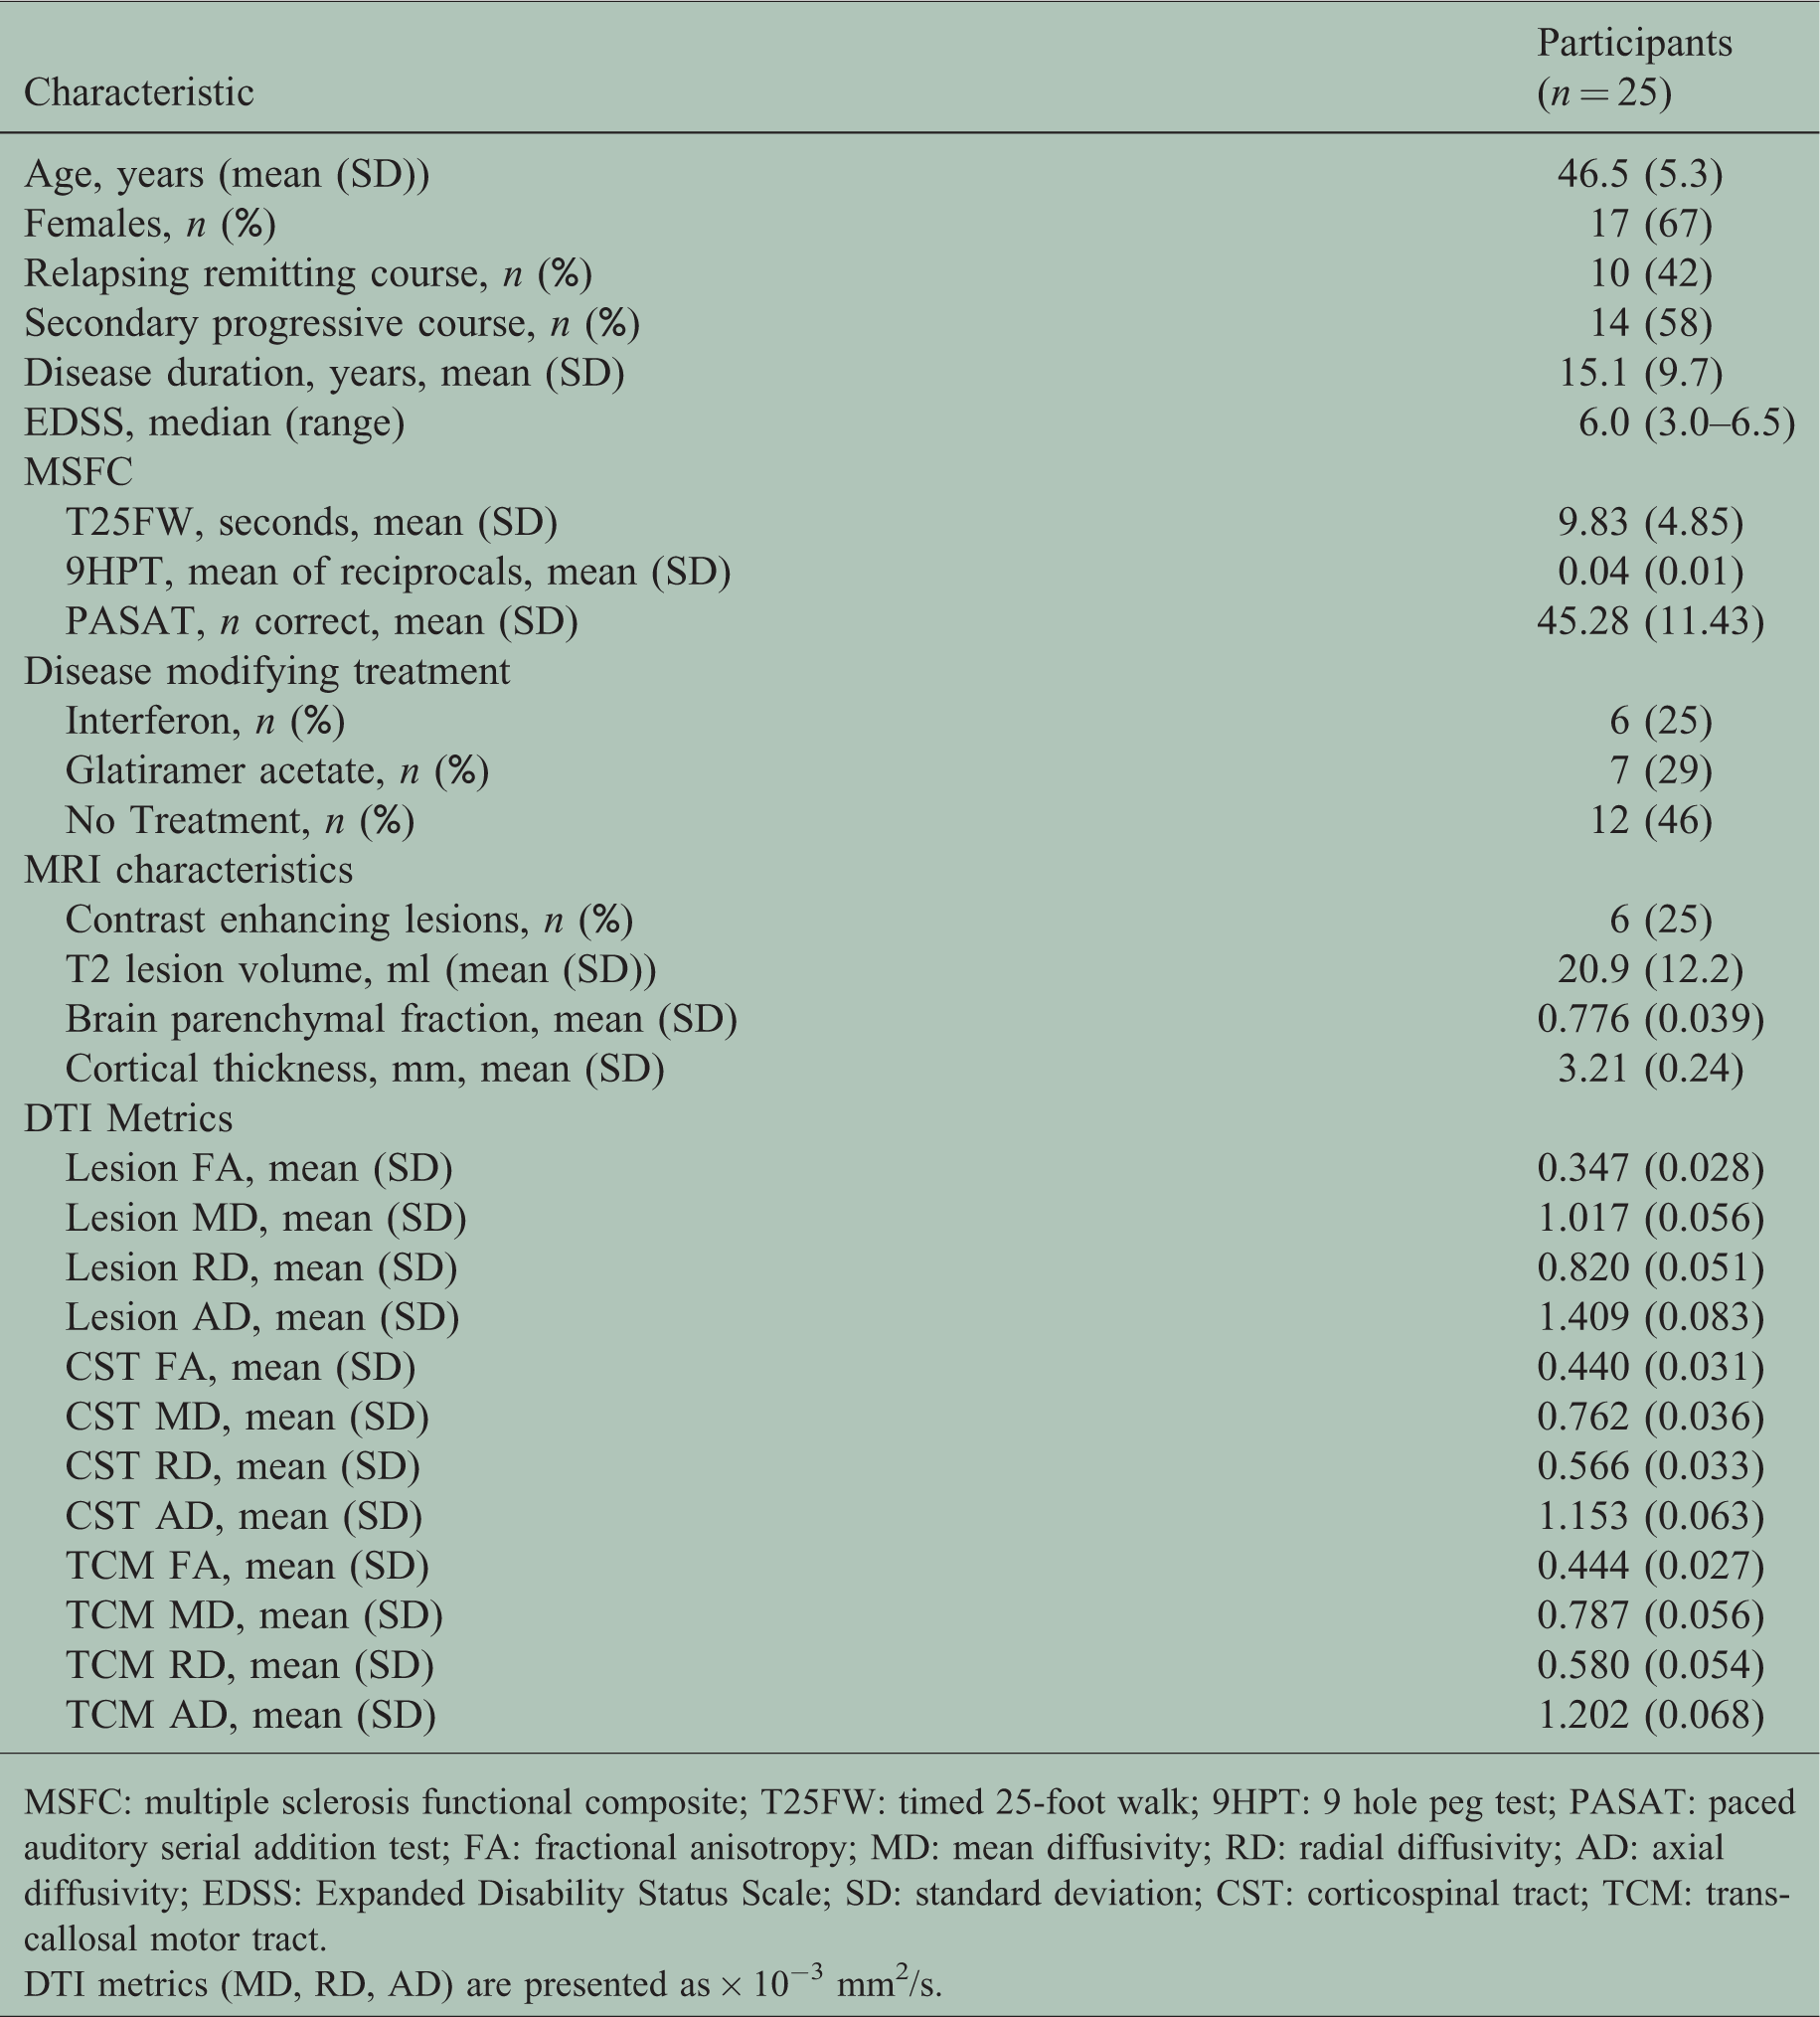
MSFC: multiple sclerosis functional composite; T25FW: timed 25-foot walk; 9HPT: 9 hole peg test; PASAT: paced auditory serial addition test; FA: fractional anisotropy; MD: mean diffusivity; RD: radial diffusivity; AD: axial diffusivity; EDSS: Expanded Disability Status Scale; SD: standard deviation; CST: corticospinal tract; TCM: transcallosal motor tract.
DTI metrics (MD, RD, AD) are presented as × 10−3 mm2/s.
Outcome characteristics at screening visit as categorized by disease type.

MSFC: multiple sclerosis functional composite; T25FW: timed 25-foot walk; 9HPT: 9 hole peg test; PASAT: paced auditory serial addition test; FA: fractional anisotropy; MD: mean diffusivity; RD: radial diffusivity; AD: axial diffusivity; EDSS: Expanded Disability Status Scale; SD: standard deviation; CST: corticospinal tract; TCM: transcallosal motor tract.
DTI metrics (MD, RD, AD) are presented as ×10−3 mm2/s.
MRI effects of MSC transplantation
The temporal evolutions of DTI metrics are presented in Figure 1(a) to (c) and Table 3. Accounting for the effects of age, sex and disease course, in lesional tissue pre-transplant, there was a significant progressive decrease in RD (−0.161 × 10⁻³ (mm2/s)/month, p < 0.001) and AD (−0.026 × 10⁻³ (mm2/s)/month, p = 0.001). Slopes of all the DTI metrics decreased post-transplant compared to pre-transplant to varying degrees. In the combined mixed model analysis, the interaction between transplantation and time was a significant predictor of lesional (0.014 × 10⁻³ (mm2/s)/month post-transplantation, p = 0.004) and AD (0.028 × 10⁻³ (mm2/s)/month post-transplantation, p < 0.001) (see Supplementary Material Table 1).

(a) Lesional tissue DTI values evolution overtime. (b) Transcallosal motor tract normal-appearing white matter DTI values evolution overtime. (c) Corticospinal tract normal-appearing white matter DTI values evolution overtime. All graphed with 95% confidence interval. (DTI: diffusion tensor imaging; MSC: mesenchymal stem cells; TCM: transcallosal motor tract; CST: corticospinal tract; NAWM: normal-appearing white matter; FA: fractional anisotropy; MD: mean diffusivity; RD: radial diffusivity; AD: axial diffusivity)
Evolution of DTI metrics pre- and post-transplant, presented as estimated effect derived from linear mixed model analysis.

FA: fractional anisotropy; MD: mean diffusivity; RD: radial diffusivity; AD: axial diffusivity; Cth: cortical thickness; T2LV: T2 lesion volume.
Values in bold indicate statistical significance (p < 0.05).
DTI metrics (MD, RD, AD) are presented as × 10−3 mm2/s.
In CST pre-transplantation, there was a significant increase in RD (0.004 × 10⁻³ (mm2/s)/month, p = 0.017) and a trend for decreased AD (−0.003 × 10⁻³ (mm2/s)/month, p = 0.053). There were non-significant decreases in RD and AD slopes post-transplantation. In combined mixed model analysis, the interaction between transplantation and time was a significant predictor of CST RD (–0.005 × 10⁻³ (mm2/s)/month post-transplant, p = 0.008) but not AD (see Supplementary Material Table 2).
In TCM, there were no significant changes in DTI metrics pre- or post-transplant, although slopes for all DTI metrics decreased post-transplant. There were no significant predictors of TCM DTI in combined mixed model analysis (see Supplementary Material Table 3).
The temporal evolution of Cth is presented in Figure 2(a) and Table 3. There were no significant changes in Cth pre-transplantation (–0.001 mm/month, p = 0.88). Post-transplantation, there was significant decrease in Cth (–0.002 mm/month, p = 0.032). In combined mixed model analysis, only time was a significant predictor of Cth (–0.001 mm/month, p = 0.049), not transplantation status nor its interaction (see Supplementary Material Table 4).

(a) Cortical thickness evolution (Cth) overtime. (b) T2 lesion volume (T2LV) evolution overtime. All graphed with 95% confidence interval. (MSC: mesenchymal stem cells.)
Pearson’s correlation coefficients of DTI metrics with MRI outcomes and MSFC component scores.

FA: fractional anisotropy; MD: mean diffusivity; RD: radial diffusivity; AD: axial diffusivity; MSFC: multiple sclerosis functional composite.
Values in bold indicate statistical significance (p < 0.05).
The temporal evolution of T2LV is presented in Figure 2(b) and Table 3. There was a significant increase in T2LV pre-transplantation (0.291 ml/month, p = 0.021) and no significant change post-transplantation (–0.063 ml/month, p = 0.158). There was a change in slope direction pre- and post-transplantation. Combined mixed model analysis demonstrated that interaction between transplantation and time was a significant predictor of T2LV (–0.355 ml/month post-transplantation, p = 0.013) (see Supplementary Material Table 5).
Correlation analyses
Correlation analyses of pre-transplantation DTI metrics with Cth, T2LV and clinical measures are presented in Table 4. There were significant moderate inverse correlations between TCM RD and AD and Cth (r = –0.561 and –0.665, respectively, p < 0.001). There were significant strong positive correlations between TCM RD and AD and T2LV (r = 0.806 and 0.781, respectively, p < 0.001). CST RD did not significantly correlate with Cth but did correlate with T2LV (r = 0.594, p < 0.001). CST AD inversely correlated with Cth (r = −0.715, p < 0.001) and positively correlated with T2LV (r = 0.779, p < 0.001). The strengths of correlations of lesional RD and AD with Cth or T2LV were generally weaker than that of NAWM with Cth or T2LV. Lesional RD and AD positively correlated with T2LV (r = 0.372 and 0.369, respectively, p ≤ 0.002), and lesional AD inversely correlated with Cth (r = –0.277, p = 0.019).
Regarding clinical measures, TCM and CST RD positively correlated with T25FW (r = 0.396 and 0.316, respectively, p < 0.007) and negatively correlated with 9HPT (r = –0.502 and –0.452, respectively, p < 0.001). CST AD significantly correlated with T25FW (r = 0.314, p = 0.007) and both TCM and CST AD significantly correlated with 9HPT (r = –0.320 and –0.248, respectively, p ≤ 0.037). CST AD also significantly correlated with PASAT (r = –0.319, p = 0.006).
Discussion
We present an exploratory study evaluating the changes in imaging metrics in a cohort of MS patients who underwent MSC transplantation. Although this is a phase 1 study and there is no active comparison group, the results highlight some insightful observations regarding longitudinal changes in DTI and potential influences of MSC.
First, longitudinal changes in DTI metrics in MS are heterogeneous. Classically, RD reductions suggest reduced perpendicular diffusivity of water, possibly indicating improved myelin integrity. AD reductions suggest impaired parallel diffusivity of water, possibly indicating axonal damage along the tracts. Several studies have examined the temporal evolution of DTI metrics in MS. While some studies have shown that DTI metrics in NAWM remain relatively stable,21–23 a 2-year longitudinal study of DTI in MS found that RD increases at the rate of 0.1–0.2%/year across several white matter tracts, while the direction of change in AD differs among tracts. 8 The rates of change in DTI metrics in our study were also variable. Our reported RD increase in CST pre-transplant (0.7%/year) was higher than rates reported in other studies of NAWM, indicating more severe demyelination in our cohort of patients. The change in RD in CST returned to −0.01%/year post-transplantation, which echoed the findings in the studies that reported no significant longitudinal changes. Similarly, RD changes pre-transplant and post-transplant in the TCM tract were also consistent with studies that reported no significant longitudinal change. In terms of AD, the decrease pre-transplant and minimal increase post-transplant in both CST and TCM tracts were consistent with previously reported ranges of AD changes with regards to direction and magnitude. The differences in our study compared to previous studies may be due to differences in patient population, as our transplant cohort had a long disease duration, with a majority having SPMS, and were not receiving any disease-modifying treatments. In addition, RD and AD values in pre-lesional NAWM have been shown to increase months prior to new lesion development21,24 as well as T1 black hole formation. 25 It is possible that some of the changes measured during this study reflected impending lesion formation.
Second, lesional DTI changes were more pronounced than NAWM DTI changes. A consistent trend in our study is that both RD and AD decreased in lesions pre-transplantation and decelerated in rate of decrease post-transplantation. This was not observed in NAWM tracts. It may appear contradictory that reductions were seen in both AD and RD. However, the complex microstructural changes in lesions during and following enhancement are reflected in varying degrees of changes in DTI.26–28 Ongoing tissue destruction and repair processes can lead to mixed DTI values in both lesions and NAWM. The observation that greater changes in lesional tissue as compared to NAWM has been previously reported. 6 Given the greater proportion of tissue destruction in lesions, promotion of intrinsic repair mechanisms may be more sensitively uncovered in lesions as compared to NAWM. It has been proposed that increasing cellularity and vasogenic oedema during acute inflammation can confound DTI results – that extent of demyelination may be underestimated and extent of axonal damage may be overestimated. 29 Therefore, as inflammation resolves, there may be varied changes in RD and AD depending on extent of injury. Furthermore, in ROI-based DTI, crossing fibers can mask the results of individual parameters. 30 This may explain why DTI changes are less profound in TCM as compared to CST. Changes in MS lesions and NAWM as evaluated by DTI should be interpreted with caution. Without an active comparison group in this exploratory study, it is difficult to attribute changes solely to MSC transplantation, as DTI metrics can also be influenced by many factors such as demographics, disease characteristics and concomitant lesion activity.
Of note, lesional DTI metrics exhibited greatest fluctuation prior to transplantation, which likely contributed to the significance of pre- and post-transplantation regression analysis results. This variation pre-transplant may be due to residual pre-screening lesion activity, and the more modest changes post-transplantation may reflect regression to the mean. The changes in DTI parameters in lesional DTI post-transplantation may reflect resolution of edema and inflammation, as well as varying degree of repair mechanisms that can affect AD and RD values. 31 Total T2 LV, as shown in Figure 2(b), continued to increase after screening visit until month 1 post-transplant and then appeared to stabilize over the next 6 months post-transplant. This trend supports our hypothesis that some of the changes in DTI are likely influenced by pre-screening and pre-transplantation lesional activity, as altered DTI metrics following acute lesions can persist for up to 15 months. 25 Nevertheless, the rate of T2LV increase pre-transplantation was within expected ranges of previously reported longitudinal studies of MS patients. 32 The change in slope post-transplantation, although not significant, is suggestive, and requires further examination in controlled trials to lend insight into MSC’s proposed repair mechanisms.
Despite the variations observed both lesional and NAWM DTI metrics, tractography-based DTI have proven to be informative in clinical trials, as they provide more specific insights on microstructural changes not captured by conventional MRI and clinical measures. In our study, tractography-based DTI measures correlated with established clinical measures and conventional imaging outcomes. TCM was mapped using hand knob ROIs, its RD expectedly correlated well with 9HPT, a measure of upper extremity function. Interestingly, it also correlated with T25FW, a measure of leg function, although the strength was weaker. This may be due to neighbouring influences of fibre tracts responsible for leg function given the small diameter of the TCM tract. The CST measures, as expected, showed correlations with both the T25FW and 9HPT. CST AD also correlated with PASAT, a measure of cognitive function, demonstrating the complex network of interneurons in the brain across multiple functional domains. In addition to clinical measures, NAWM DTI changes also significantly correlated with changes in Cth and T2LV. Thinner cortices and higher lesion volumes corresponded with higher NAWM RD and AD values, suggestive of the influences of microscopic changes on macroscopic measures in MS brains.
In addition to longitudinal analysis DTI metrics, we have demonstrated that Cth, which is a measure of grey matter integrity, decreased at a slightly higher rate following MSC transplantation compared to pre-transplantation rates. Considering the previously published results of brain parenchymal fraction and white matter fraction, 13 it appears that effects on Cth occurred independently of these measures, suggesting a specific effect of MSC in grey matter. The effects may also be due regression to the mean – as decrease in Cth may be due to delayed effects of increased T2 lesion burden observed pre-transplant through Wallerian degeneration. The overall rate of Cth decline over the 8-month period in this study was consistent with previously published natural history of grey matter atrophy rate in MS. 33 Furthermore, the clinical significance of the magnitude of change reported in our study remains unknown.
The current study has several limitations. First, the phase 1 study was designed as a safety and feasibility trial; the small sample size, short follow-up and lack of a comparison group reduced the ability to detect changes due to MSC transplantation. Second, DTI remains an approximation of the complex neuropathology that occurs in MS. The accuracy of DTI depends on its ability to detect orientation of water molecules in intact axons. Although DTI is very sensitive to change across single voxels, in tractography-based analysis, there is a tradeoff for clinical relevance to sensitivity. DTI can be confounded by noise and variability in diffusion pattern in axonal fibers within each voxel. There is also significant intra-subject and inter-subject variability. Larger studies with longer longitudinal follow-up time and control groups powered to detect significant changes are needed to assess the effects MSC transplantation.
Currently there are no published results on DTI changes in MSC transplantation and few tractography-based DTI analysis. There are, however, several ongoing phase 2 and 3 clinical trials that use DTI as one of the imaging outcome measures, including the FUMAPMS trial that evaluates dimethyl fumarate versus placebo in PPMS, 34 SPRINT-MS trial that evaluated Ibudilast versus placebo in both PPMS and SPMS, 35 ACTiMuS which evaluates early versus late autologous bone marrow cellular therapy in PPMS and SPMS, 36 and FLUOX-PMS which evaluates fluoxetine versus placebo in PPMS and SPMS. 37 Despite our current study limitations, the observations in this exploratory study provide baseline data for hypothesis-generation in future trials.
Conclusion
We have demonstrated dynamic longitudinal changes in structural MRI measures in a phase 1 study of MSC transplantation in patients with RRMS and SPMS using advanced MRI as well as changes in cortical thickness and T2 lesion volume. We observed a trend in increasing T2 lesion volume pre-transplantation and decreased T2 lesion volume post-transplantation, which may have partially driven the changes observed in lesional and NAWM DTI metrics. Results were more pronounced in lesional tissue as opposed to NAWM, which were consistent with previous DTI studies. The variability in DTI results reflects the complexity of measuring microstructural changes in the setting of ongoing tissue destruction and repair. Although the specific effects of MSC transplantation on these MRI measures were difficult to assess given the lack of a control group, this study provides groundwork for future randomized clinical trial studies to evaluate the effect of MSC transplantation using quantitative MRI techniques.
Supplemental Material
Supplemental material for Exploratory MRI measures after intravenous autologous culture-expanded mesenchymal stem cell transplantation in multiple sclerosis
Supplemental Material for Exploratory MRI measures after intravenous autologous culture-expanded mesenchymal stem cell transplantation in multiple sclerosis by Jenny Feng Mellen Center for Multiple Sclerosis Treatment and Research, Cleveland Clinic, USA Erik Offerman New York University School of Medicine, USA Jian Lin Imaging Institute, Cleveland Clinic, USA Elizabeth Fisher Biogen, Cambridge, MA Sarah M Planchon Mellen Center for Multiple Sclerosis Treatment and Research, Cleveland Clinic, USA Ken Sakaie, Mark Lowe Imaging Institute, Cleveland Clinic, USA Kunio Nakamura Biomedical Engineering, Cleveland Clinic, USA Jeffrey A Cohen and Daniel Ontaneda in Multiple Sclerosis Journal – Experimental, Translational and Clinical
Footnotes
Conflicts of Interests
The author(s) declared the following potential conflicts of interest with respect to research, authorship, and/or publication of this article: Jenny Feng received funding from National Multiple Sclerosis Society Sylvia Lawry Physician Fellowships Grant, and served on advisory board for Sanofi. Jian Lin received salary support from Novartis. Elizabeth Fisher is an employee of and holds stock in Biogen. Ken Sakaie received salary support from Genzyme and Novartis. Mark Lowe received consult fee from Siemens Medical Systems. Kunio Nakamura received personal fees including licensing royalties from Biogen, speaking from Sanofi Genzyme and consulting from NeuroRx Research. Sarah Planchon Pope received research funding from the Guthy-Jackson Charitable Foundation. Jeffrey Cohen received personal fees for consulting from Adamas, Celgene, Convelo, EMD Serono, Novartis, and PendoPharm; speaking for Mylan. Daniel Ontaneda received research support from NIH, PCORI, NMSS, R2E Foundation, Novartis, Genzyme, Genentech and Consulting fees from Biogen Idec, Genzyme and Roche/Genentech. Erik Offerman has no disclosures.
Funding
The author(s) received no financial support for the research, authorship, and/or publication of this article.
Supplemental Material
Supplemental material for this article is available online.
References
Supplementary Material
Please find the following supplemental material available below.
For Open Access articles published under a Creative Commons License, all supplemental material carries the same license as the article it is associated with.
For non-Open Access articles published, all supplemental material carries a non-exclusive license, and permission requests for re-use of supplemental material or any part of supplemental material shall be sent directly to the copyright owner as specified in the copyright notice associated with the article.