
Abstract
Background
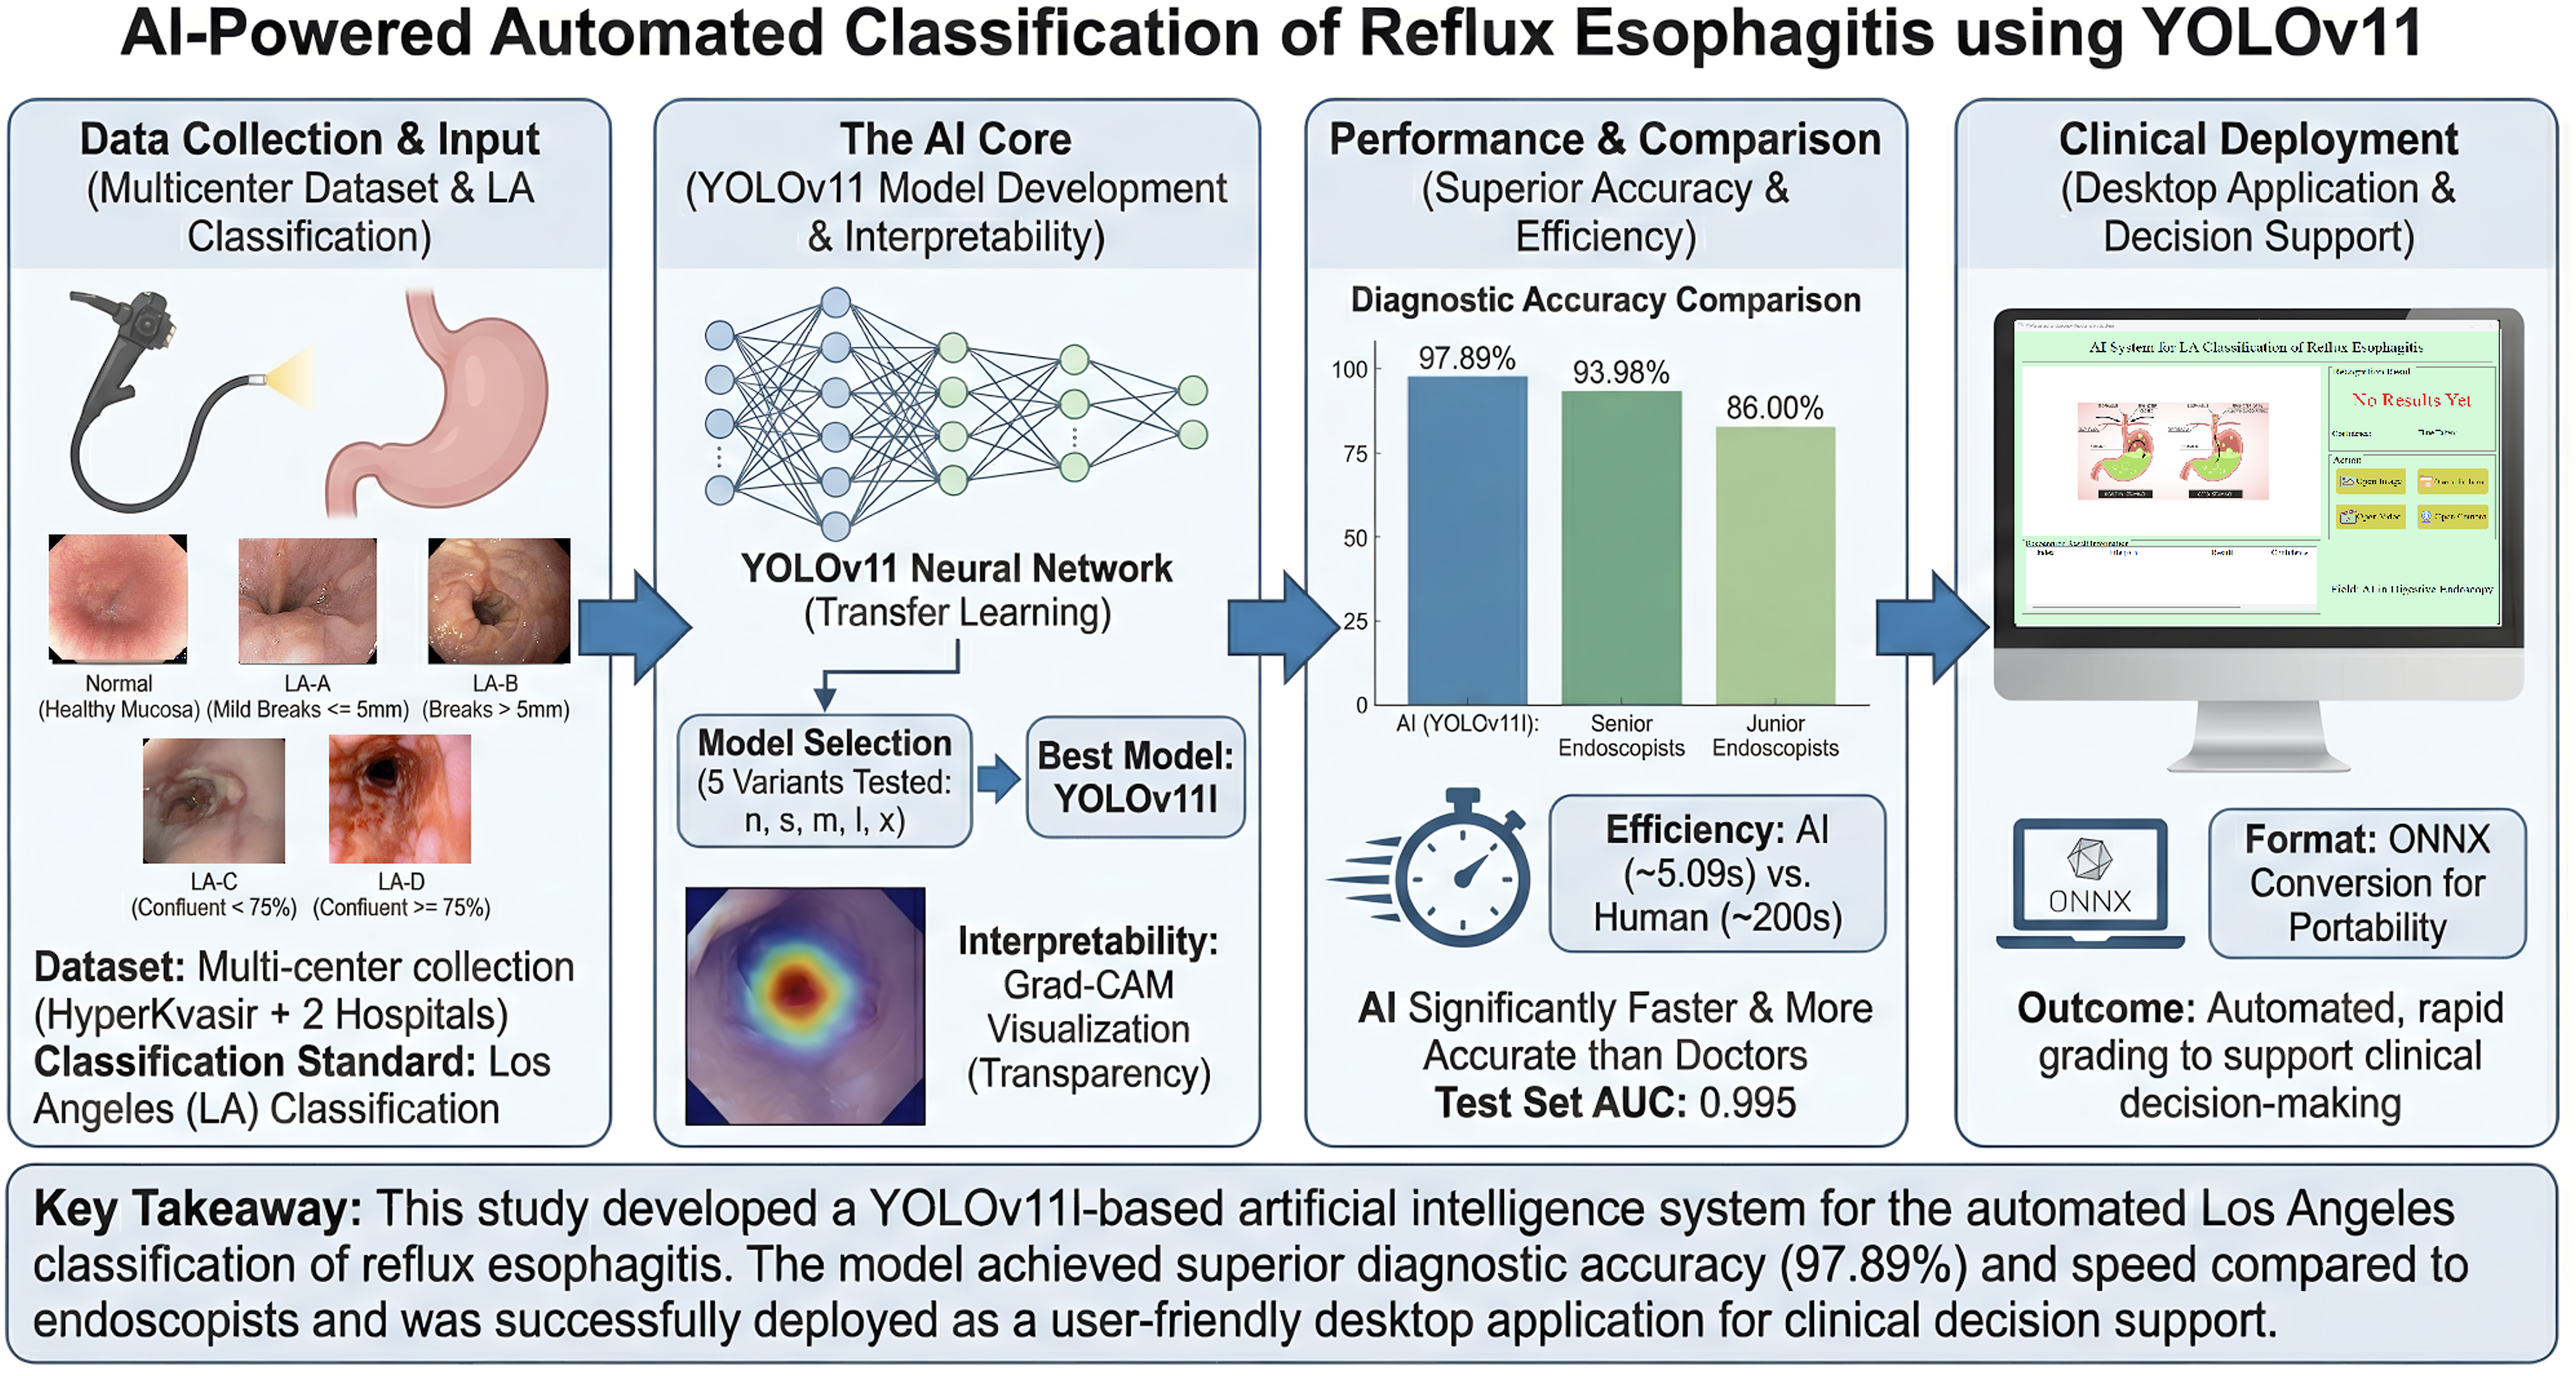
This study aims to develop an artificial intelligence system capable of automatically classifying endoscopic images of reflux esophagitis (RE) according to the Los Angeles (LA) classification, thereby improving the accuracy and efficiency of RE diagnosis and providing intelligent support for clinical decision-making.
Methods
RE images from three centers were collected to construct a dataset for training, validating, and testing a deep learning model. Model performance was evaluated using metrics such as accuracy, sensitivity, specificity, precision, area under the receiver operating characteristic curve (AUC), and F1 score. After model training, Grad-CAM (Gradient-weighted Class Activation Mapping) visualization techniques were applied to enhance model transparency. Finally, a clinical application was developed using PyQt5 technology for portable use.
Results
Among the five models evaluated, YOLOv11l demonstrated the best performance, achieving an accuracy, precision, sensitivity, and F1 score of 97.89%, 94.90%, 93.69%, and 94.28% on the validation set, respectively; and a weighted average accuracy, precision, specificity, and AUC of 96.26%, 91.58%, 98.04%, and 0.995 on the test set. The diagnostic accuracy of this model was significantly higher than that of both junior (χ2=45.93, P<0.05) and senior endoscopists (χ2=8.34, P<0.05).
Conclusions
The artificial intelligence model and application developed based on the YOLOv11 network can rapidly and accurately grade the severity of RE according to the LA classification on retrospective external test data, providing a promising proof-of-concept system that warrants further prospective and multi-reader validation before routine clinical deployment.
Keywords
1. Introduction
Gastroesophageal reflux disease (GERD) is a common chronic condition characterized by the backflow of gastric contents into the esophagus, leading to symptoms such as heartburn and acid regurgitation. 1 Based on endoscopic findings, GERD can be classified into three types: non-erosive reflux disease (NERD), reflux esophagitis (RE), and Barrett’s esophagus (BE). Among these, RE may cause erosions and ulcers of the esophageal mucosa, and in severe cases, can lead to complications such as bleeding or strictures. The chronic inflammation caused by RE is also a major risk factor for esophageal adenocarcinoma. 2 RE not only severely impairs patients’ quality of life but also imposes a significant burden on healthcare systems.
According to Lyon Consensus 2.0 3 and the third edition of the Japanese guidelines, 4 the diagnosis of RE primarily relies on identifying esophageal mucosal injury and grading the severity of esophagitis. Endoscopy plays a central role in the diagnosis and management of reflux disease. The LA Classification is the most widely used and thoroughly validated endoscopic grading system, employed to describe the endoscopic appearance of the esophageal mucosa and to stratify the severity of the condition.
In recent years, artificial intelligence (AI) has been increasingly applied in the medical field. Gastrointestinal endoscopy, a clinical diagnostic method that relies heavily on image recognition, has traditionally depended on the visual assessment and clinical experience of endoscopists. Although the Los Angeles (LA) Classification is recommended by multiple guidelines as the standard for grading, the lack of standardized and unified training makes it difficult to ensure diagnostic accuracy and consistency among physicians. As a result, leveraging AI technology to improve the precision and consistency of endoscopic image interpretation has become a major focus of current clinical research. The YOLO (You Only Look Once) series of neural networks is a classic algorithm widely used in medical image recognition in recent years. Since the introduction of its first version (YOLOv1) in 2015, the algorithm has undergone multiple iterations and upgrades. Previous studies have successfully applied YOLO to areas such as colon polyp detection 5 and capsule endoscopy-based small bowel lesion identification 6 within the field of gastrointestinal endoscopy.
Several AI-based approaches have been proposed for the automatic LA classification of RE. Ge et al. 7 developed a CNN-based model that achieved an accuracy of 95.70%, but it was limited to three categories (normal, LA-A/B, and LA-C/D). Wang et al. 8 proposed the GERD-VGGNet model using a single-center dataset of 464 patients, which also adopted a three-category classification. Yen et al. 9 employed a two-stage strategy combining deep learning feature extraction with machine learning classification. Ge et al. 10 first attempted five-category LA classification using DenseNet-121, achieving an accuracy of 86.7%; however, that study relied on a single-center dataset with a relatively small sample size of 2,081 images. Despite these advances, several limitations remain: (1) most studies use three-category classification, failing to distinguish LA-A from LA-B, although the Lyon Consensus 2.0 considers LA-B definitive evidence for GERD while LA-A is only borderline; (2) two-stage frameworks increase workflow complexity and reduce inference efficiency; and (3) most models rely on single-center datasets, limiting generalizability.
To address these challenges, this study aims to develop an end-to-end AI-assisted diagnostic system based on the YOLOv11 neural network that can automatically and accurately classify reflux esophagitis into five categories (LA-A, LA-B, LA-C, LA-D, and Normal) according to the LA classification. Specifically, this study seeks to: (1) construct a multicenter dataset to enhance model generalizability; (2) train, validate, and test the model to achieve fine-grained five-category LA classification with high accuracy and speed; (3) evaluate the model’s performance through human-computer comparison experiments; and (4) develop a portable desktop application using PyQt5 technology to facilitate clinical deployment.
2. Methods
2.1. Study design and datasets
This was a multicenter, retrospective, diagnostic accuracy study designed to develop and validate a deep learning–based artificial intelligence system for the automatic five-category Los Angeles (LA) classification of reflux esophagitis from endoscopic still images. Between January 2022 and February 2025, this study collected and established a database comprising 276 767 gastroscopic images of the cardia region. These images were extracted using an in-house Python script from continuously recorded gastroscopy videos at a fixed rate of 5 frames per second (5 fps). According to the LA Classification, these images were categorized into five groups: LA-A, LA-B, LA-C, LA-D, and normal (Figure 1). Schematic diagram of the pathogenesis of RE and representative images of different LA Classification grades. (A) Schematic illustration of the pathogenesis of RE; (B–E) Typical endoscopic images of LA Classification grades A, B, C, and D, respectively.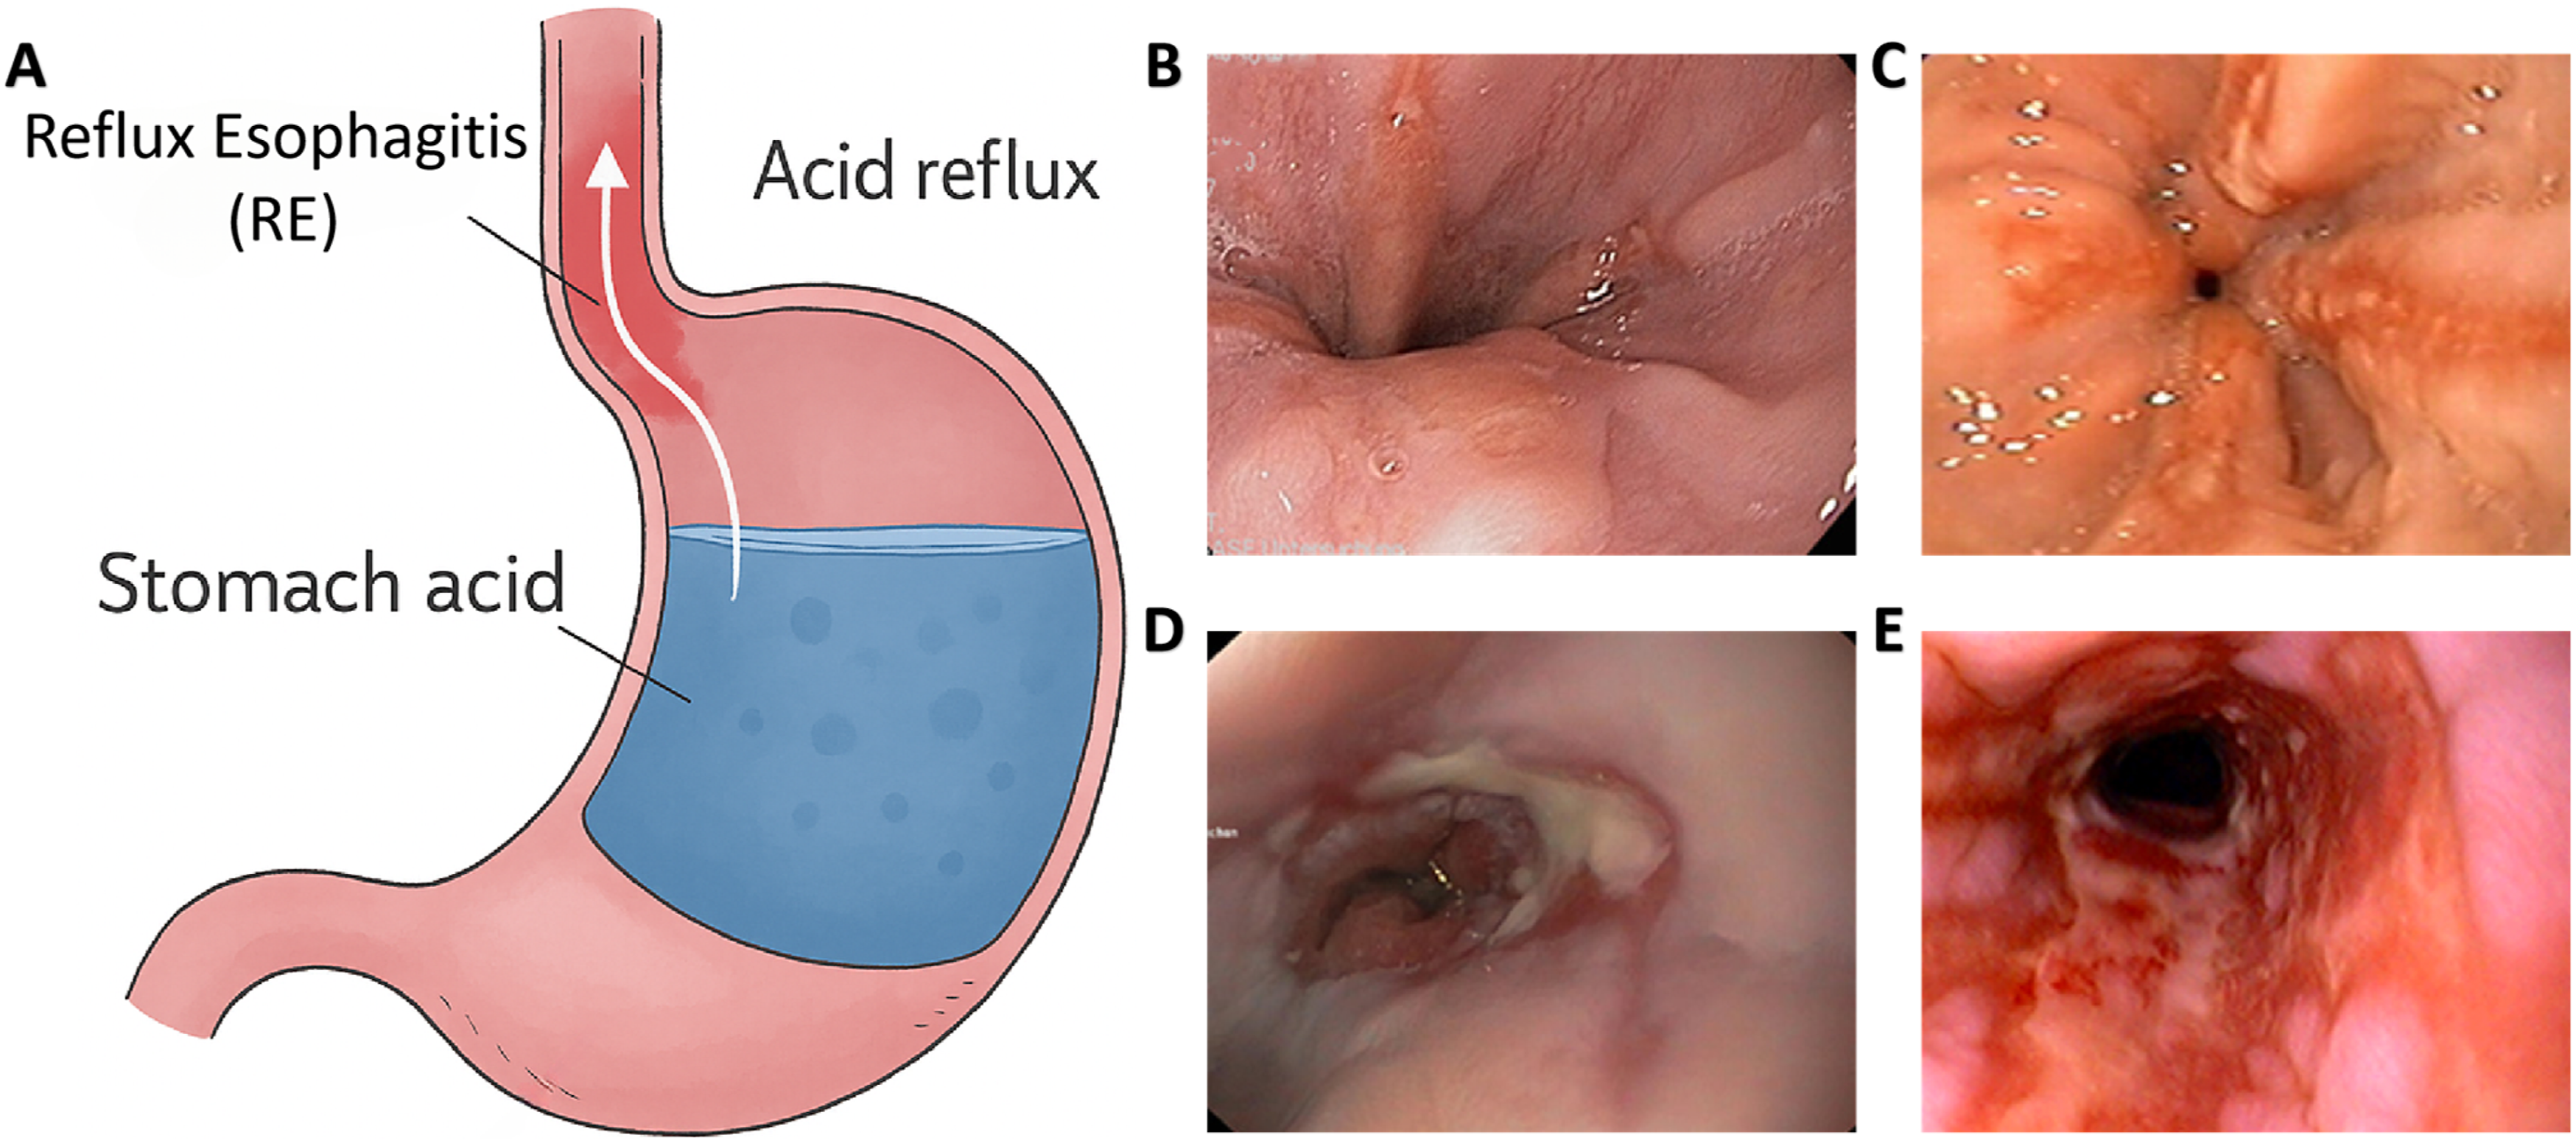
Inclusion criteria were as follows: (1) gastroscopic still images clearly depicting the gastroesophageal junction and the distal esophagus; (2) image resolution ≥ 640 × 480 pixels with sufficient quality to identify mucosal breaks; (3) clear and unambiguous LA grade documented by the original endoscopist or extractable from the public dataset annotation. Exclusion criteria were: (1) severe motion blur, defocus, or out-of-focus artifacts; (2) images obscured by mucus, food residue, blood, or biopsy forceps; (3) duplicate images from the same procedure or video segment with negligible viewpoint difference; (4) cases with discrepant LA grades that could not be reconciled by senior adjudicators; (5) post-operative images (e.g., post-ESD, post-fundoplication); (6) images from patients with concurrent Barrett’s esophagus, esophageal varices, or active upper gastrointestinal bleeding. The detailed screening process, stratified by center and by LA grade, is summarized in Figure 2. Image screening and dataset partitioning flowchart.
The data were sourced from three independent datasets. Dataset #1 was obtained from the publicly available HyperKvasir dataset (n=412 images), while Dataset #2 (n=3 418 images) and Dataset #3 (n=493 images) were collected by endoscopists from Changshu Hospital Affiliated to Nanjing University of Chinese Medicine and Changshu Hospital Affiliated to Soochow University, respectively, during routine clinical gastroscopy examinations. HyperKvasir is currently the world’s largest publicly available gastrointestinal endoscopy image database (https://datasets.simula.no/hyper-kvasir/), with data acquired from real gastrointestinal endoscopy procedures at Bærum Hospital in Norway. For this study, 412 gastroscopic images with clearly annotated LA grades were rigorously selected from the HyperKvasir dataset for analysis.
All data partitioning was performed at the patient level to prevent data leakage that could arise from images of the same patient — or temporally adjacent frames from the same procedure — appearing in multiple partitions. Dataset #1 (HyperKvasir, n=412 images) does not include publicly released patient-level identifiers; however, each image corresponds to a distinct endoscopic procedure as documented by the dataset providers, ensuring procedure-level independence. Dataset #2 included 3,418 images from 1,353 distinct patients at Changshu Hospital Affiliated to Nanjing University of Chinese Medicine, and Dataset #3 included 493 images from 157 distinct patients at Changshu Hospital Affiliated to Soochow University. For Datasets #2 and #3, a unique anonymized patient identifier was generated for each case, and random allocation was performed on the patient list rather than on individual images, with all images from a given patient assigned en bloc to a single partition. Dataset #1 and Dataset #2 were merged and randomly split in an 8:2 ratio into a training set (n=3,064 images) and a validation set (n=766 images) for model development. Dataset #3 was reserved as the independent external test set; this center did not contribute any images to the training or validation sets, providing an additional layer of independence. We verified that no patient identifier appeared in more than one partition.
2.2. Image annotation
In this study, the severity of RE was assessed using the LA Classification, which objectively grades the extent of mucosal injury observed during endoscopy, as it is currently the most widely used and thoroughly validated scoring system.11,12 The specific grading criteria are as follows: Grade A is defined as one or more mucosal breaks in the esophagus, each ≤5 mm in length; Grade B as one or more mucosal breaks >5 mm in length, with no confluent mucosal damage; Grade C as at least two mucosal breaks that are confluent, involving less than 75% of the esophageal circumference; and Grade D as confluent mucosal breaks involving 75% or more of the esophageal circumference.
The image annotation process was divided into four stages, with each stage managed by a different team of endoscopists. In Stage I, before annotation began, team members underwent multiple rounds of theoretical and practical training related to the LA Classification. In Stage II, endoscopists selected appropriate video segments and converted them into still images. In Stage III, two groups of endoscopists independently screened and classified the images. Discrepancies between the two groups were resolved through discussion to reach consensus. Cases that could not be resolved were escalated to Stage IV for final adjudication by senior endoscopists. The overall inter-annotator agreement rate was approximately 92%, and the Cohen’s Kappa coefficient was 0.89, indicating a high level of consistency. Figure 3 illustrates the detailed workflow of the image annotation process. Image annotation workflow.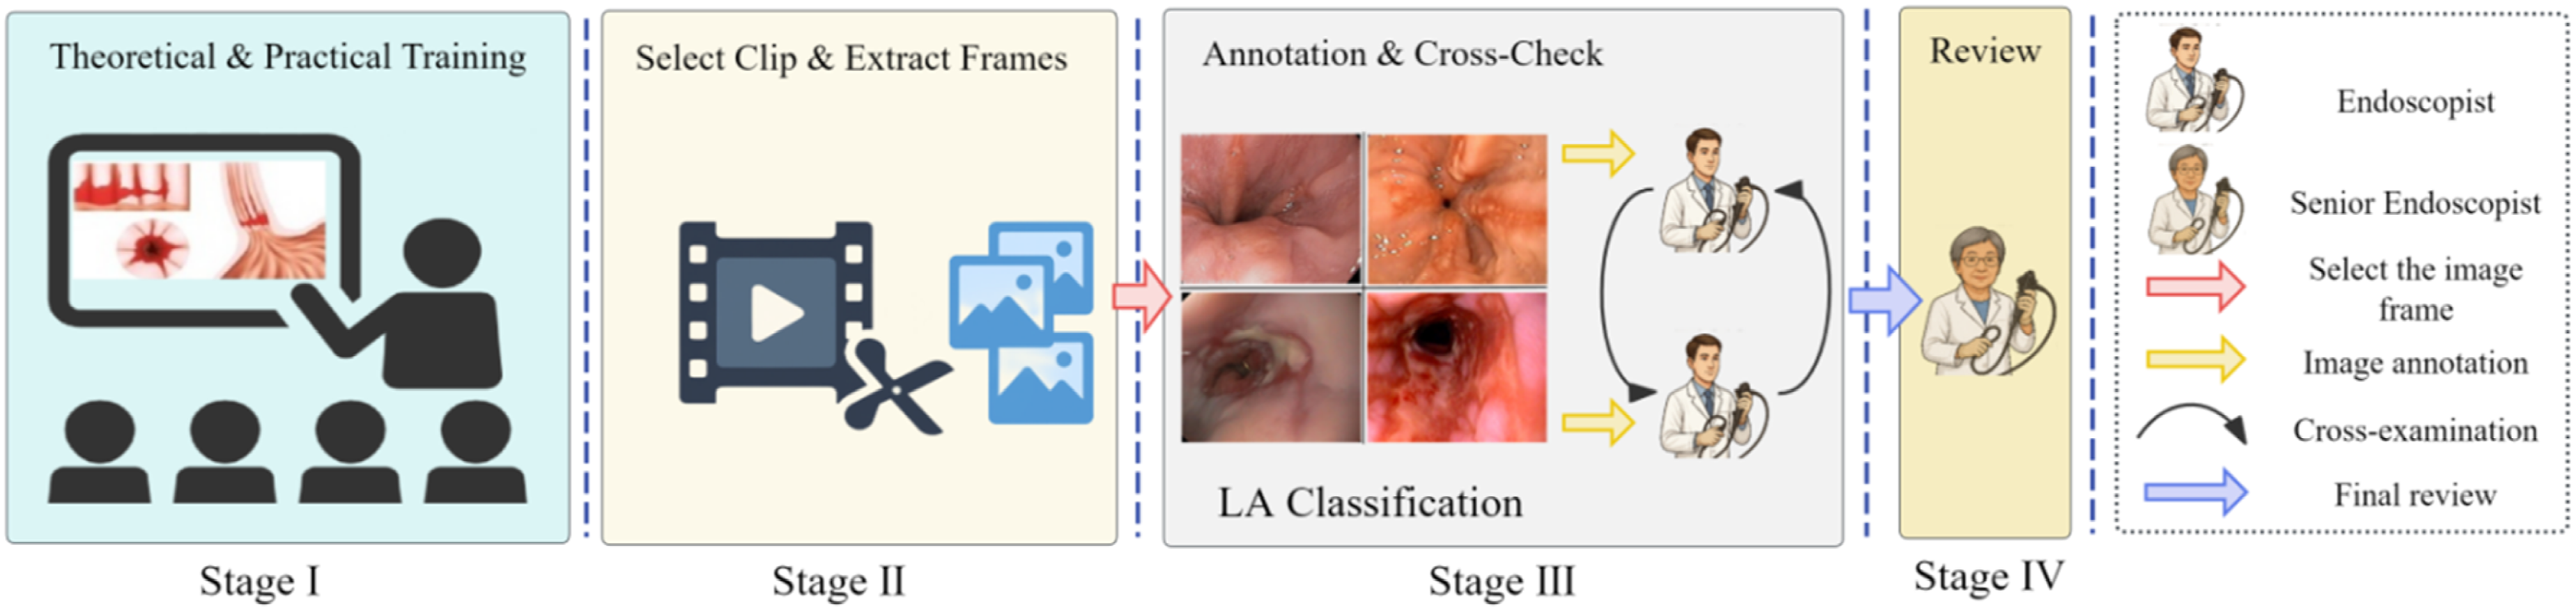
2.3. Deep learning network
2.3.1. Image preprocessing
First, normalization was applied to standardize pixel values to a unified scale, thereby reducing the impact of numerical fluctuations on model training. Random adjustments to image brightness, contrast, saturation, and hue were used to enhance the model’s adaptability to various lighting and color conditions. Additionally, random rotation and cropping techniques were incorporated during training to increase data diversity through random angles and regional cropping, helping the model better adapt to variations in perspective and position. To further improve performance in complex environments, random occlusion was employed to simulate scenarios where parts of key features are obscured, thus strengthening the model’s ability to recognize partially hidden targets. Dynamic adjustments of image background and contrast were also implemented to enhance the model’s recognition of different backgrounds and detailed features. During the input phase, images underwent resizing and multi-scale training, and were adjusted to 640 × 640 pixels while maintaining their aspect ratio to ensure compatibility with the YOLO network architecture and improve the model’s generalization across different resolutions. All augmentation and preprocessing operations were applied only to training images; validation and external test images were processed solely with resizing and normalization, ensuring that the reported performance reflects routine endoscopic appearance.
2.3.2. Model training configuration
YOLOv11 follows a modular architecture comprising three core components: (1) Backbone: The feature extraction network employs an improved CSP (Cross Stage Partial) structure incorporating C3k2 modules and SPPF (Spatial Pyramid Pooling - Fast), enabling efficient multi-scale feature extraction while reducing computational overhead; (2) Neck: A bidirectional feature fusion network combining FPN (Feature Pyramid Network) and PAN (Path Aggregation Network) is used to integrate features at multiple spatial scales, enhancing the model’s ability to capture both fine-grained and coarse-level information; (3) Head: For the classification task in this study, the detection head was replaced with a classification head that outputs a probability distribution over five categories (LA-A, LA-B, LA-C, LA-D, and Normal). The five model variants (nano, small, medium, large, and xlarge) differ in network depth and width, with parameter counts ranging from approximately 1.6M (nano) to 56.9M (xlarge), allowing flexible selection based on the trade-off between accuracy and computational efficiency.
To achieve automatic LA Classification of gastroscopic images of the cardia, this study adopted a transfer learning approach, utilizing five different versions of the YOLOv11 model
13
pre-trained on the COCO dataset: nano (n), small (s), medium (m), large (l), and xlarge (x). Automatic mixed precision was employed to improve computational efficiency, and a dynamic learning rate adjustment strategy was used to optimize training outcomes. The specific training parameters were set as follows: a maximum of 100 epochs, a batch size of 32, and fine-tuning based on the pretrained model weights. The hyperparameter configuration was determined through systematic experimentation. For the learning rate schedule, constant, step-decay, and cosine annealing strategies were compared; the cosine annealing schedule with an initial learning rate of 0.01 yielded the best convergence behavior and was adopted for all models. The batch size of 32 was selected after evaluating batch sizes of 16, 32, and 64, as it provided the optimal balance between GPU memory utilization and gradient estimation stability. An early stopping mechanism was introduced, with a patience value of 10 epochs, meaning that training would automatically terminate if there was no improvement in validation performance for 10 consecutive epochs. The systematic evaluation of five model scales (nano to xlarge) further served as a comprehensive search over the trade-off between model capacity and computational efficiency for this classification task. The models were run on GPU devices, with custom callback functions used to calculate and record metrics such as loss, accuracy, precision, recall, and F1 score on the validation set. The proposed automatic LA Classification system is illustrated in Figure 4. AI-based automated Los Angeles classification system.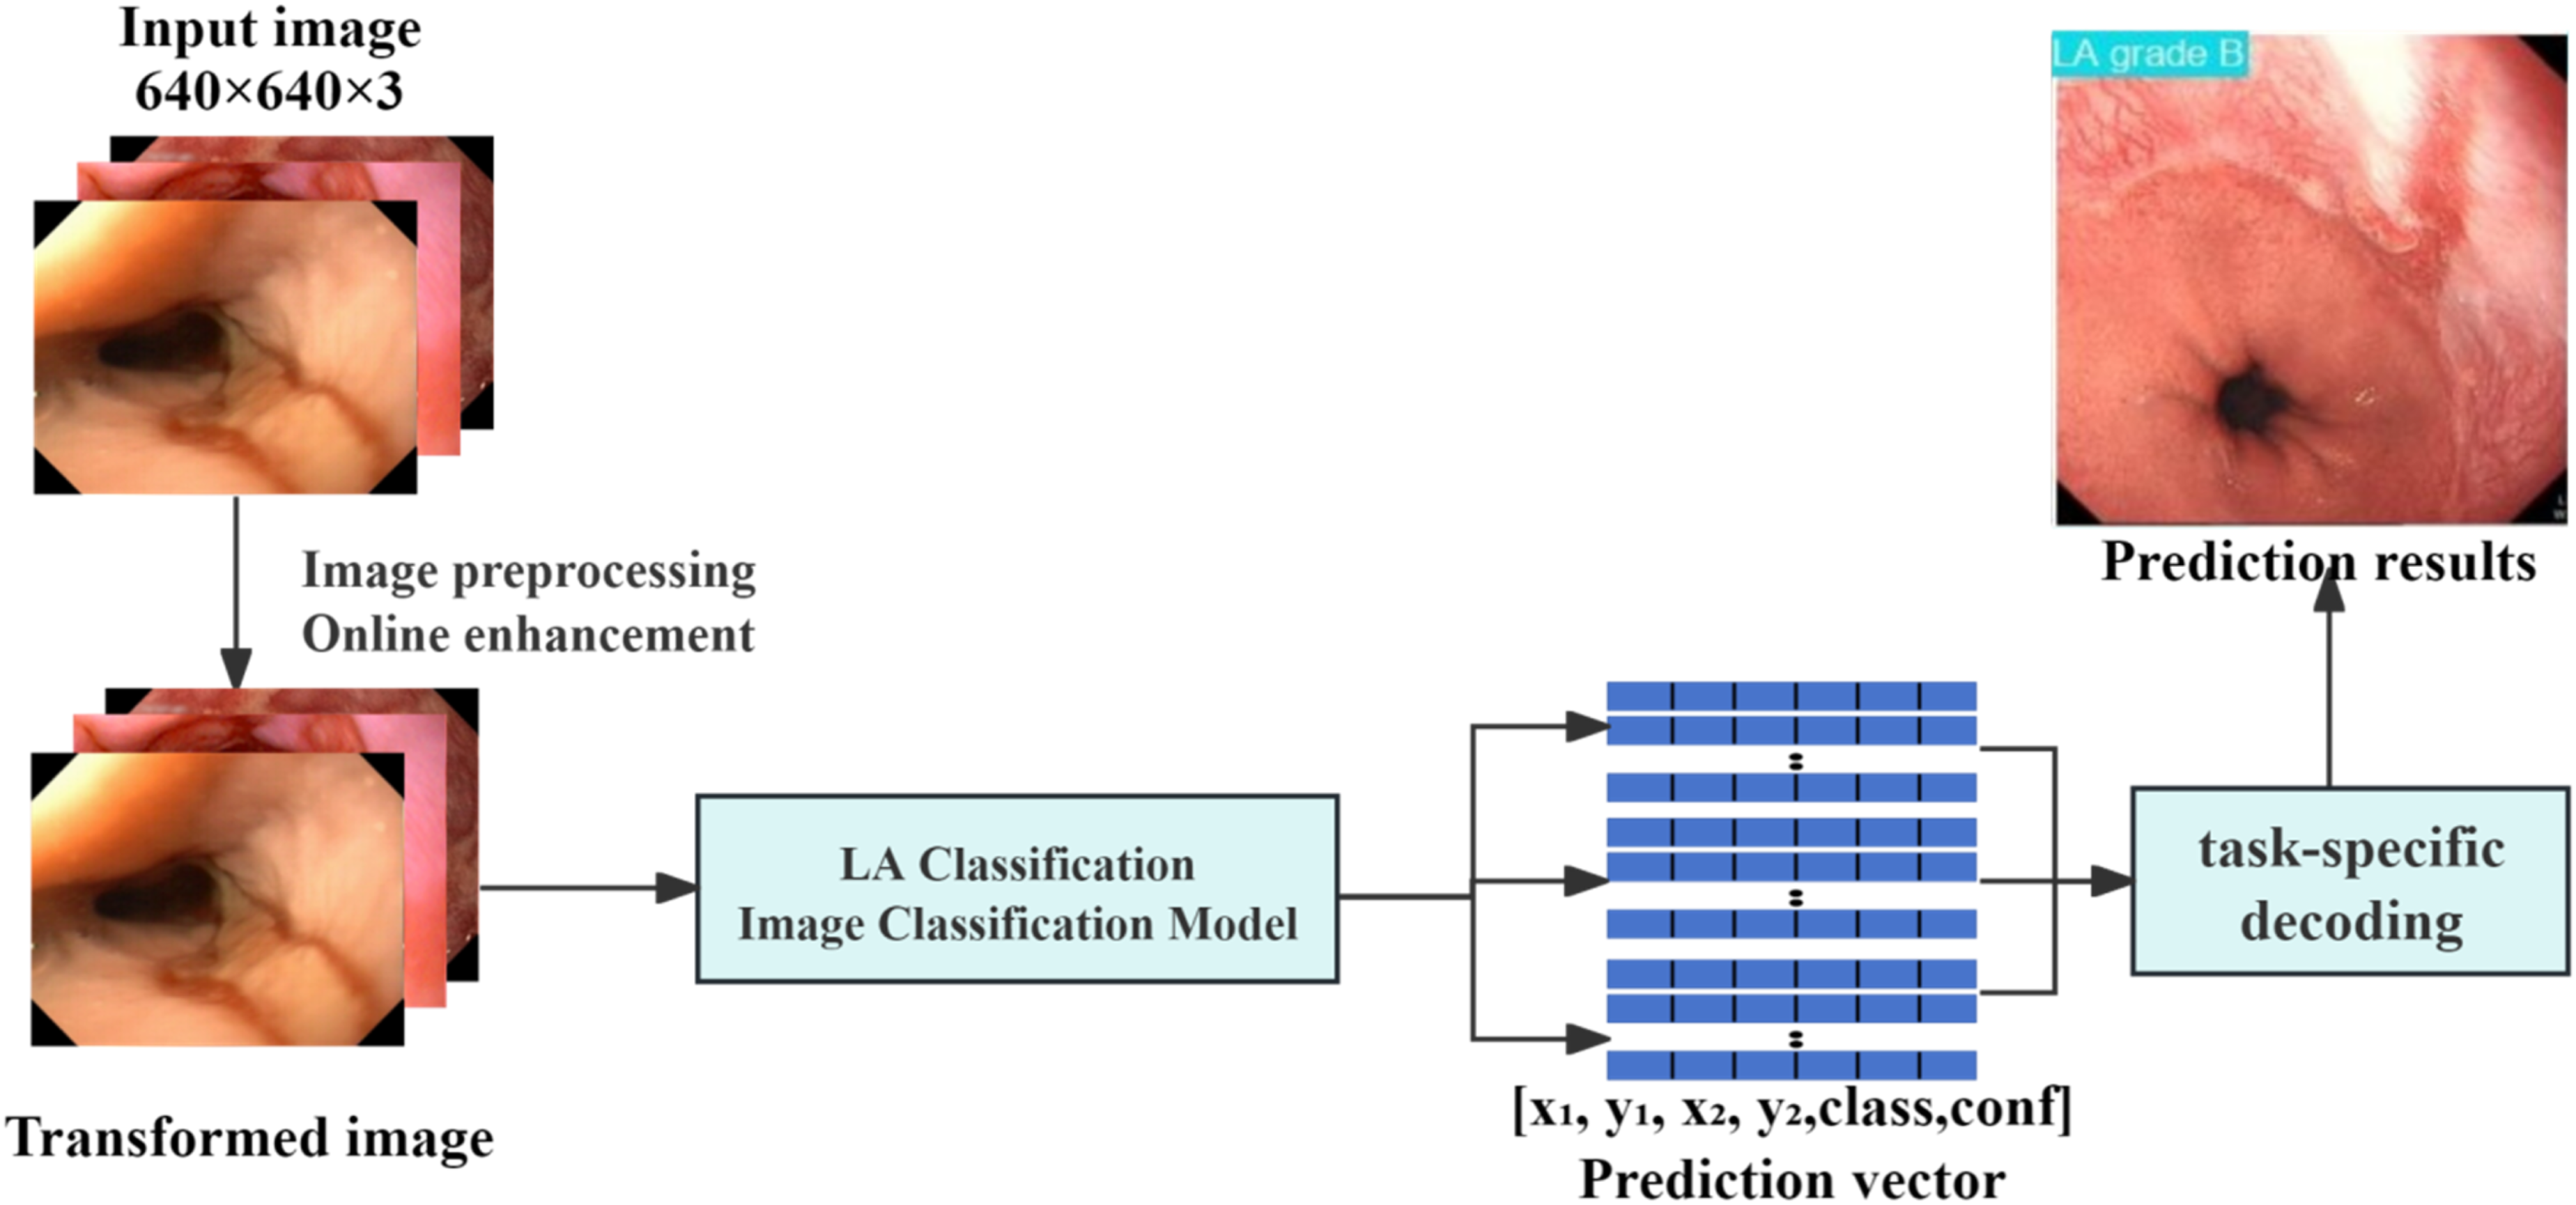
2.4. Model interpretability analysis
To enhance model interpretability, this study employed Gradient-weighted Class Activation Mapping (Grad-CAM) to visually highlight the key regions the model focuses on during classification tasks. 14 The best-performing trained model was loaded onto a CUDA-enabled GPU to accelerate inference. The penultimate convolutional layer was selected as the target layer to generate activation heatmaps for the corresponding classes. Images for analysis were preprocessed—including format conversion, resizing to 640 × 640 pixels, normalization, and conversion to tensors—before being input into the model. The predicted class was determined based on the output with the highest value, and a grayscale heatmap was generated accordingly. This heatmap was then mapped to pseudo-colors and superimposed on the original image to intuitively display the model’s areas of focus in relation to the image background. Finally, the original image, heatmap, and superimposed image were visualized using Matplotlib.
2.5. Application development
The best-performing YOLO model was developed into a locally deployable and user-friendly application using PyQt5 technology. PyQt5, developed by the Qt Company, integrates over 1,000 Qt components into Python modules, enabling efficient development of Qt applications in Python.
15
The specific steps were as follows: first, the optimal model was selected based on a comprehensive comparison of multiple performance metrics. Next, the model developed in the PyTorch framework was converted to the ONNX format. Finally, an application with a visual graphical user interface was created using PyQt5, allowing clinical staff to use the system easily without any programming knowledge. The detailed research workflow is illustrated in Figure 5. Research workflow diagram.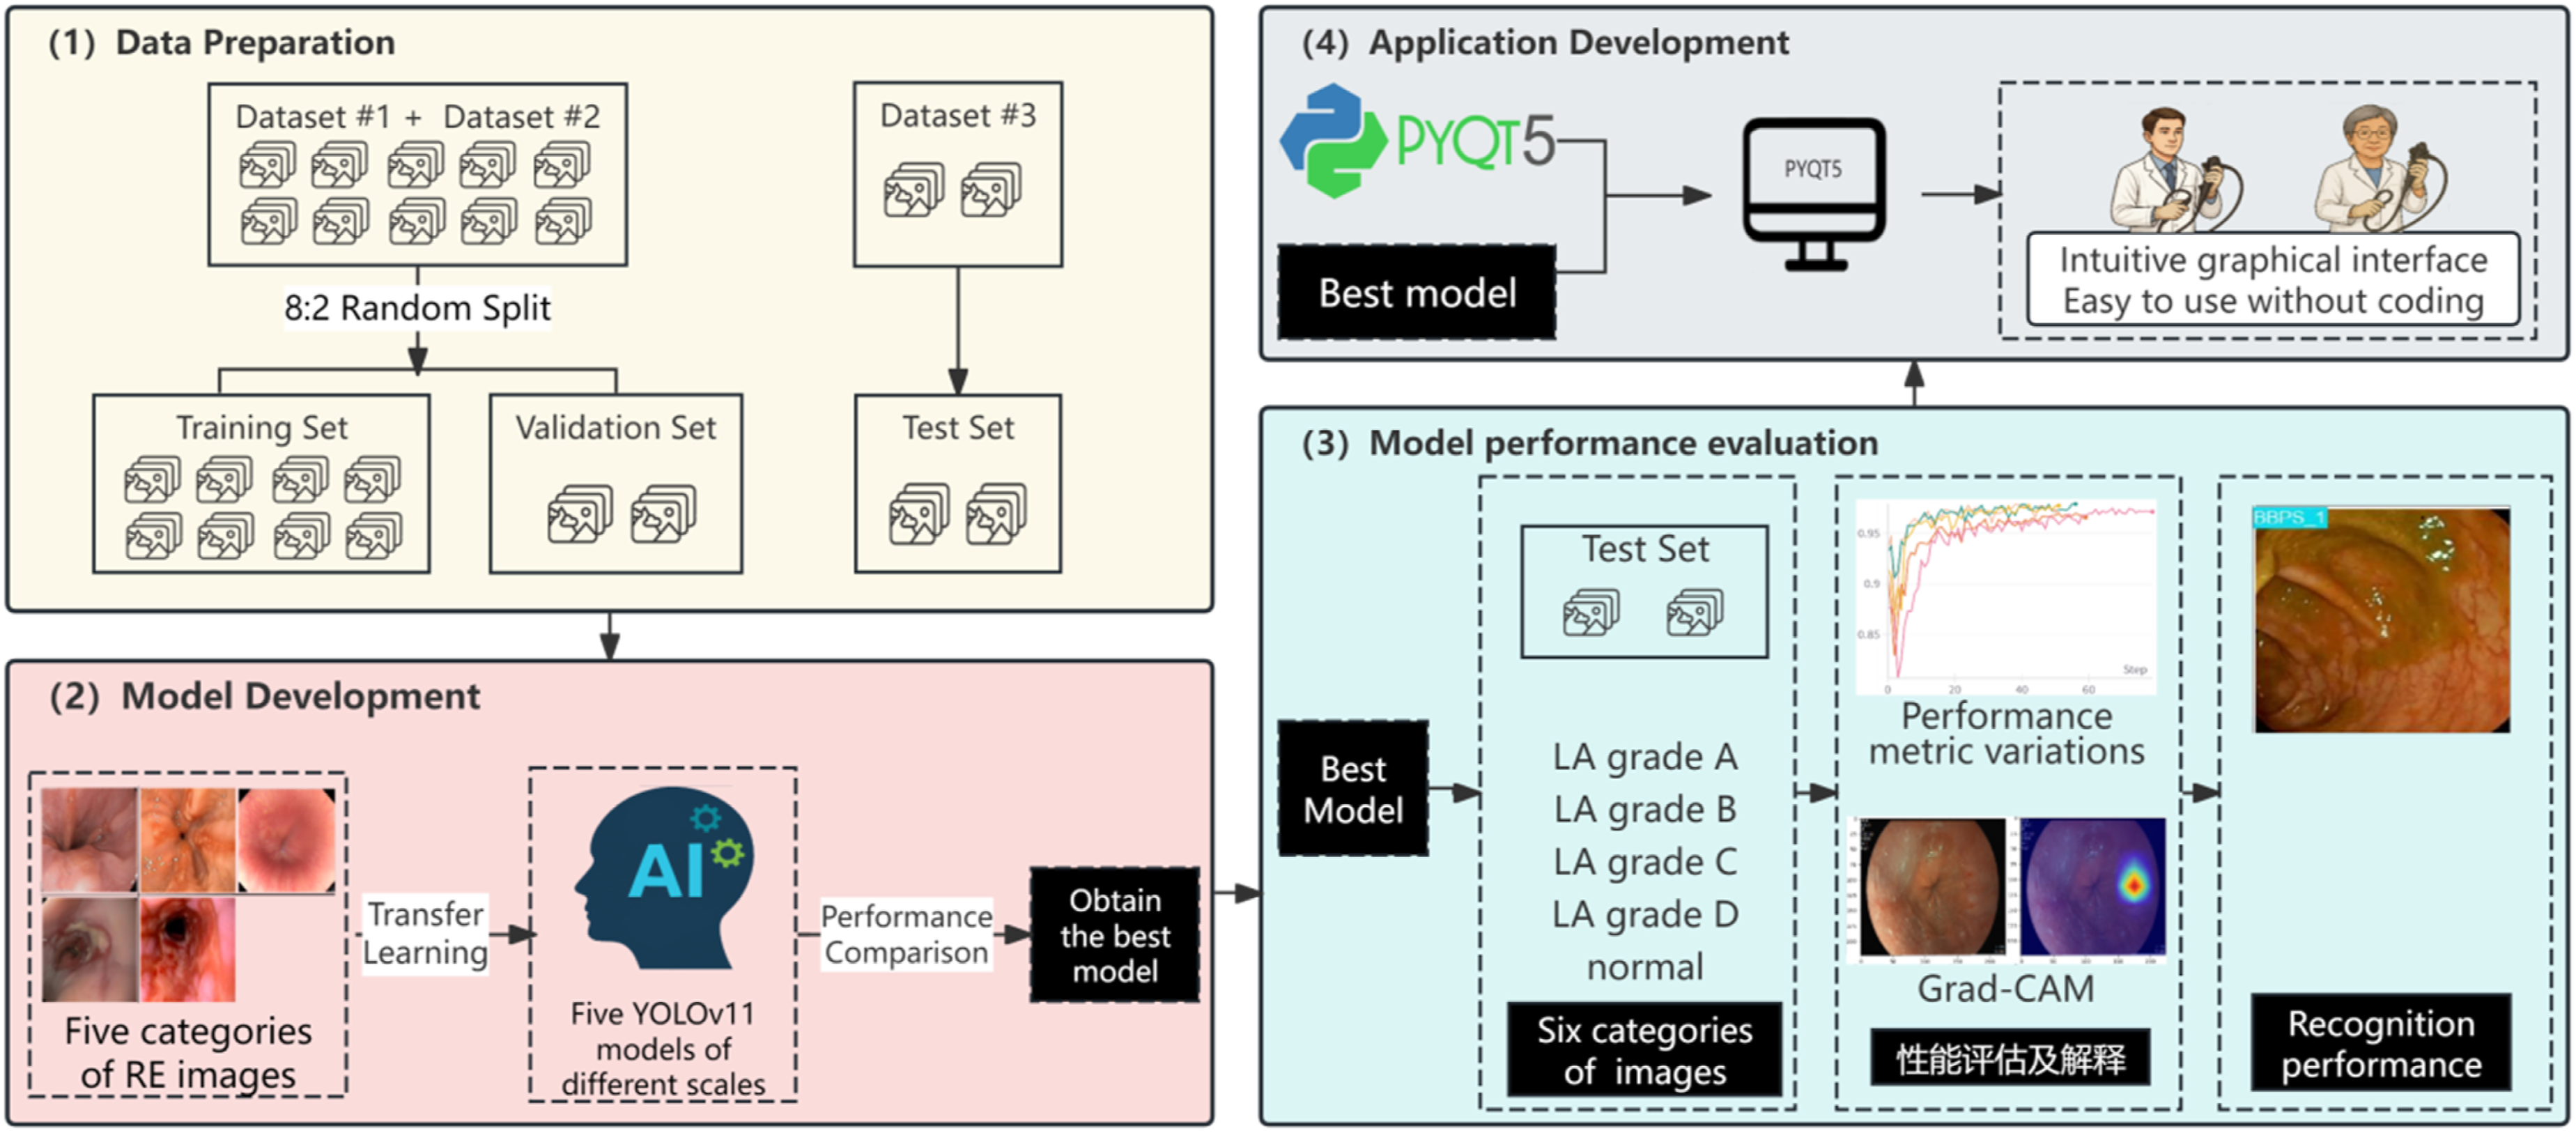
2.6. Experimental platform and statistical analysis
This study was conducted on a computer equipped with an NVIDIA GeForce RTX 4080 SUPER graphics card (16GB VRAM), an Intel Core i7-14700K processor (3.40 GHz, 8 cores and 16 threads), and 32GB of RAM. Model development and training were implemented using PyTorch, with OpenCV employed for image data preprocessing and augmentation. Data organization, analysis, and visualization were performed using tools such as Pandas, NumPy, Matplotlib, and Plotly, ensuring efficient and intuitive data handling. The Weights & Biases (wandb) tool was used for comprehensive tracking and recording of the model training process, including performance evaluation and result visualization. Multiple metrics were used to comprehensively assess the performance of the AI models, including sensitivity, precision, accuracy, F1 score, and AUC.
2.7. Human–AI comparison study design
A reader study was conducted on the same external test set of 493 images. Six endoscopists were recruited and stratified into a junior group (n=3; <5 years of independent gastroscopy experience and <2,000 procedures) and a senior group (n=3; ≥10 years of experience, ≥10,000 procedures, with documented familiarity with the LA classification). All readers viewed the same images presented to the AI model, in the same order, on identical diagnostic-grade monitors under standardized lighting, and assigned each image to one of the five LA categories. Readers were blinded to clinical context, the original endoscopy report, the model’s prediction, and other readers’ assessments, and were instructed not to discuss cases. Per-image reading time was automatically recorded. The average of the data from the three readers within each experience group was recorded.
3. Results
3.1. Baseline data
The dataset used in this study comprised a total of 4,323 endoscopic images classified into five categories of reflux esophagitis (including one normal category). The dataset was divided into a training set (n=3,064), a validation set (n=766), and a test set (n=493). In the training set, the number of images for each category was as follows: LA grade A, 780; LA grade B, 708; LA grade C, 456; LA grade D, 228; and normal, 892. In the validation set, the category distribution was: LA grade A, 195; LA grade B, 177; LA grade C, 114; LA grade D, 57; and normal, 223. The specific distribution is shown in Figure 6. Distribution of images across different categories.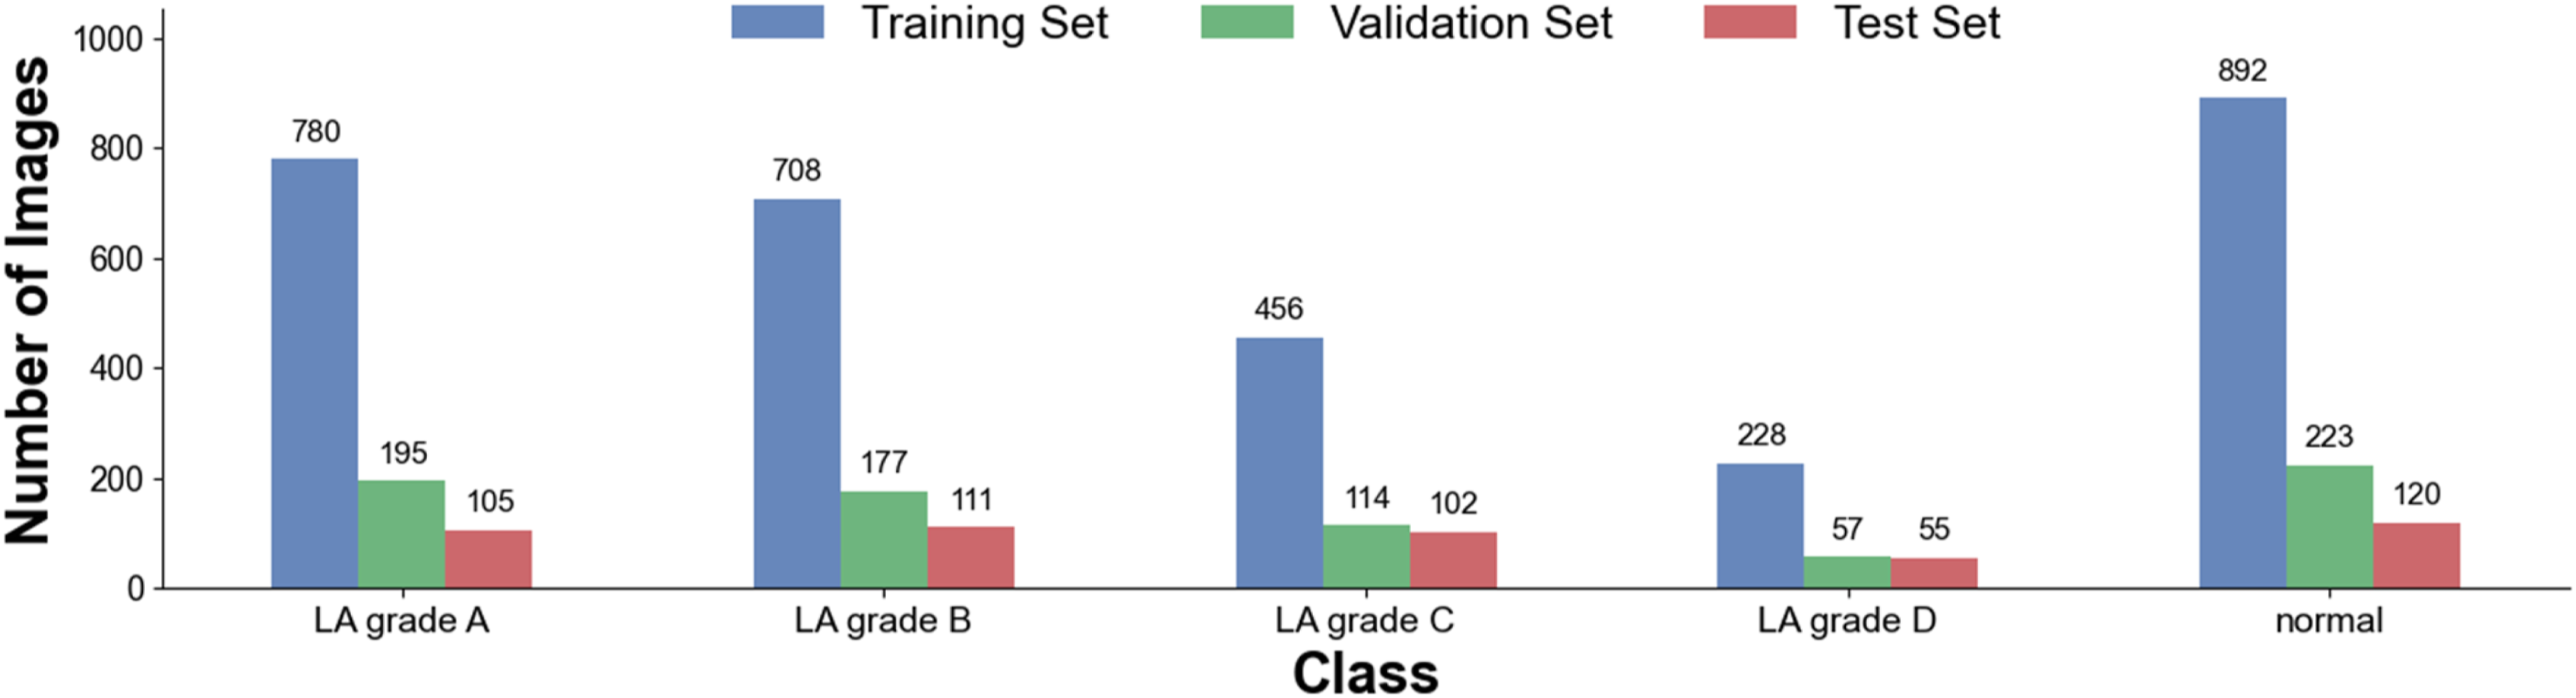
3.2. Model training
Based on the same dataset, five different versions of the YOLOv11 neural network model were trained in this study: YOLOv11n, YOLOv11s, YOLOv11m, YOLOv11l, and YOLOv11x. During the training process, the open-source platform wandb was used to monitor model training. For all five models, the loss function on both the training and validation sets initially fluctuated greatly but gradually decreased and stabilized as training progressed, indicating that the models gradually converged and optimized, with no signs of overfitting or underfitting (see Figure 7(a) and (b)). At the same time, the accuracy of all five models increased rapidly in the early stages of training and remained stable after reaching a high level (Figure 7(c)). Among them, YOLOv11l achieved the best overall performance, reaching the highest accuracy of 97.89%. Trends in loss and accuracy during training and validation for different YOLO models. (A) & (B): Trends in classification loss on the training and validation sets as the number of training steps increases; (C): Trend of accuracy as the number of training steps increases. Due to the use of early stopping during training, the number of training steps varied among different models.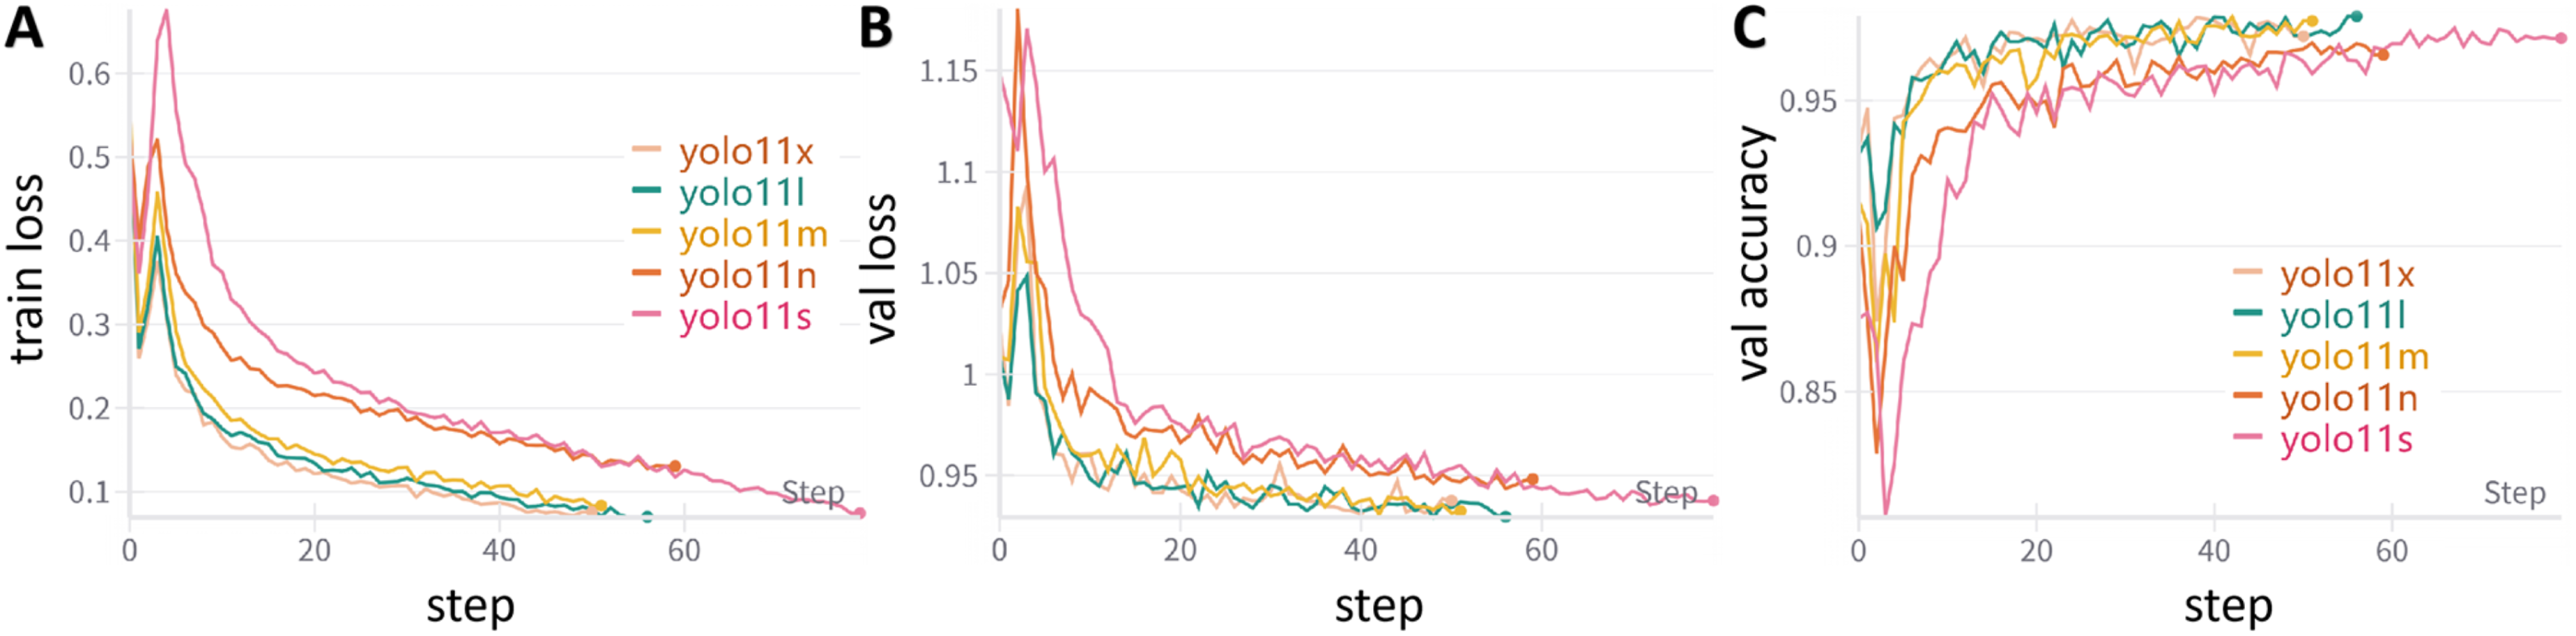
3.3. Comparison of diagnostic performance among different models
Performance comparison of different AI models on the validation set.

*Note. indicates the best performance for that metric among all models.
3.4. Performance evaluation of the best model on the test set
Performance evaluation of the YOLOv11l model on the test set.
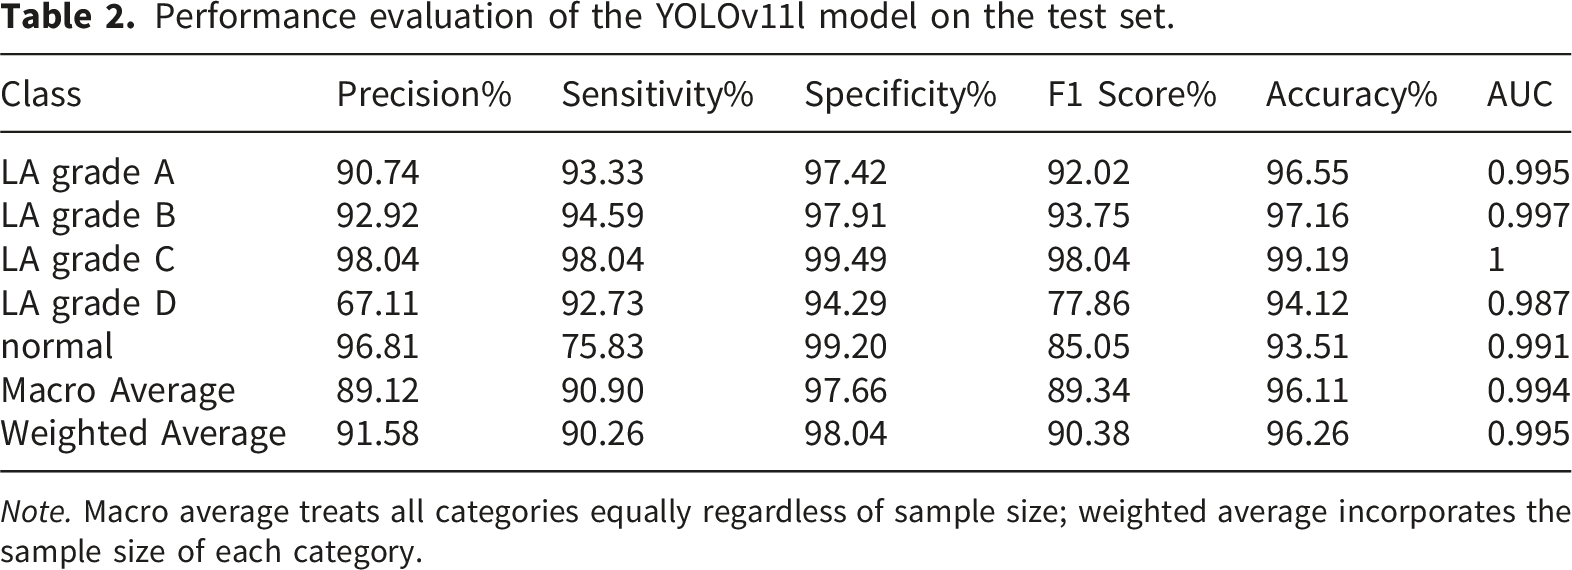
Note. Macro average treats all categories equally regardless of sample size; weighted average incorporates the sample size of each category.
Figure 8 presents two key evaluation curves for the YOLOv11l model on the test set: the precision-recall (PR) curve and the receiver operating characteristic (ROC) curve. In Figure 8(a), the PR curves for all categories except LA-D are close to the upper right corner, indicating superior predictive performance in these categories. In Figure 8(b), the ROC curves for all categories are nearly adjacent to the upper left corner, further demonstrating the model’s strong classification capability for most categories. Predictive performance of the AI model on the external test set. (a) Precision-Recall (PR) curve; (b) Receiver Operating Characteristic (ROC) curve.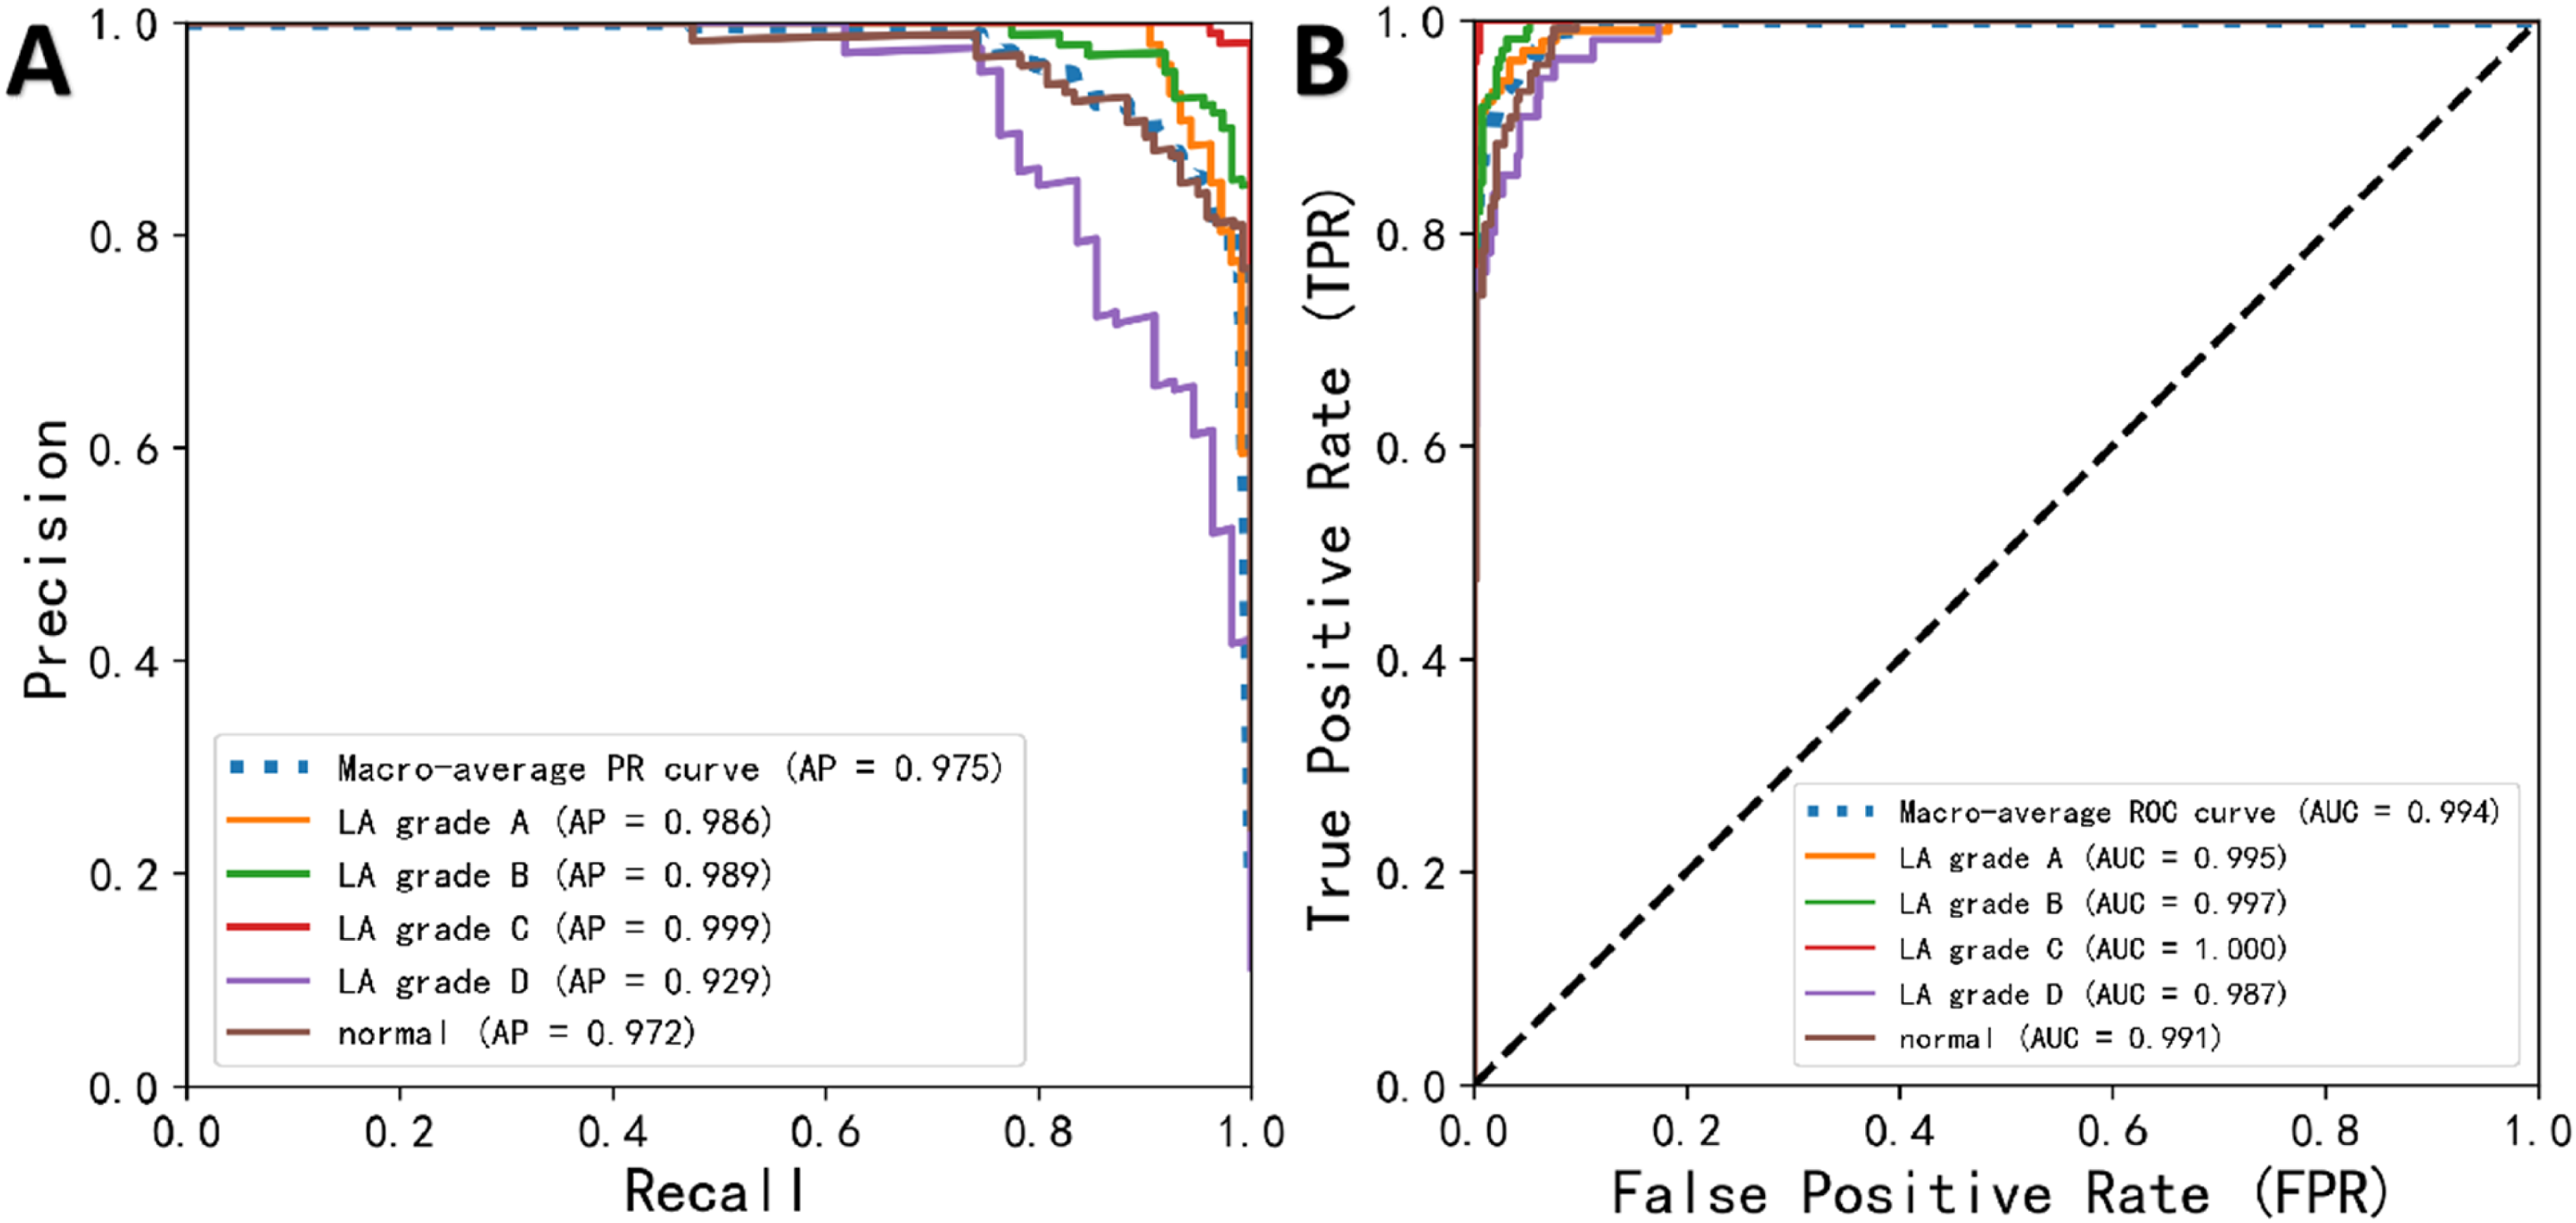
To further investigate the underlying error patterns, a confusion matrix and representative misclassified cases are presented in Figure 9. The confusion matrix (Figure 9(a)) revealed two notable error patterns. First, a bidirectional confusion between Normal and LA-D was observed: 15 of 120 truly normal images were over-called as LA-D, accounting for the majority of LA-D false positives (explaining the depressed LA-D precision of 67.11%) and simultaneously constituting a substantial source of Normal misclassification (contributing to the depressed Normal sensitivity of 75.83%). Second, a fraction of Normal images were also under-called as LA-A, reflecting the inherent difficulty of distinguishing truly normal mucosa from minimal sub-5-mm mucosal changes near the gastroesophageal junction. Figure 9(b) illustrates a representative LA-C case mis-predicted as LA-D, in which uneven illumination and the presence of luminal fluid in the field of view likely undermined the accurate assessment of the circumferential extent of mucosal involvement. Figure 9(c) illustrates a representative Normal case mis-predicted as LA-A, in which mild peri-junctional mucosal erythema and a blurred Z-line may have been misinterpreted as a sub-5-mm mucosal break. Confusion matrix and representative misclassified cases of YOLOv11l on the external test set. (a) Confusion matrix on the external test set (n = 493). (b) Representative case of LA grade C mis-predicted as LA grade D. (c) Representative case of Normal mis-predicted as LA grade A.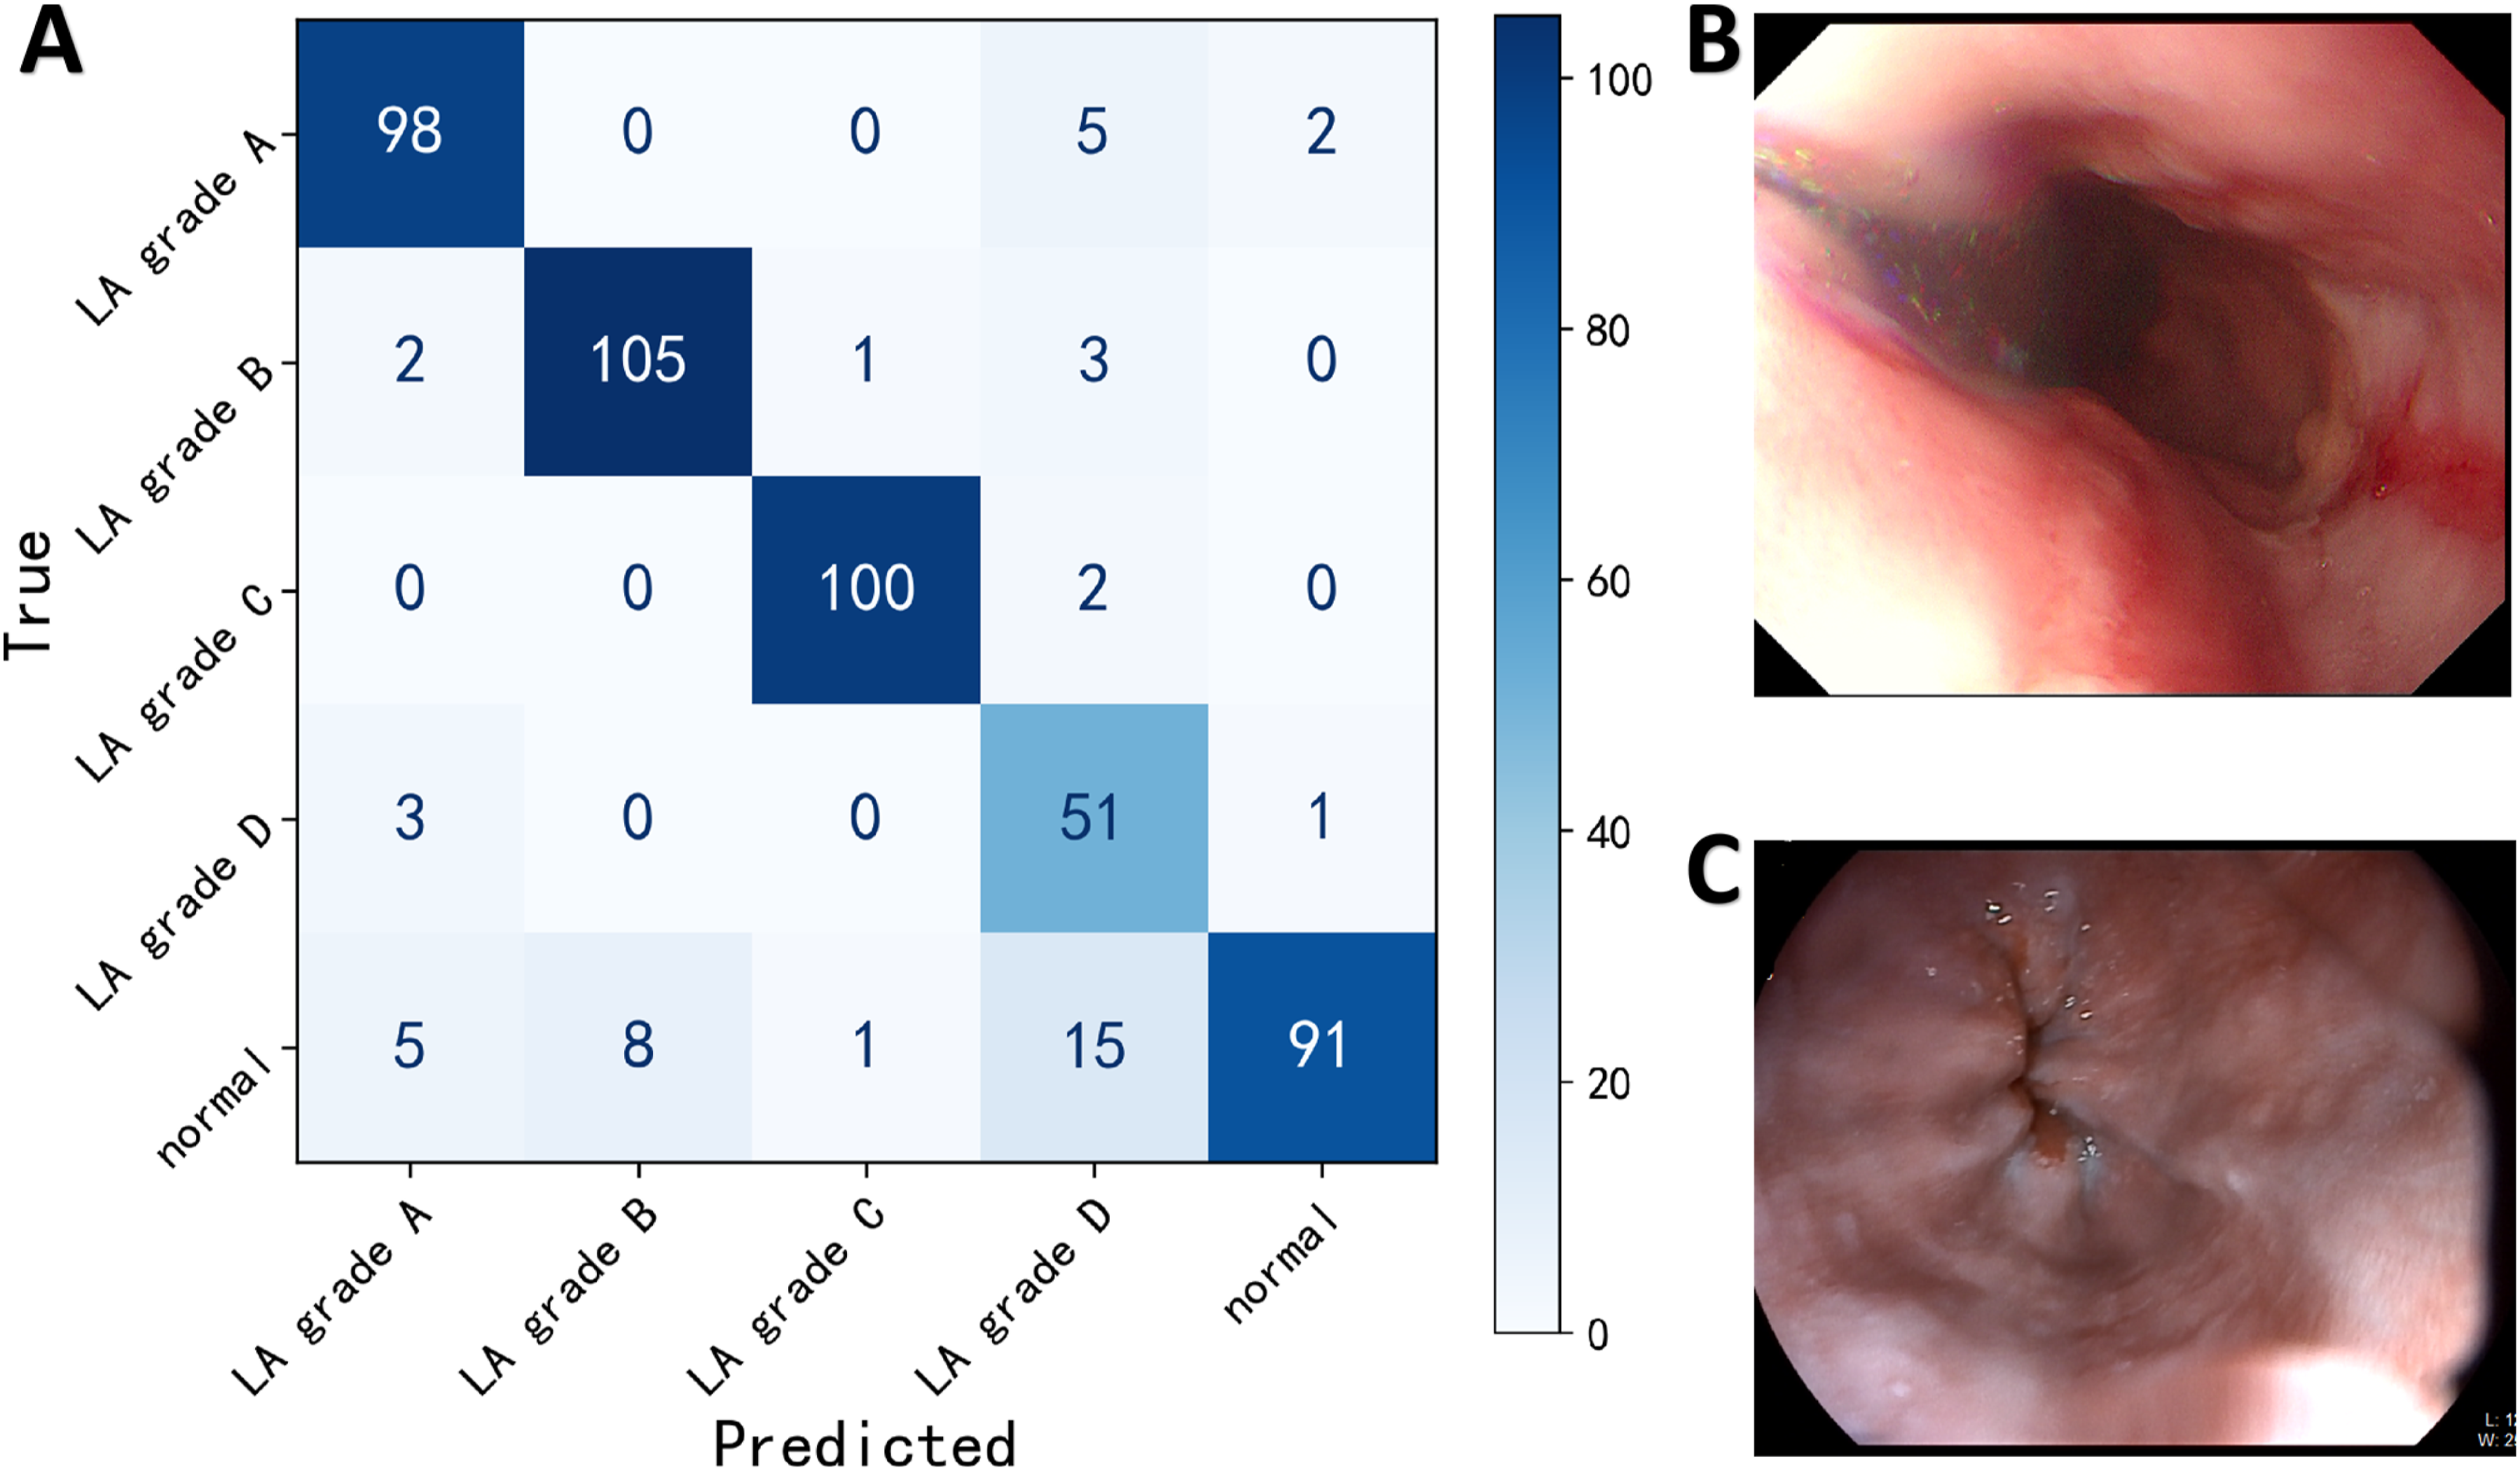
3.5. Model interpretability analysis
Figure 10 illustrates the visualization effect of Grad-CAM in the AI model’s decision-making process. The left column shows the original images; the middle column presents pixel activation heatmaps generated by the YOLOv11l model, clearly marking the key regions the model focuses on during decision-making; and the right column overlays the activation heatmaps onto the original images, with warm colors (such as red and yellow) highlighting the core areas identified by the model. Grad-CAM visualizations of the AI model’s decision-making process. Panels (a)1–3 and (b)1–3 display the original endoscopic images, Grad-CAM activation heatmaps, and the overlays of the original images with the activation heatmaps for LA grade A and LA grade D categories, respectively.
3.6. Model deployment with GUI for clinical use
To facilitate medical professionals without programming backgrounds in applying the AI model developed in this study during clinical practice, we exported the model trained with PyTorch and converted it into ONNX format. Additionally, we developed an intuitive and user-friendly graphical user interface (GUI) using PyQt5 technology (Figure 11(a)). By scanning the QR code in Figure 11(b), users can watch a demonstration video showcasing the process of endoscopists performing batch predictions of RE images. The results indicate that this AI model performs exceptionally well in both prediction speed and recognition accuracy, meeting the requirements for clinical application. Desktop application developed based on the best-performing model. (a) Application with an intuitive user interface. (b) Video demonstration of batch image inference and prediction using the application.
3.7. Comparison of AI model and endoscopist diagnostic performance
In this study, the diagnostic accuracy and speed of five artificial intelligence models were compared with those of endoscopists at different experience levels. The test set included 493 RE images. Results showed that among all models, the YOLOv11l model achieved the highest diagnostic accuracy (97.89%), outperforming both junior (86.00%) and senior (93.98%) endoscopists. Chi-square analysis indicated that the differences in accuracy between YOLOv11l and junior endoscopists (χ2=45.93), as well as senior endoscopists (χ2=8.34), were both statistically significant (P<0.05 for both). In terms of diagnostic speed, the YOLOv11l model required only 5.09 seconds to analyze all 493 images when deployed on a terminal device (equivalent to 96.85 frames per second), which is approximately 45.5 times faster than junior endoscopists and 38.2 times faster than senior endoscopists (Figure 12). Compares the diagnostic accuracy and speed of the AI model with endoscopists of varying experience levels. The bar chart illustrates the comparison of accuracy, while the line chart reflects the time taken; the left vertical axis represents accuracy, and the right vertical axis indicates the diagnostic time (in seconds).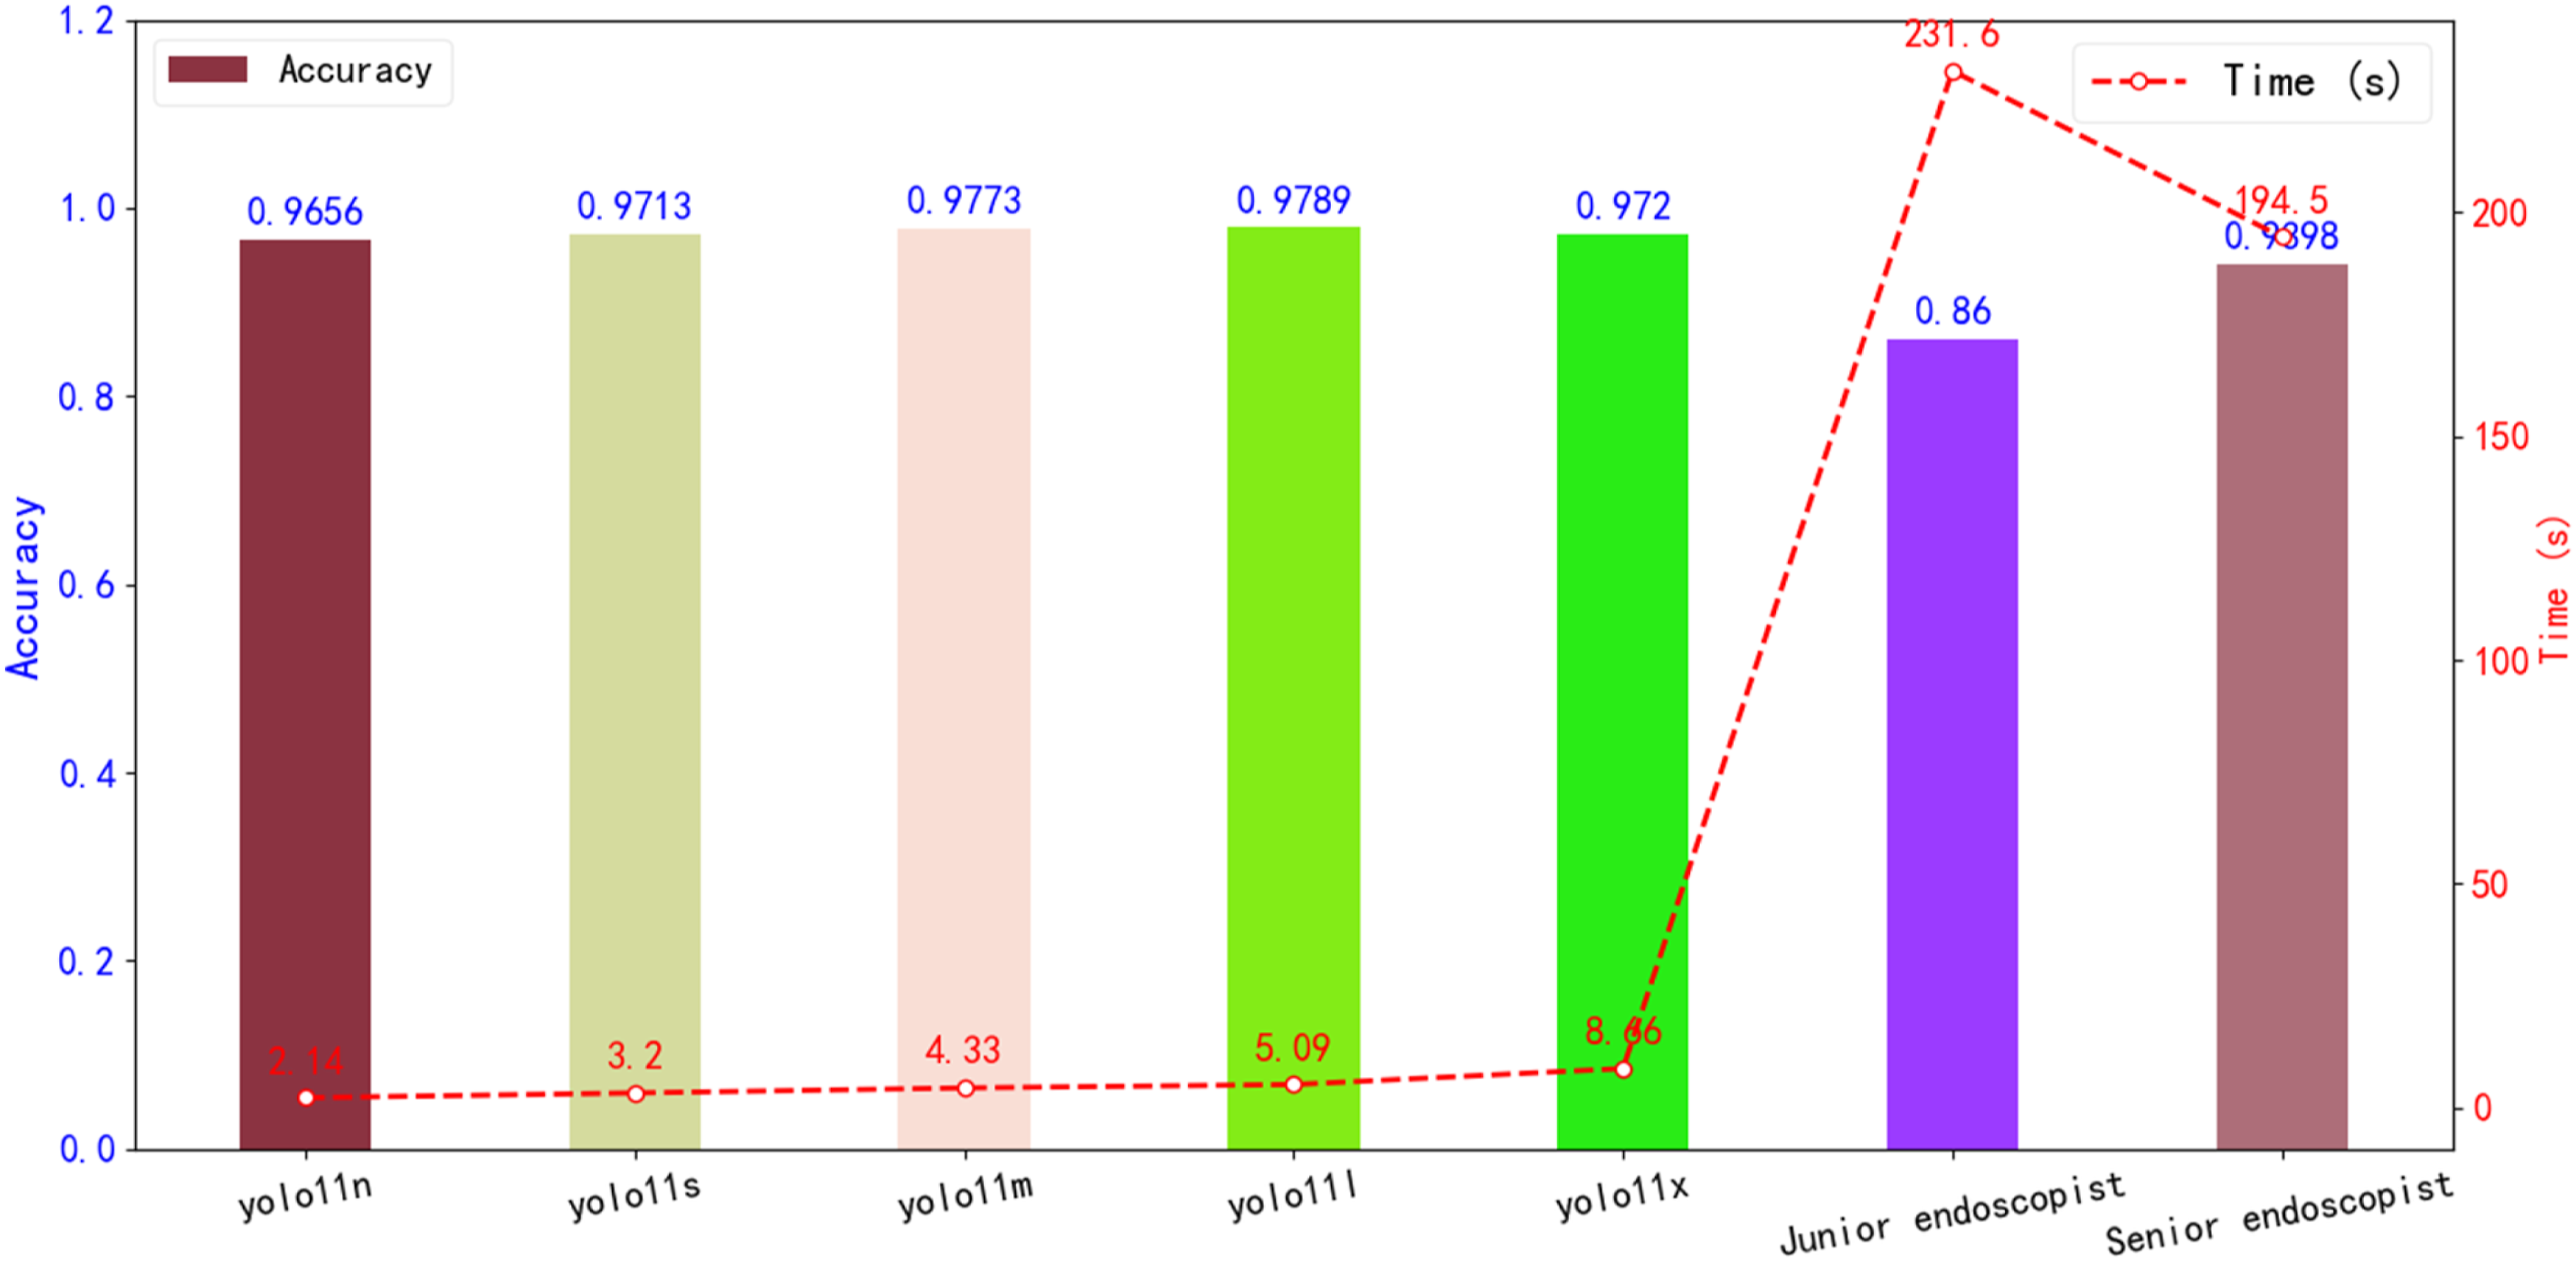
4. Discussion
This study constructed a dataset of gastroscopic images of reflux esophagitis, classified into five categories based on the Los Angeles Classification. On this foundation, five versions of the YOLO model with different scales were developed using transfer learning to achieve automatic LA Classification of RE images. During validation and testing, YOLOv11l demonstrated the best classification performance and showed promising clinical application potential in human-computer comparison experiments. The model was subsequently converted to ONNX format and successfully deployed to a terminal application developed with the PyQt5 framework, enabling rapid inference and interactive operation. This study achieved a complete technical workflow encompassing dataset construction, model development and evaluation, model interpretability analysis, and terminal deployment, highlighting strong potential for clinical translation.
Reflux esophagitis (RE) commonly presents with symptoms such as heartburn, regurgitation, and chest pain. In severe cases, it can lead to sleep disturbances as well as psychological issues like anxiety and depression, and it significantly increases the risk of esophageal adenocarcinoma.16–18 The treatment strategies for RE vary according to the Los Angeles (LA) classification: for mild cases (LA-A/B), a standard dose of proton pump inhibitor (PPI) is generally recommended for about four weeks, while severe cases (LA-C/D) require treatment for at least eight weeks or longer.19,20 However, current endoscopic diagnosis of RE based on the LA classification relies heavily on subjective judgment, and is affected by variations in experience and the lack of standardized training, resulting in inadequate accuracy and consistency. Therefore, the introduction of AI-assisted diagnosis to enhance the accuracy and objectivity of endoscopic LA classification holds significant clinical value.
Ge et al. 7 developed an AI model for automatic LA classification based on convolutional neural networks (CNN), achieving an identification accuracy of 95.70% on the test set. However, their model was only able to distinguish among three categories: normal, mild esophagitis (LA-A/B), and severe esophagitis (LA-C/D). According to the latest Lyon Consensus 2.03, LA-B grade RE is now regarded as definitive evidence for the diagnosis of gastroesophageal reflux disease (GERD), while LA-A grade represents borderline evidence that requires additional supporting indicators for a definitive diagnosis. Visaggi et al. 11 found that LA-B grade RE, as assessed by dynamic pH-impedance monitoring, can serve as an objective marker for GERD diagnosis. Therefore, an AI model capable of accurately distinguishing between LA-A and LA-B grades holds significant clinical value for improving diagnostic accuracy and optimizing individualized treatment strategies for GERD. The AI system developed in this study, based on the YOLO neural network, achieves automatic five-category classification according to the Los Angeles classification for RE, with an accuracy of 96.26%, outperforming the work of Ge et al. and providing a more refined and accurate diagnostic tool for clinical practice.
Yen et al. 9 employed a two-stage strategy combining deep learning and machine learning, using transfer learning to extract endoscopic image features and obtain high-dimensional deep image representations, followed by training and optimizing a classification model with machine learning algorithms, ultimately developing the GerdNet-RF model for automatic LA classification, which achieved an accuracy of 92.50%. In contrast, this study adopted an end-to-end transfer learning approach. Although this method requires greater computational resources during model training, its highly integrated structure and streamlined workflow enable classification results to be obtained with a single forward pass during inference, resulting in faster inference speed and lower computational cost. This makes it more suitable for deployment and application in medical centers lacking high-performance computing resources. After ONNX format conversion, the model developed in this study has been successfully integrated into a terminal application built on the PyQt5 framework, enabling the analysis of 493 images in just 5.09 seconds in actual tests—about 45.5 times faster than junior endoscopists and 38.2 times faster than senior endoscopists.
For this classification task, YOLOv11 was selected because it provides an officially supported classification framework with efficient feature extraction, strong multi-scale representation, convenient ONNX export, and low-resource inference, all of which are important for clinical deployment. To justify this choice beyond in-family YOLO comparisons, we additionally benchmarked YOLOv11l against ResNet-50 under the same training and validation settings. YOLOv11l outperformed ResNet-50 across all four classification metrics and achieved a 1.67-fold higher inference throughput, supporting its practical suitability for LA classification.
Among the five YOLOv11 model variants evaluated, a clear relationship between model scale and classification performance was observed. The lighter models (YOLOv11n and YOLOv11s) offered the fastest inference speed (430.74 and 410.26 FPS, respectively) but at the cost of reduced sensitivity, particularly for challenging categories such as LA-D. The larger YOLOv11x model did not yield meaningful gains over YOLOv11l in classification metrics despite a substantially higher parameter count and slower inference speed (297.15 FPS). YOLOv11l achieved the best overall balance, with the highest accuracy (97.89%), sensitivity (93.69%), and F1 score (94.28%) on the validation set, while maintaining a clinically acceptable inference speed of 355.85 FPS. These findings suggest that for the specific task of RE classification, increasing model complexity beyond a certain threshold offers diminishing returns, and YOLOv11l represents the most practical configuration for clinical deployment.
The misclassifications observed in YOLOv11l on the external test set carry asymmetric clinical implications that warrant cautious interpretation. Two error patterns deserve particular attention: bidirectional Normal–LA-D confusion and Normal-to-LA-A under-calling. Over-calling Normal as LA-D may expose patients to unnecessary acid-suppression therapy, repeat endoscopy, and potential anxiety, while the reverse error — under-calling borderline mucosal changes (whether as Normal-to-LA-A misreads or as missed minimal lesions) — could delay the diagnosis of borderline GERD, which under Lyon Consensus 2.0 already requires further objective testing. The Normal-vs-LA-D confusion likely arises from the limited LA-D training cohort (n=228) combined with image-level factors such as uneven illumination, luminal fluid, peri-junctional mucosal folds, and Z-line tortuosity, which can blur the visual boundary between truly normal mucosa and confluent severe esophagitis. Given these considerations, the model is best positioned in its current form as a decision-support tool that flags candidate cases for endoscopist review, rather than as an autonomous classifier.
This study has several limitations. First, the absence of prospective clinical validation limits evaluation of the model’s real-world clinical performance. Future prospective studies will follow standardized reporting frameworks (e.g., TRIPOD-AI and STARD-AI) to enhance transparency and reproducibility.21,22 Second, the current model has limited ability to identify non-erosive gastroesophageal reflux disease (NERD); in the future, we plan to integrate structured clinical data and images of the gastroesophageal flap valve to develop a multimodal model and improve identification in this patient group. Additionally, this study did not explore the correlation between imaging, pathology, and follow-up outcomes, which could be further addressed in subsequent research.
5. Conclusions
This study developed and validated an AI-based automatic recognition and classification system for reflux esophagitis using the YOLOv11 neural network and multicenter endoscopic image data. Among the five model variants evaluated, YOLOv11l demonstrated the best overall performance, achieving a weighted average accuracy of 96.26%, precision of 91.58%, and AUC of 0.995 on the independent external test set. In human-computer comparison experiments, the AI model significantly outperformed both junior (χ2=45.93, P<0.05) and senior endoscopists (χ2=8.34, P<0.05) in diagnostic accuracy, while achieving an inference speed approximately 45.5 times faster than junior endoscopists. Grad-CAM visualization confirmed that the model’s attention regions were consistent with clinically relevant lesion areas. The model was successfully deployed as a user-friendly desktop application using PyQt5 technology, completing a full technical pipeline from dataset construction to clinical deployment. These findings suggest that the proposed AI system holds significant promise for improving the efficiency, accuracy, and consistency of LA classification in clinical practice, potentially supporting standardized diagnosis and individualized treatment strategies for RE patients.
Footnotes
Acknowledgements
We express our gratitude to the OpenMMLab team (![]() ) for their valuable guidance and support in the field of artificial intelligence technology. The authors used ChatGPT to improve the readability and language of the manuscript. After using this tool, the authors reviewed and edited the content as needed and take full responsibility for the content of the publication.
) for their valuable guidance and support in the field of artificial intelligence technology. The authors used ChatGPT to improve the readability and language of the manuscript. After using this tool, the authors reviewed and edited the content as needed and take full responsibility for the content of the publication.
Ethical considerations
This study has been approved by the Ethics Review Committee of Changshu Hospital Affiliated to Soochow University (the IRB approval number L2025037). This study was performed in accordance with the Declaration of Helsinki, and written informed consent was obtained from all participants.
Author contributions
Author contributions CJ and ZML contributed equally to this work. CJ and WGH worked on the study design. ZML and LX worked on data collection. CJ and XKJ worked on data analysis. ZML worked on manuscript preparation. LX, and XKJ provided administrative, technical, or material support. XXD supervised the study. All authors have made a significant contribution to this study and have approved the final manuscript.
Funding
The authors disclosed receipt of the following financial support for the research, authorship, and/or publication of this article: This study was supported by the Changshu City Key Laboratory of Medical Artificial Intelligence and Big Data Capability Enhancement Project (CYZ202301), the Suzhou City Special Project on Clinical Key Disease Diagnosis and Treatment Technologies(LCZX202334), the Changshu Science and Technology Development Plan Project (CS202452), the Suzhou Science and Technology Development Program(SYW2025034), the Suzhou City’s 23rd Science and Technology Development Plan Project (SLT2023006) and the Changshu Key Medical Discipline (CSZDXK202302).
Declaration of conflicting interests
The authors declared no potential conflicts of interest with respect to the research, authorship, and/or publication of this article.
Data Availability Statement
The datasets analysed during the current study are available from the corresponding author on reasonable request.
Copyright statement for figures
All endoscopic images presented in this manuscript were acquired during routine clinical gastroscopy at the participating institutions and were fully de-identified prior to analysis. Images from the HyperKvasir dataset were used in accordance with the CC BY 4.0 license under which the dataset is publicly distributed. All schematic illustrations and workflow diagrams were originally created by the authors. No third-party copyrighted material is included.