
Abstract
Background
Depression has emerged as a significant public health concern in modern society, while conventional medical approaches exhibit notable limitations in its diagnosis and treatment. With the rapid advancement of technologies such as large-scale artificial intelligence (AI) models, the application of AI to drive research and innovation in mental health—and to further its translational implementation in clinical practice—has garnered increasing attention.
Objective
Focusing on the intersection of AI and depression, this bibliometric study aims to reveal key themes and developmental trajectories within this domain.
Methods
A bibliometric analysis was performed on publications retrieved from the Web of Science Core Collection. Utilizing the Bibliometrix package, CiteSpace, and VOSviewer, we quantified publication output, collaboration networks, and key research themes. The analysis encompassed English-language articles published between 2011 and 2024.
Results
A total of 1361 publications met the inclusion criteria. Since 2011, the annual number of publications on AI in depression has demonstrated a steady upward trajectory, entering a phase of accelerated growth after 2020. The peak annual output exceeded 300 articles. Analysis of geographical and institutional contributions identified China and the United States as the leading countries, with Lanzhou University being the most productive institution. The most prolific authors were Bin Hu, Xiaowei Li, and Raymond W. Lam, while R.C. Kessler emerged as the most cocited author. Keywords such as “machine learning,” “deep learning,” and “feature extraction” showed a marked increase in frequency, reflecting the field's evolving technical focus. Furthermore, the development of international collaborations underscores the increasingly globalized nature of research in this domain.
Conclusion
This study presents the latest comprehensive bibliometric analysis results of AI in the field of depression, clarifying current research hotspots and directions, and providing important resources for clinicians and researchers.
Introduction
Depression is a psychological disorder characterized by significant and persistent low mood. Its clinical manifestations include anhedonia, diminished interest, feelings of hopelessness, and reduced self-worth, which may lead to self-harm or suicide in severe cases.1,2 As a major global public health challenge, depression affects populations worldwide. Epidemiological data show that approximately 7.8% of adults in the United States experienced at least one major depressive episode in 2019, while in the same year, more than 500,000 individuals aged 15–54 in South Korea were diagnosed with major depressive disorder (MDD).3,4 Since the onset of the COVID-19 pandemic in 2019, the global prevalence of depression has risen substantially, with an increase of 27.6% reported in 2020 alone. 5 According to the World Health Organization, more than 350 million people worldwide live with depression, and depression-related suicides account for nearly one million deaths annually, imposing a heavy burden on healthcare systems globally. 6
Currently, the clinical screening for depression relies primarily on clinician interviews and standardized assessment scales. However, only about 1% of healthcare professionals worldwide specialize in mental health, 7 and the severe shortage of psychiatrists leaves many patients without timely and adequate assessment and diagnosis. Consequently, there is an urgent need in clinical practice for more objective, accurate, and efficient tools to aid in diagnosis and intervention, thereby reducing rates of missed and misdiagnosed cases.
Artificial intelligence (AI) technologies, particularly machine learning and deep learning, offer promising solutions to address the aforementioned challenges. By analyzing multimodal data such as speech features, facial expressions, electroencephalography (EEG), and functional magnetic resonance imaging (fMRI), AI models have demonstrated potential in the early identification, symptom assessment, and auxiliary diagnosis of depression.8–10 However, translational applications in this field still face significant bottlenecks. Firstly, the performance of AI models is highly dependent on large-scale, high-quality, and standardized labeled data, while the acquisition of depression-related data is often constrained by privacy, ethical considerations, and clinical heterogeneity, leading to data scarcity and inconsistent quality.11,12 Secondly, many advanced AI models exhibit “black box” issues, with their decision-making logic lacking interpretability, making it difficult to gain clinicians’ trust and integrate them into diagnostic and therapeutic processes. 13 Additionally, the rapid development and fragmented research directions in this field lack systematic organization of overarching knowledge structures, evolution of research hotspots, and international collaboration models. This results in researchers struggling to grasp the overall context, accurately identify critical gaps, and determine future directions.
In this context, bibliometrics serves as an objective and quantitative macro-analytical tool capable of revealing scientific outputs, collaborative networks, knowledge bases, and research frontiers within a given field.14,15 Using visualization software such as VOSviewer and CiteSpace, the dynamic trajectories and structural characteristics of field development can be presented intuitively.16,17 Notably, CiteSpace is particularly adept at uncovering evolutionary pathways and emerging trends through cocitation analysis and keyword burst detection. 18
Although existing research has focused on the application of AI in mental health, the time span of these studies is relatively short (up to 2019), and a systematic overview of AI-specific research in the field of depression, including its evolutionary trajectory and collaborative ecosystem, has not yet been established. To address this gap, this study aims to conduct a systematic bibliometric and visualization analysis of English literature on AI applications in depression research from 2011 to 2024. The specific objectives include: (1) mapping the publication volume in this field, as well as the macro-level trends in countries, institutions, and author collaboration networks; (2) identifying key articles, keywords, and core themes; (3) exploring the evolution of research hotspots and emerging trends; (4) discussing current limitations based on the analysis results and proposing future research directions to promote more focused, collaborative, and clinically translational development in this field.
Methods
Research methodology
Data source and database selection
The Web of Science Core Collection (WOSCC) database was searched systematically, with the citation index including the Science Citation Index Expanded and the Social Science Citation Index. 19 For decades, Web of Science Core Collection (WoSCC) has been recognized as one of the most authoritative and reliable databases in bibliometric research. 20 By providing standardized and structured citation data, it significantly facilitates the construction and evolution analysis of scientific knowledge maps across disciplines and time periods. The period covered spans from 1 January 2011 to 31 December 2024. All literature searches were conducted within one day (26 March 2025) to avoid bias related to database updates.
Search strategy and query formulation
This study was conducted in accordance with the established protocols specified in the BIBLIO methodological framework, with strict inclusion and exclusion criteria. Twenty checklists are presented in the attached checklist (Supplement 1). Inclusion Criteria: (1) Related to topics on depression and AI; (2) Written in English; (3) Limited to Articles and Reviews. Exclusion Criteria: (1) Unrelated to the topic and content of this study; (2) Duplicate publications; (3) Retracted publications.
The search strategy was designed to capture literature in the intersection of AI and depression. Queries are constructed using advanced Boolean operators, truncation symbols, and domain-specific syntax to maximize sensitivity (comprehensiveness) and specificity (relevance). The search terms used were the topic and free terms related to “depression and AI” from the MeSH database of PubMed. The final search query was executed using the following keywords in the advanced search interface of the WOSCC database: TS = ((“depression* “OR “major depressive disorder*”) AND (“artificial intelligence*” OR “machine intelligence” OR “computational intelligence” OR “intelligent learning” OR “machine learning” OR “deep learning” OR “neural learning” OR “supervised learning” OR “neural network*” OR “data mining”)) AND Document Types = (Article OR Review) AND Publication Date = (2011-01-01 to 2024-12-31) AND Language = English. The literature selection process is visualized in Figure 1.

Flow chart of the bibliometric search and analysis process.
Validation of the search strategy
To ensure the effectiveness, accuracy, and reproducibility of the search strategy, all data were manually deduplicated and quality-checked by two graduate students.
Bibliometric and visualization techniques
Export the compliant literature in Refworks format and save it as download_wos.txt in Citespace (version 6.2.R7). Clean the retrieved literature to eliminate duplicate and invalid data, then perform data transformation as follows: CiteSpace: Time slice = 1 year (2011–2024); Pruning method: Pathfinder and Pruning Sliced Networks; Node types: Country, Institution, Author, and Keyword; Highlight detection parameters: gamma = 0.5, minimum duration = 1; Visualization: Cluster View-Static and Show Merged Network. VOSviewer (version 1.6.20): Minimum occurrence (keyword) = 5; Layout: Normalized Similarity; Edge weight: Co-occurrence frequency. Microsoft Office Excel 2019 was employed for statistical analysis of publication years and author frequencies; CiteSpace was used for keyword co-occurrence and burst analysis; VOSviewer was utilized for analyzing country, institution, author, and literature cocitation networks; and SCImagoGraphic was applied to create visual maps illustrating collaborations between countries and regions. Bibliometrix (R): perform geographic distribution visualization analysis in the R 4.5.1 environment using bibliometrix.
Results
Analysis of annual publication volume
The initial search yielded 1914 publications, with 1361 articles ultimately included after screening titles, abstracts, and full texts. The final dataset comprised 1250 articles and 111 reviews. The number of annual publications in the field of AI applied to depression showed an upward trend, with a steady growth period from 2011 to 2019, followed by a rapid growth phase from 2020 to 2024, during which the number of annual publications exceeds 100. It suggested that the application of AI in depression has garnered global interest and continues to be a prominent research focus. Notably, the highest average citation rate per year was recorded in 2011 and 2012 (Figure 2).
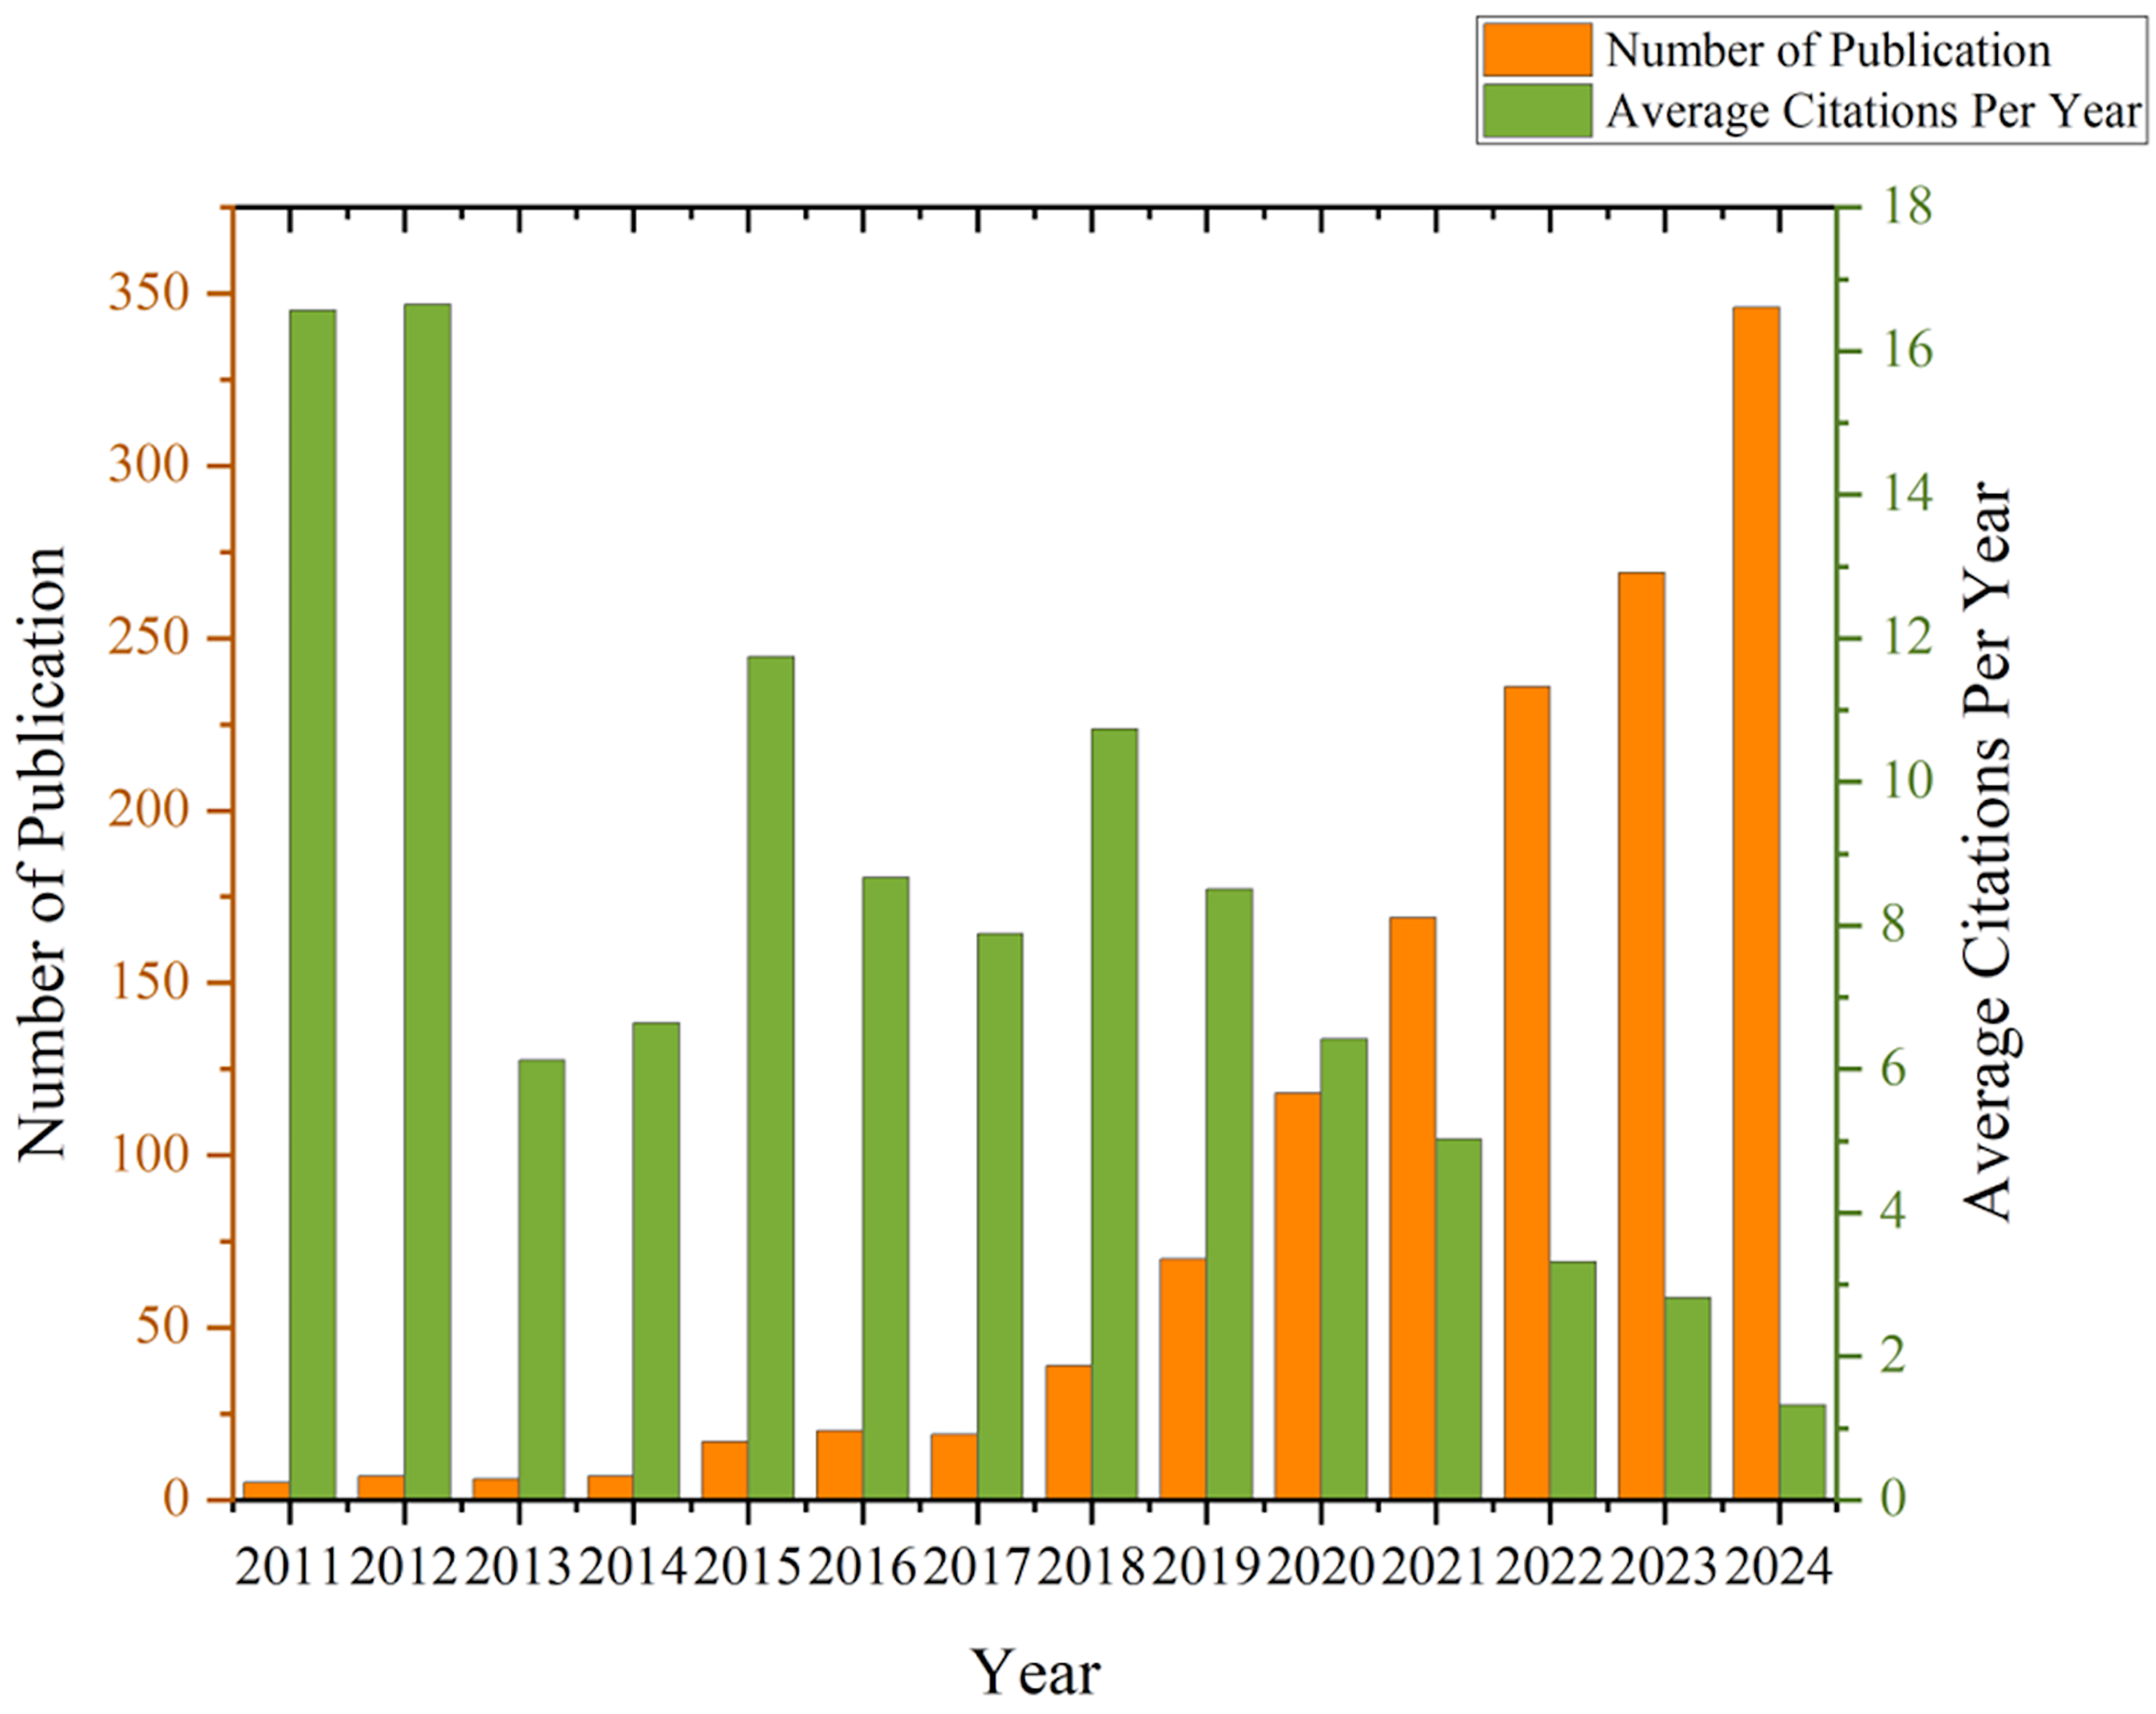
Trends in annual publications and average citations per year related to artificial intelligence (AI) and depression from 2011 to 2024. The left vertical axis indicates the number of publications and the right vertical axis indicates the average citation frequency per year.
Country/area analysis
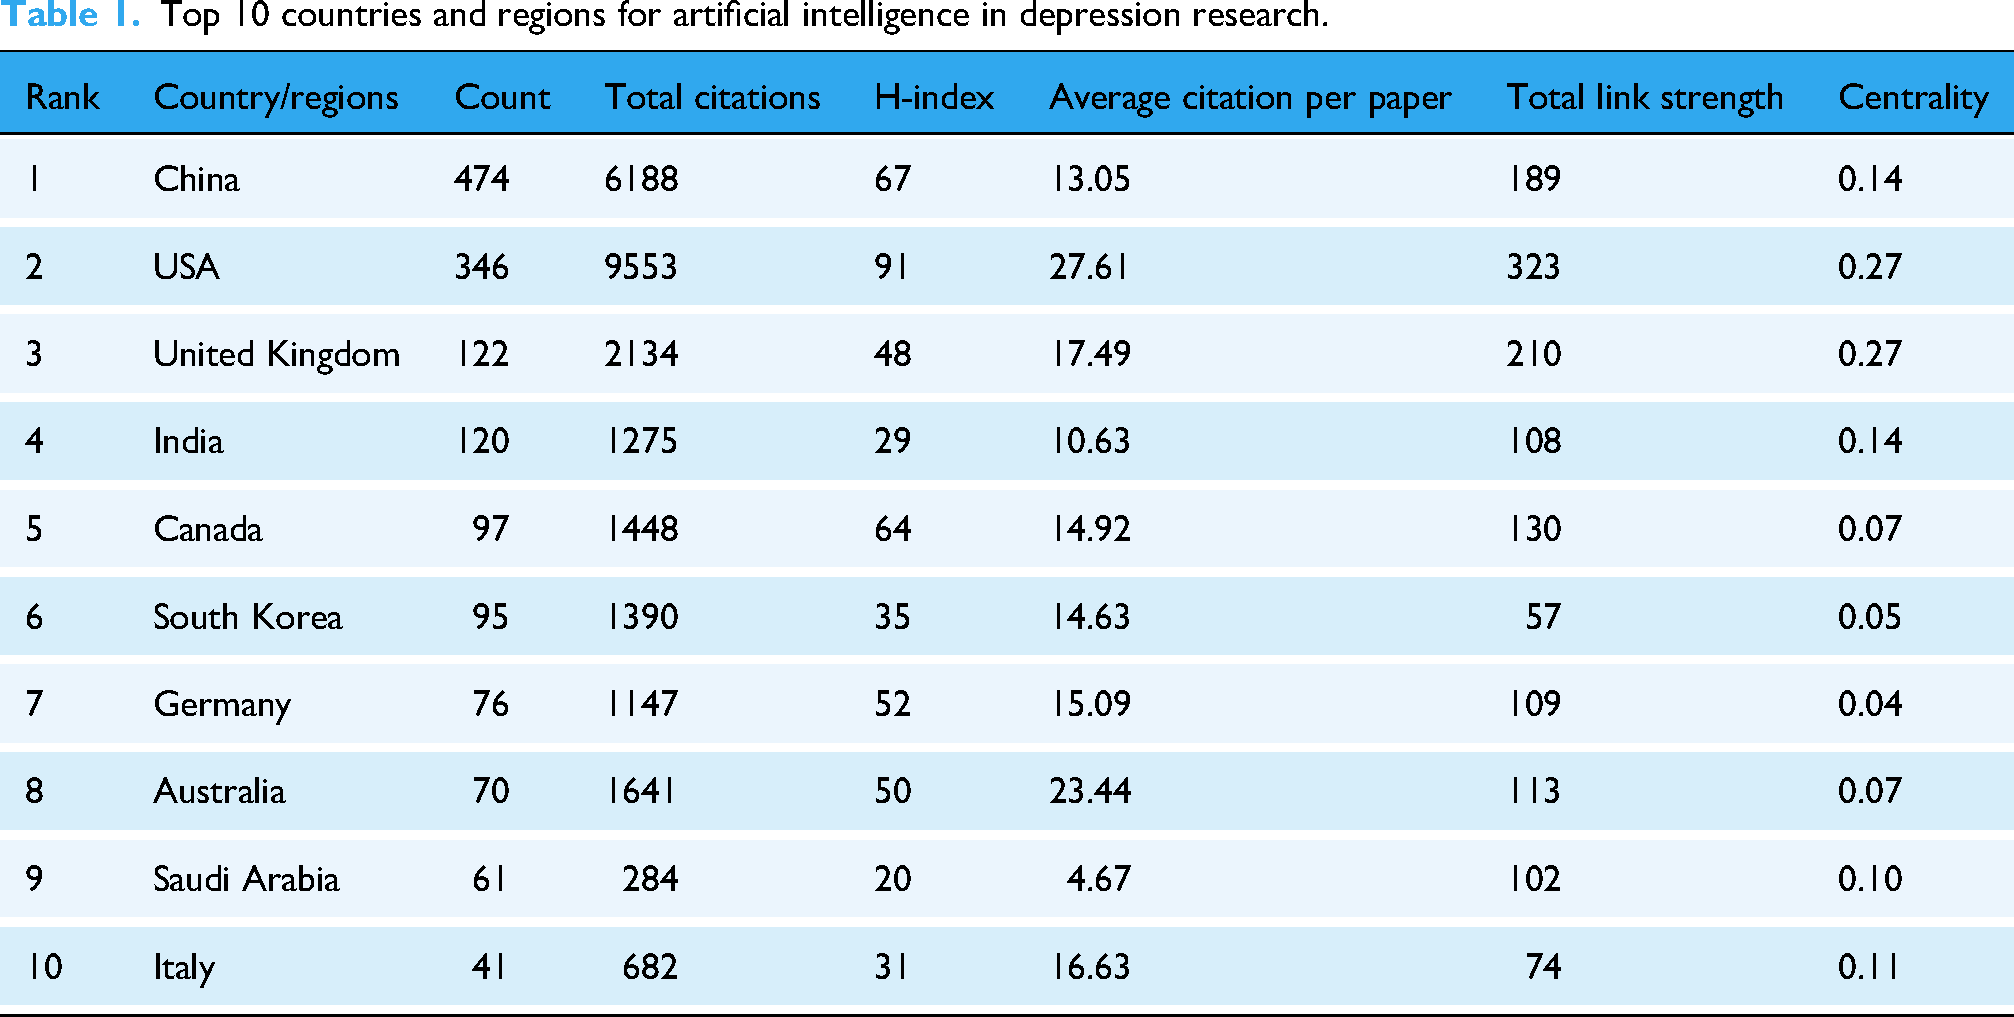
Since the InCites platform attributes a document to a country or region based on the author's affiliation, a single paper may be associated with two or more countries or regions if there is collaboration. A total of 80 countries or regions published research articles on the application of AI in the field of depression. China ranked first in terms of the number of published articles (474 articles), followed by the United States (346 articles), the United Kingdom (122 articles) (Table 1). The geographic-contribution map in Figure 3(a) indicated that the United States and China dominate research output in this domain. China's rising contributions aligned with the Healthy China 2030 agenda, which emphasized innovative advancement in mental health. Notably, the United States ranked first in terms of total citations (9553), H-index (91), and average citations per article (27.61). Additionally, Figure 3(b) displayed the publication trends of the top 10 countries from 2011 to 2024, showing that the number of publications in most of these countries has been steadily increasing. In particular, China surpassed the United States in terms of the number of publications in 2022, and the gap between the two continues to widen each year, suggesting that China will dominate in terms of publication volume. Country collaboration analysis reveals that the United States has the closest cooperation with other countries (Figure 3(c)). The USA, United Kingdom, China, and India displayed the highest centrality, underscoring their pivotal bridging function in the field (Figure 4).
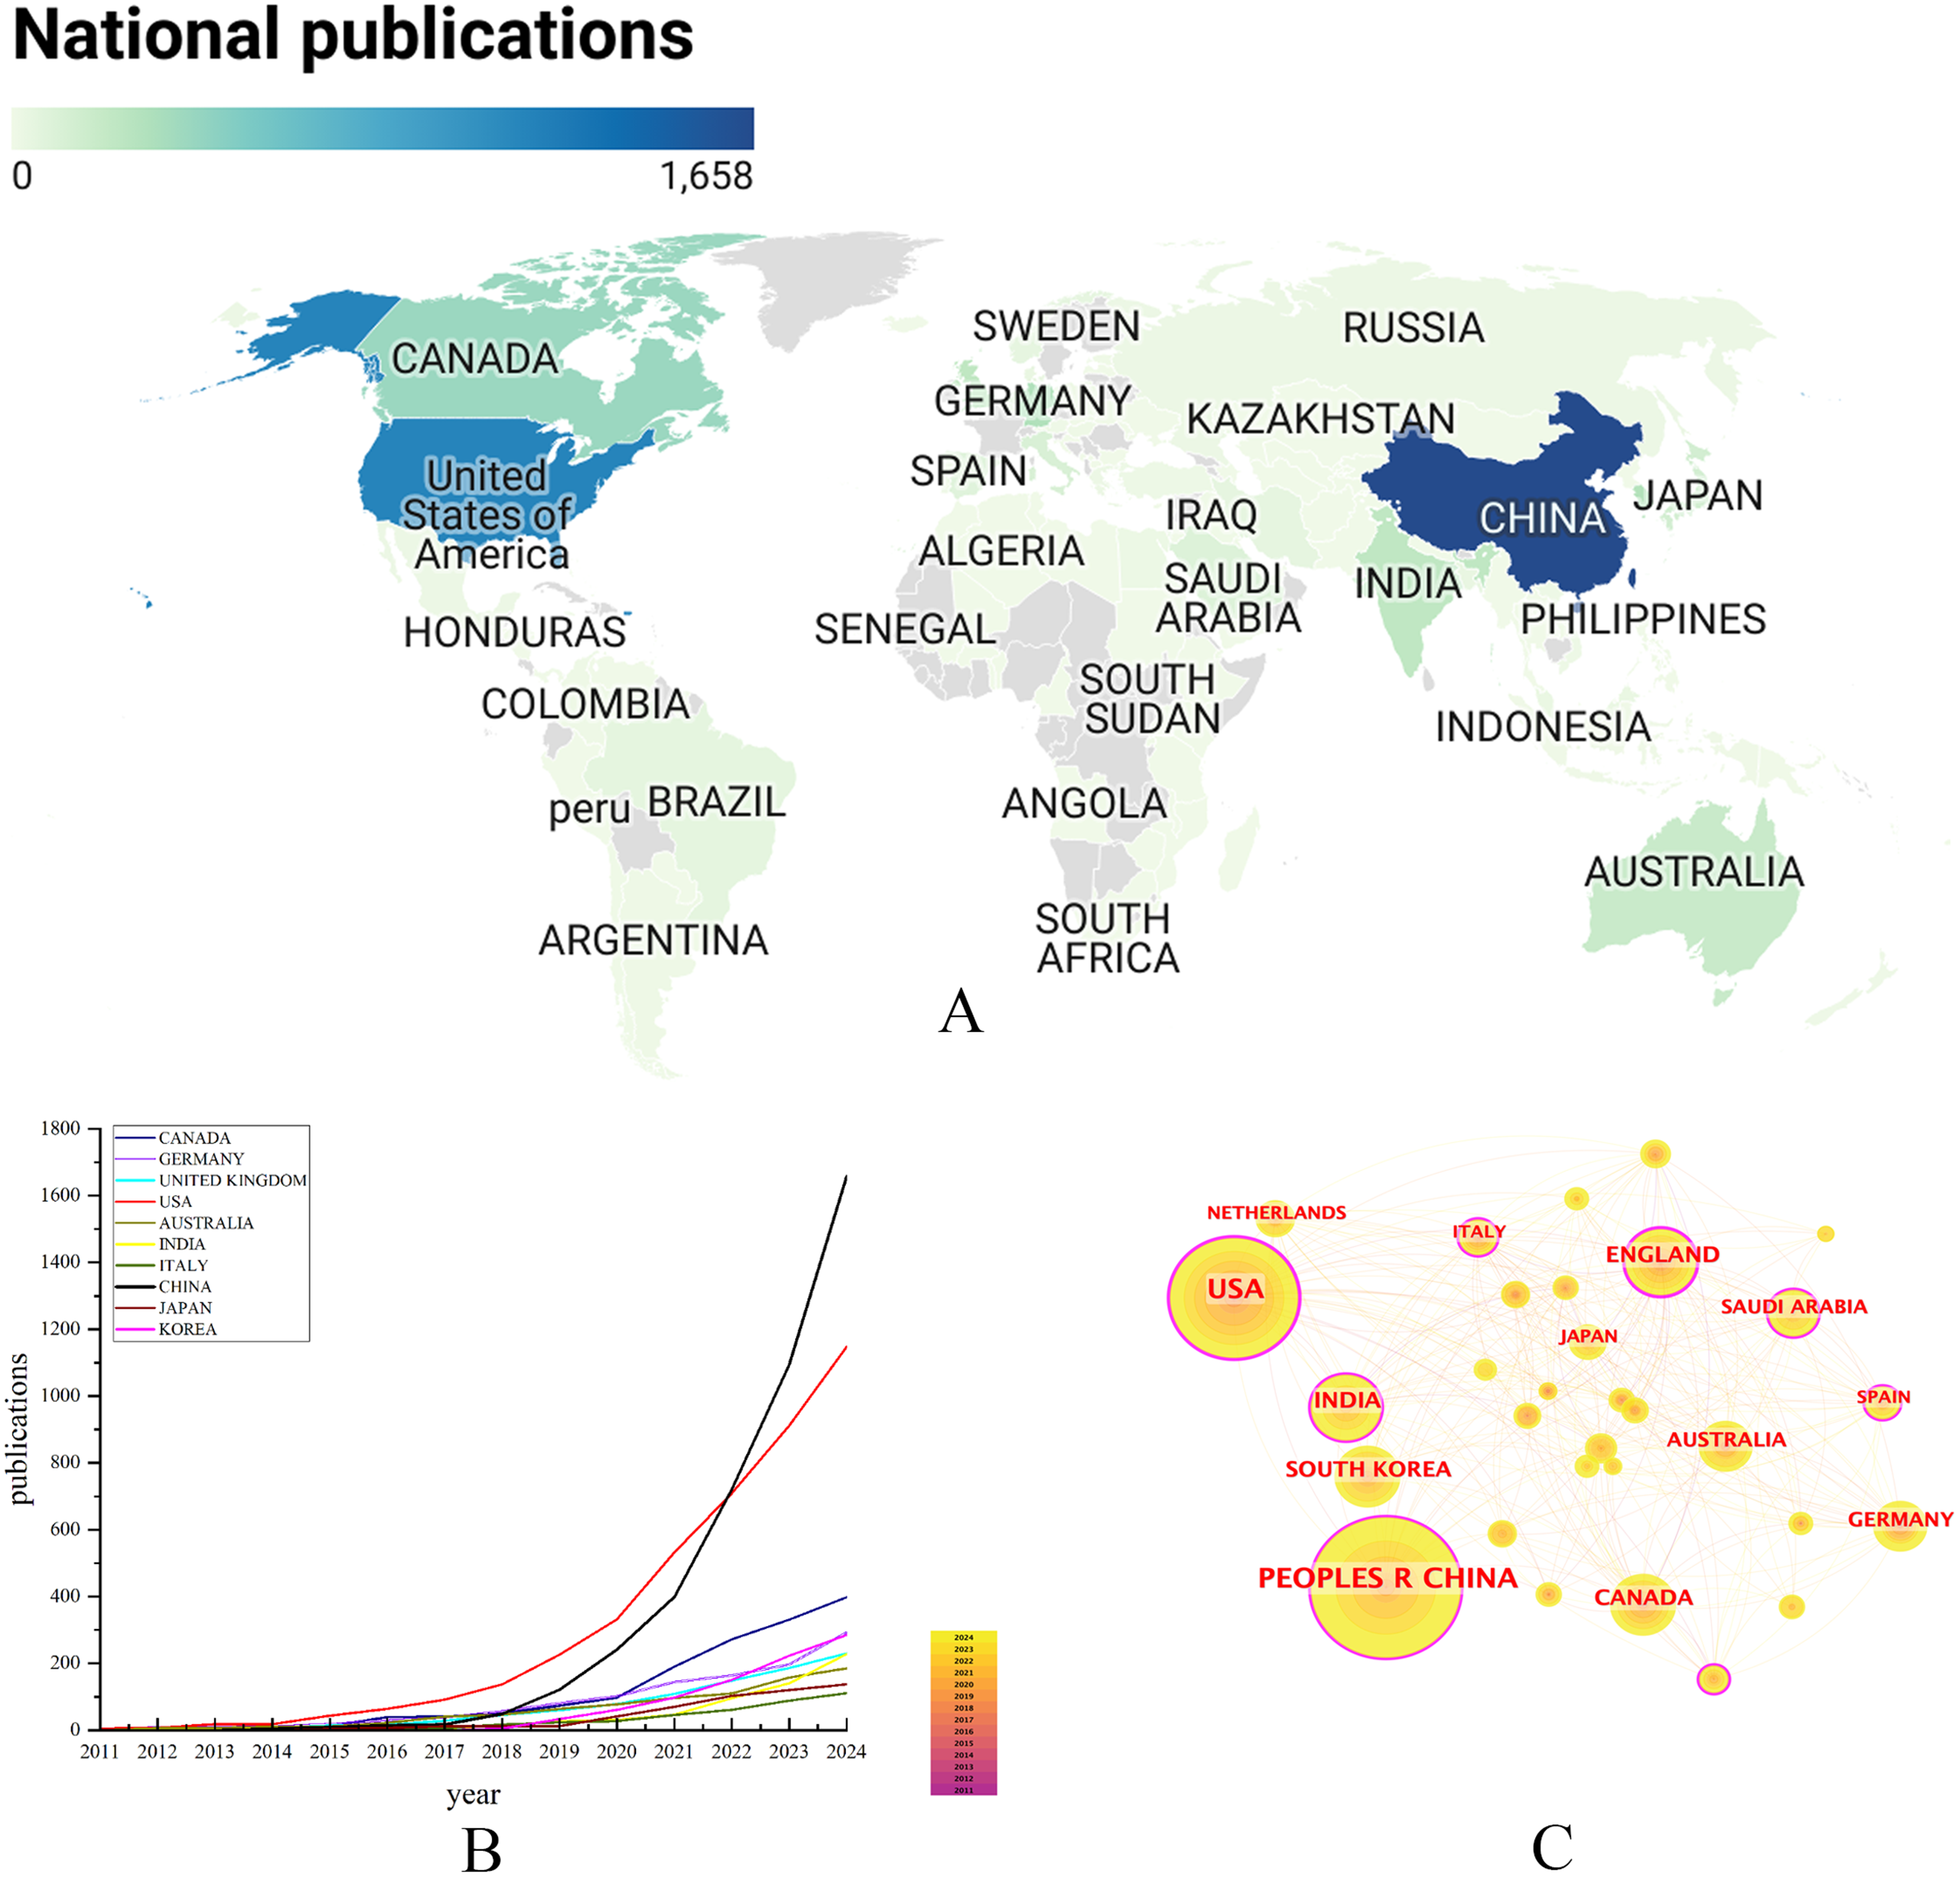
Coauthorship analysis of countries/regions. (a) Geographic distribution of publications. (b) Dynamics of annual publications of the Top 10 countries/regions. (c) Top 10 countries/regions contributing the most to the number of articles issued, 2011–2024.

The size of the circle of the national/regional collaboration network indicates the number of country/region postings, and the intensity of the color of the circle indicates the total link strength.
Top 10 countries and regions for artificial intelligence in depression research.
Institution analysis
A total of 2263 institutions were involved in this field. As shown in Table 2, Lanzhou University ranked first in terms of the number of publications (40), followed by the University of Toronto (36), the Chinese Academy of Sciences (30), Harvard Medical School (30), and Stanford University (27). Notably, University of Toronto emerged as the leading institution in terms of total citations and total link strength, suggesting its extensive collaborative network with external organizations (Figure 5(a)). Additionally, five of the top 10 institutions were based in China, highlighting the respective advantages of China and the United States in terms of production scale and impact. Regarding collaborations, most institutions tended to engage in intracluster collaborations, with external ties being more sporadic. For example, Chinese institutions exhibited a strong tendency for intraprovincial collaboration. The top three organizations with the strongest citation bursts were Lanzhou University from 2023 to 2024, Pennsylvania Commonwealth System of Higher Education from 2013 to 2017, and Princess Nourah Bint Abdulrahman University from 2023 to 2024 (Figure 5(b)).

Coauthorship analysis of institutions. (a) Mapping of institutional collaboration networks. The size of the nodes represents the number of messages sent by the institutions, the larger the nodes are the more messages are sent. The thickness of the line represents the strength of cooperation between institutions, the thicker the line the stronger the cooperation. Distinct clusters are rendered in separate colors. (b) Top 14 institutions with the strongest citation bursts.
Top 10 institutions for artificial intelligence in depression research.

Analysis of authors and cocited authors
A total of 7037 authors contributed to the field with publications, with the top 3 being Bin Hu (30), Xiaowei Li (11), and Raymond W Lam (9). The author team led by Bin Hu has published the most citations (Table 3), while the coauthorship map in Figure 5(a) positions Bin Hu as the principal node within the collaborative network. There is a certain degree of collaboration among the prolific authors, especially within the same cluster. However, collaboration between authors from different countries was more dispersed (Figure 6(a)). Citation-burst analysis identified Bin Hu, Xiaowei Li, and Zixuan Shangguan as the three most impactful scholars between 2023 and 2024, underscoring their leadership in this domain in a certain period (Figure 6(b)). The top three coauthors were Kroenke et al. (258), RC Kessler (215), and AT Beck (210). A visual map of cocited authors is shown in Figure 6(c). These results suggested a closer collaboration between Kroenke et al., and RC Kessler, indicating their strong research interest in this field.

Author collaboration network mapping. (a) The size of nodes represents the number of posts by authors, the larger the node the more posts. The thickness of the line represents the strength of cooperation between individual authors, the thicker the line the stronger the cooperation. (b) Top 25 authors with the strongest citation bursts. (c) Collaborative network mapping of cited authors. The node size indicates the number of citations, the larger the node the more citations. The thickness of the line represents the strength of collaboration between individual cited authors, the thicker the line the stronger the collaboration.
Top 10 authors and cited authors in artificial intelligence and depression research.

Analysis of cited journals
A total of 413 journals published the papers in this study. As shown in Table 4, Journal of Affective Disorders had more than 1000 citations, with 97 publications and a total of 1746 citations. According to the Journal Citation Report (JCR)2024, Impact factors of the top 10 journals ranged from 2.9 to 9.6, of which IEEE Transactions on Affective Computing was the highest (IF2023 = 9.6), and PLoS One was the lowest. Of the top 10 journals, 8 journals belonged to Q1, and 2 journals belonged to Q2. Figure 7 illustrates a high percentage of U.S.-based journals and a strong connection between them.
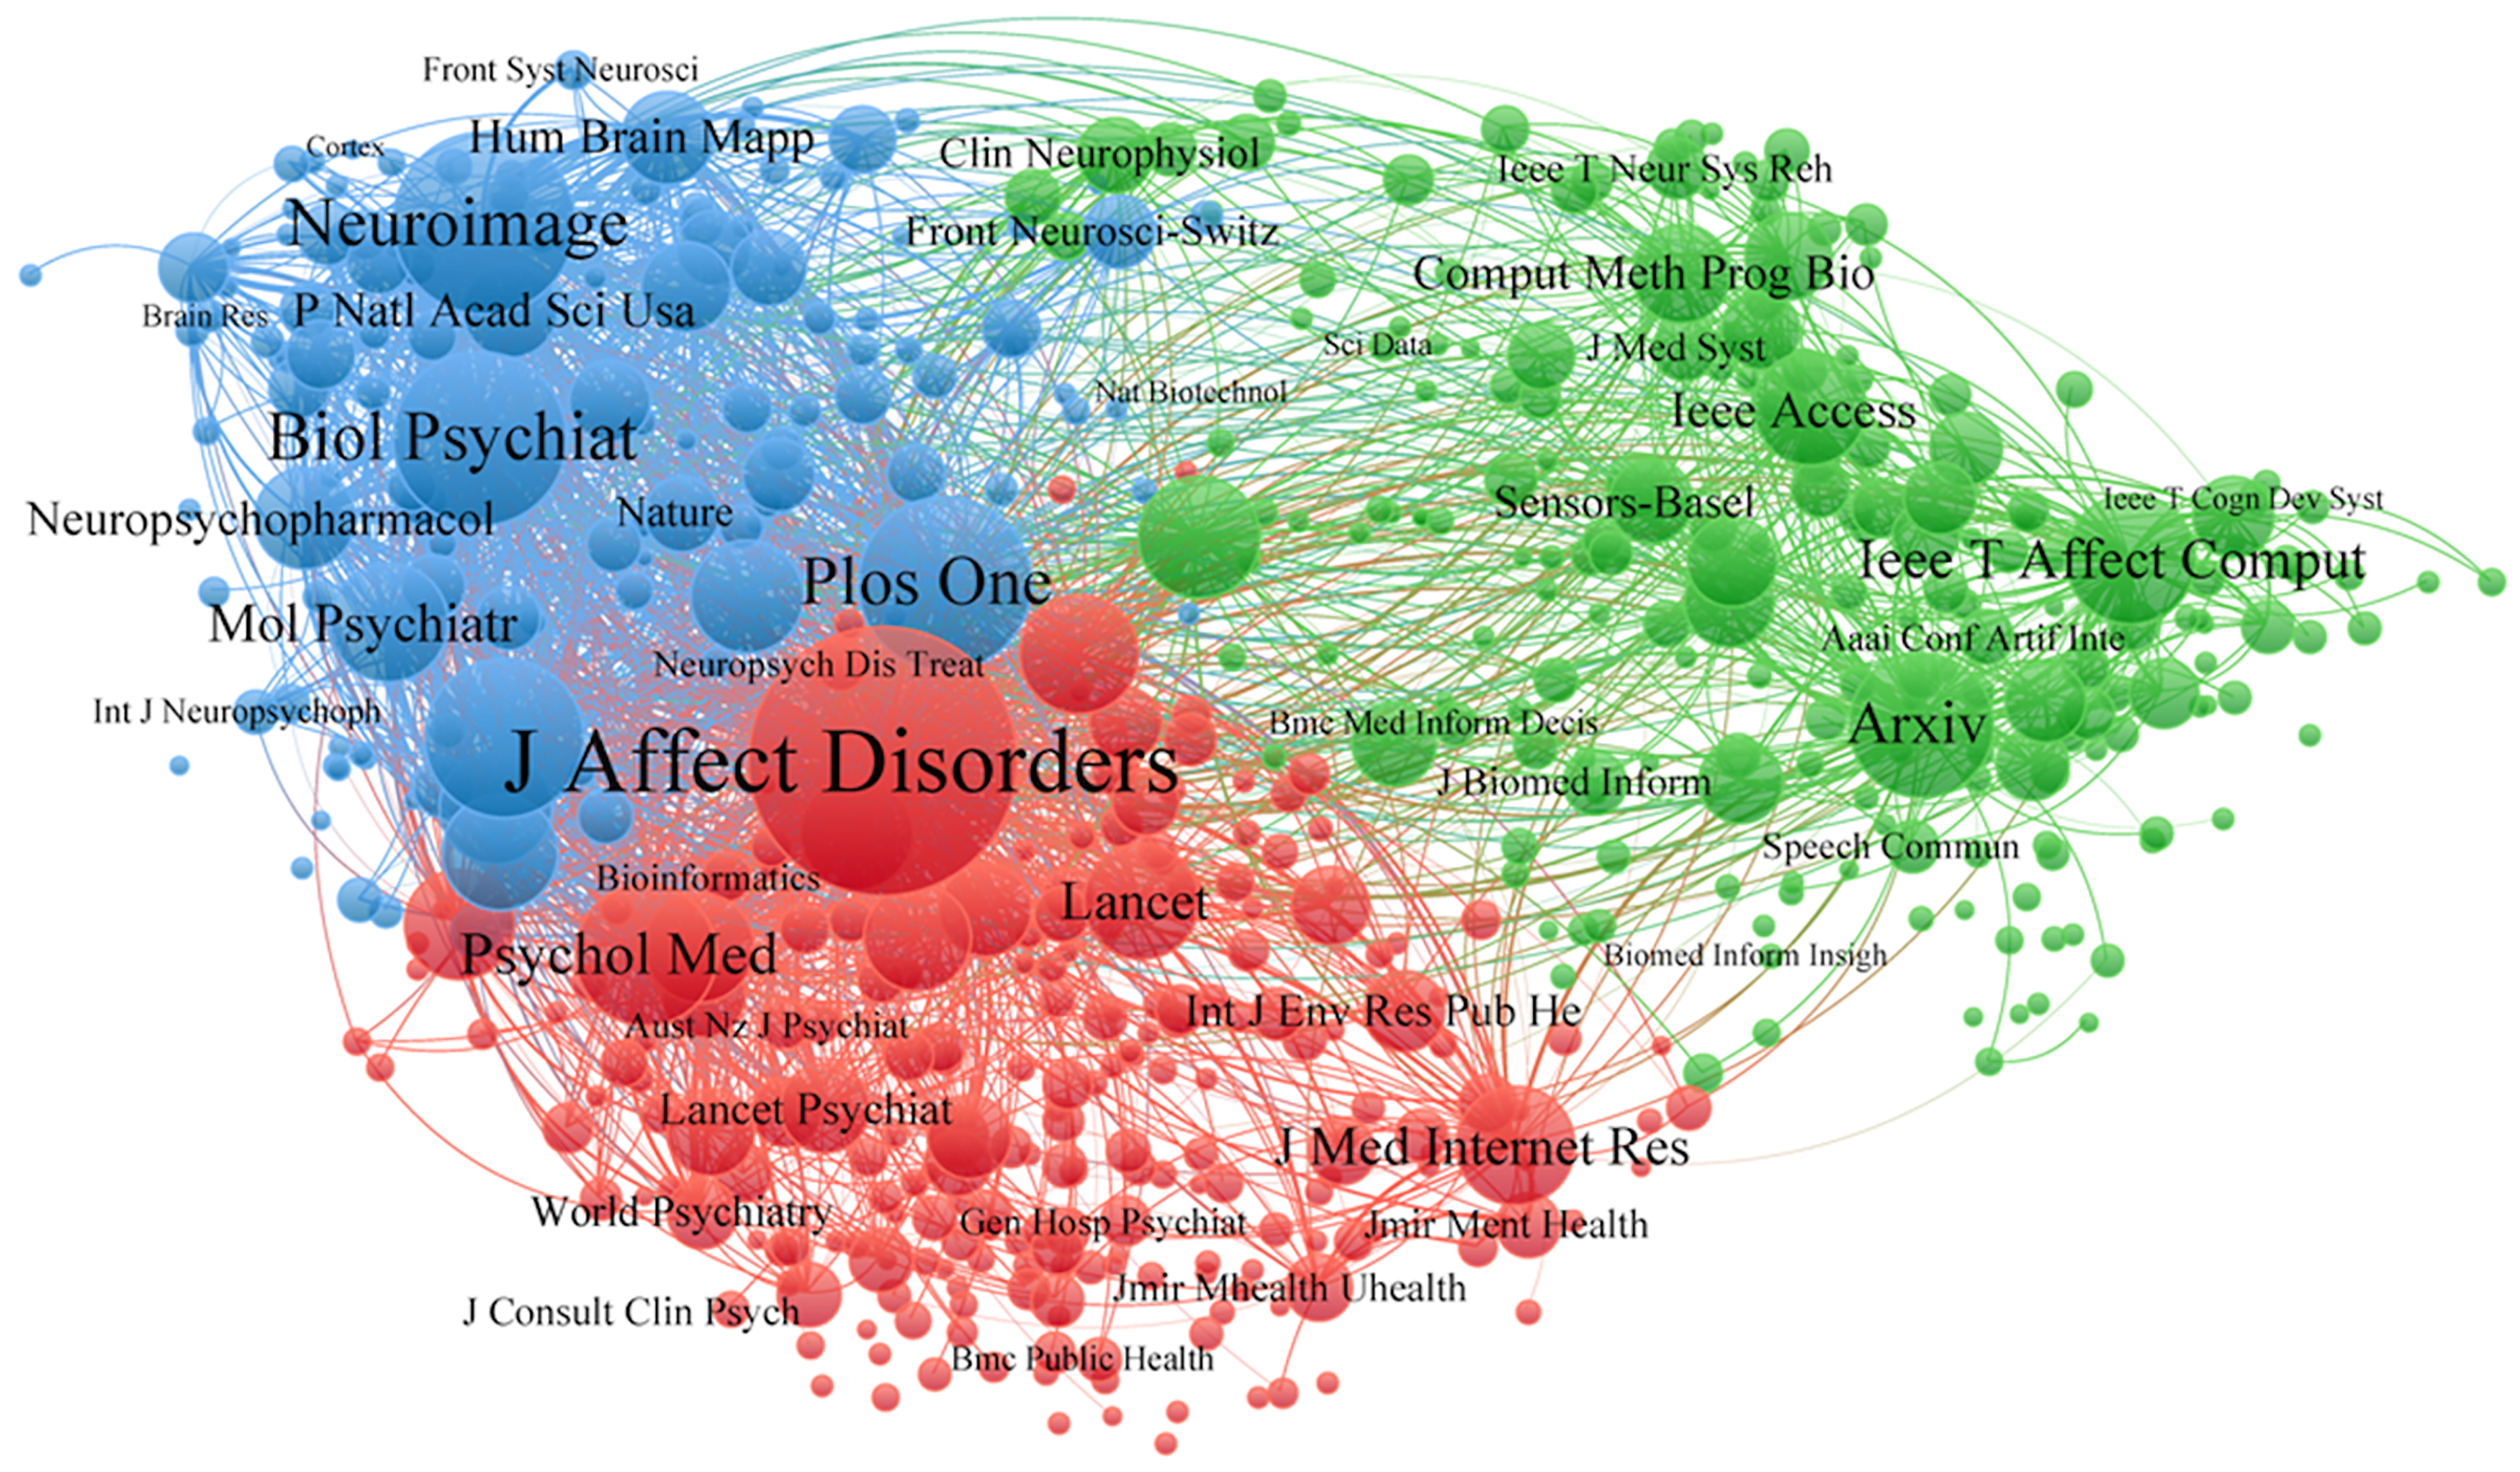
Journal collaboration mapping. The node size indicates the number of publications of the journal, the larger the node the more publications. The thickness of the line represents the strength of cooperation between individual journals, the thicker the line the stronger the cooperation.
Top 10 journals in publications.

Analysis of cocited literature
The cited literature holds significant reference value, reflecting the research hotspots and frontiers in this field. In total, the articles in this study cited 86,299 references, with the top 10 most cited pieces visualized in Figure 8. Among the most frequently cocited works are those of Kroenke et al. 21 and Hamilton, 22 each cited more than 100 times, indicating their substantial impact on this field (Table 5).
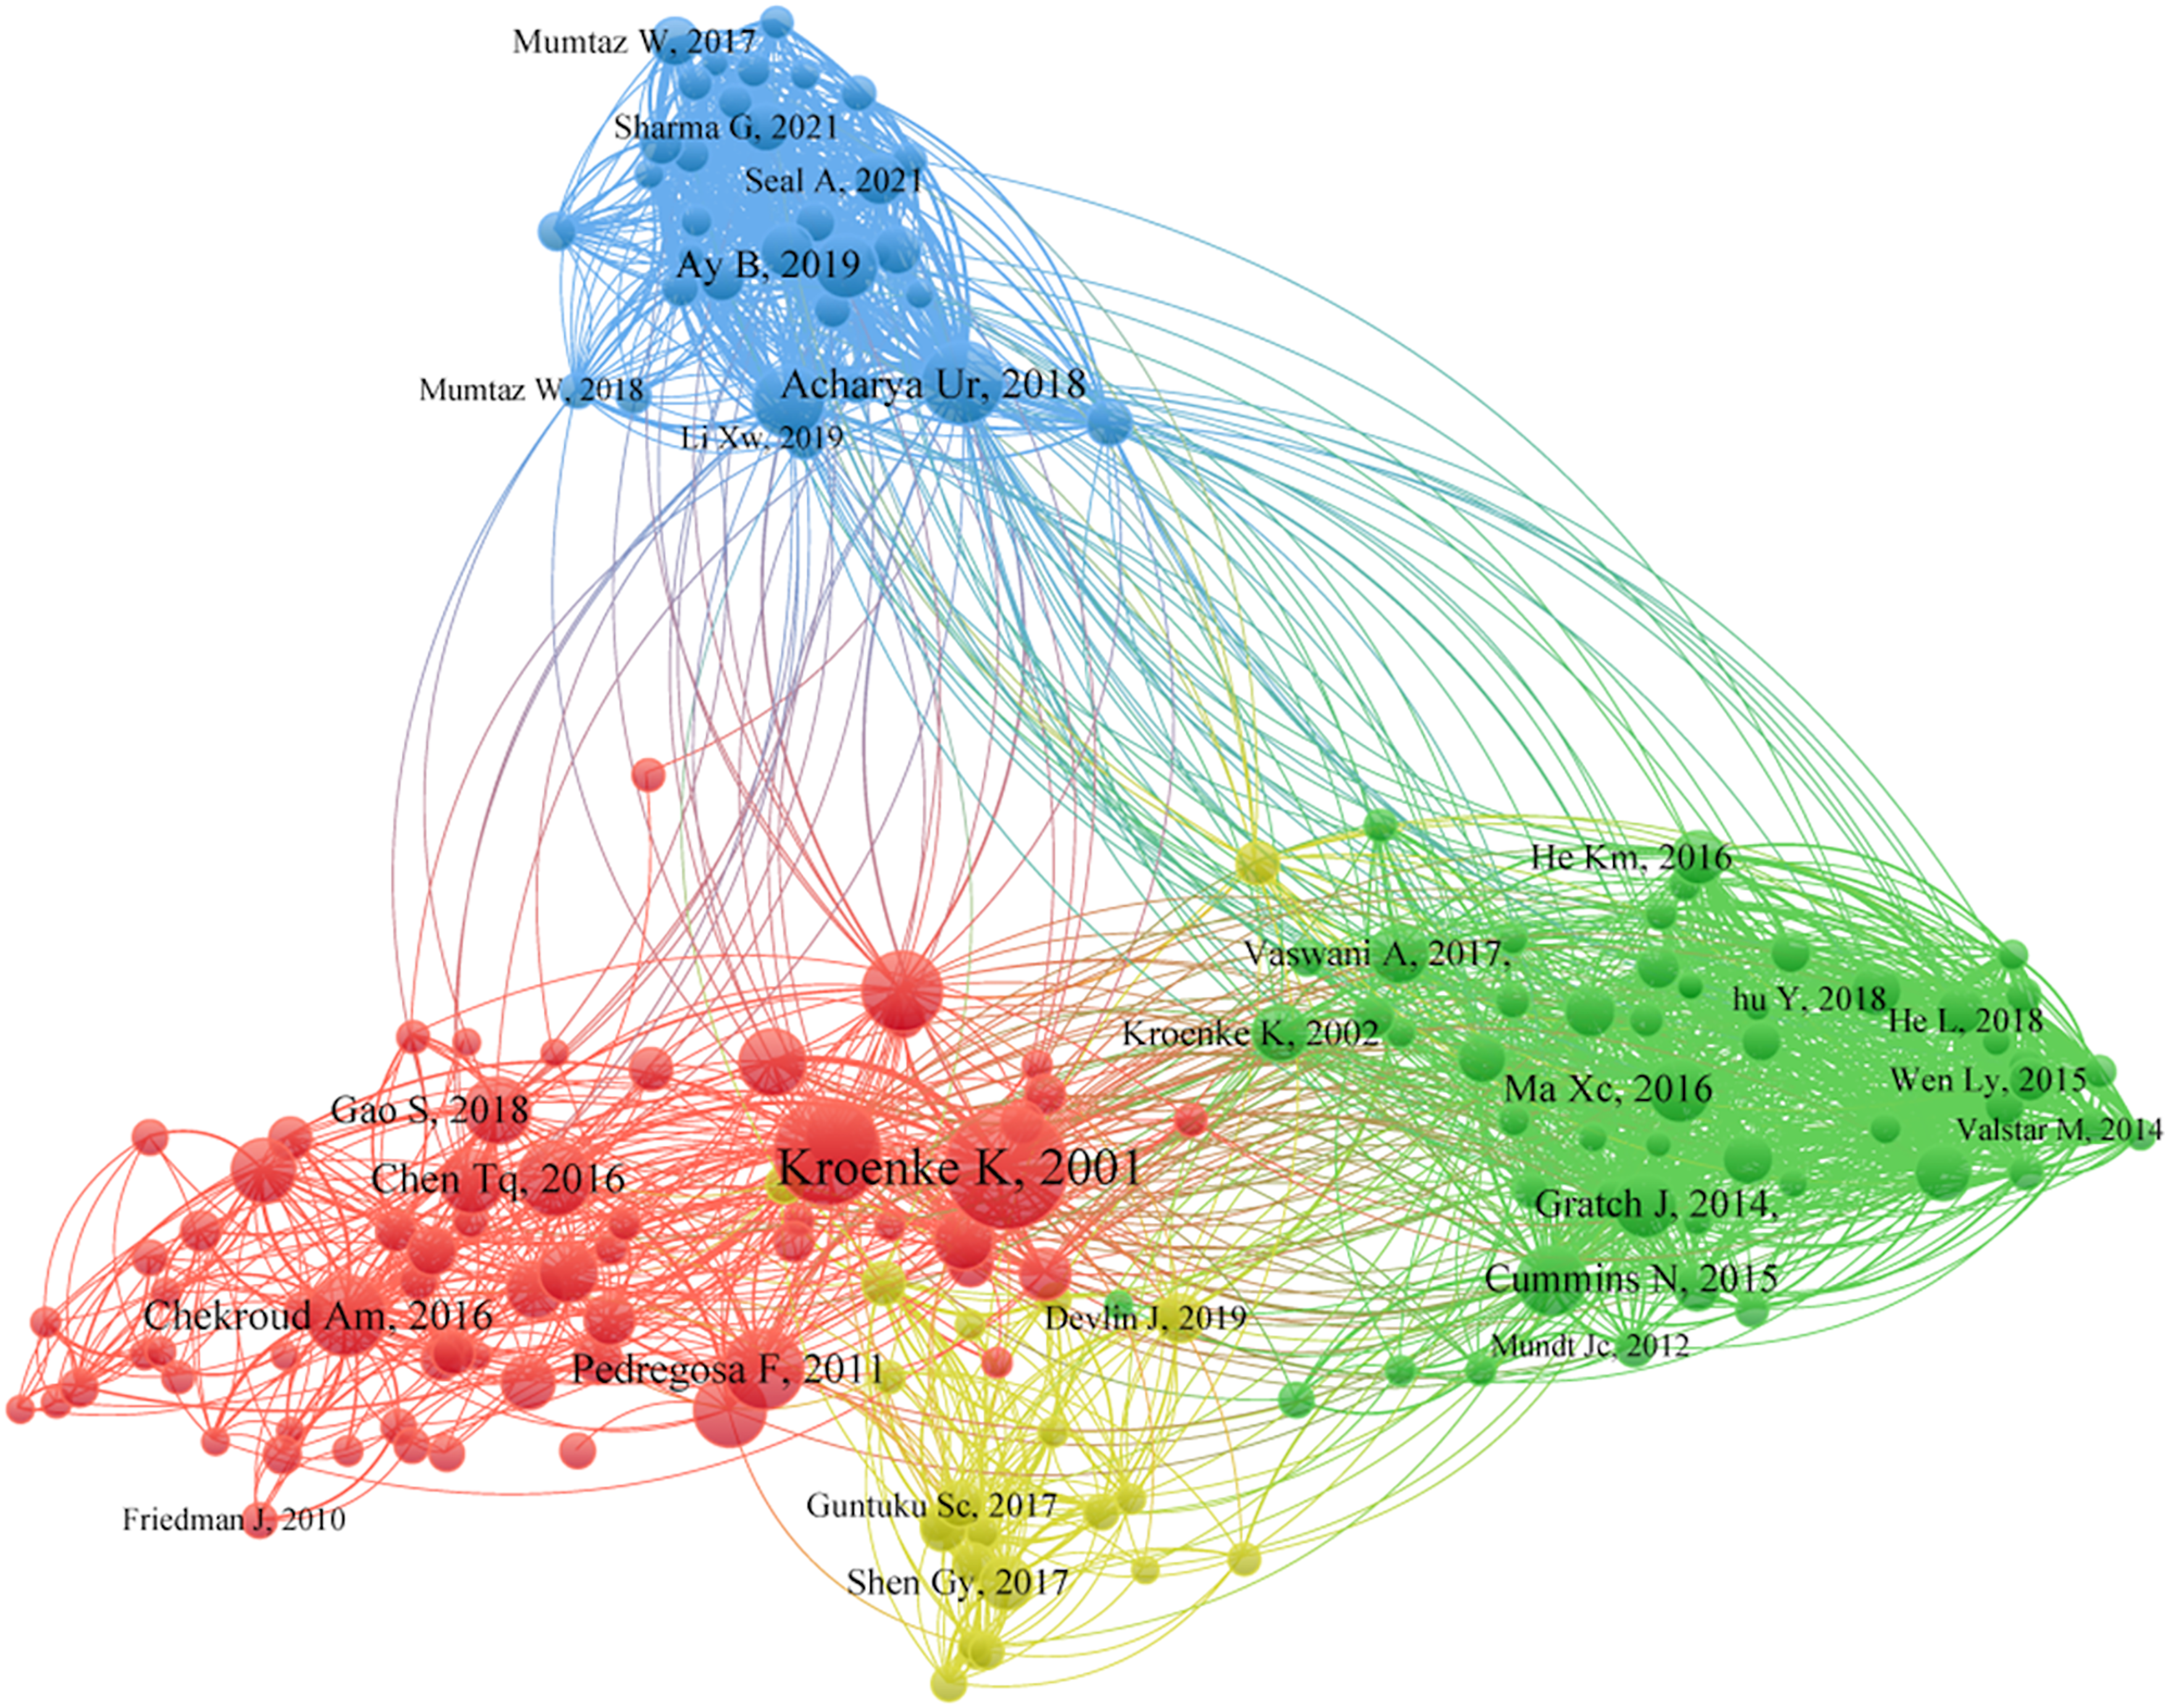
Network mapping of the top 10 cocited literature. The size of the dots represents the number of citations, the larger the node the more citations; the connecting line between the nodes indicates that there is a cocitation relationship between the two.
Top 10 cocited literature.

Keyword co-occurrence analysis
Analyzing keyword co-occurrence and clustering can reveal the research hotspots and trends in an academic field. By applying VOSviewer to generate the keyword co-occurrence map (Figure 9(a)), we observe that early research prominently featured terms such as “classification,” “major depressive disorder,” and “Biomarkers.” More recently, keywords such as “Depression,” “Machine Learning,” “Deep Learning,” “feature extraction,” “electroencephalography,” “social media,” “Convolutional Neural Networks,” and “Predictive Models” have become more frequent, indicating they may represent future research hotspots.
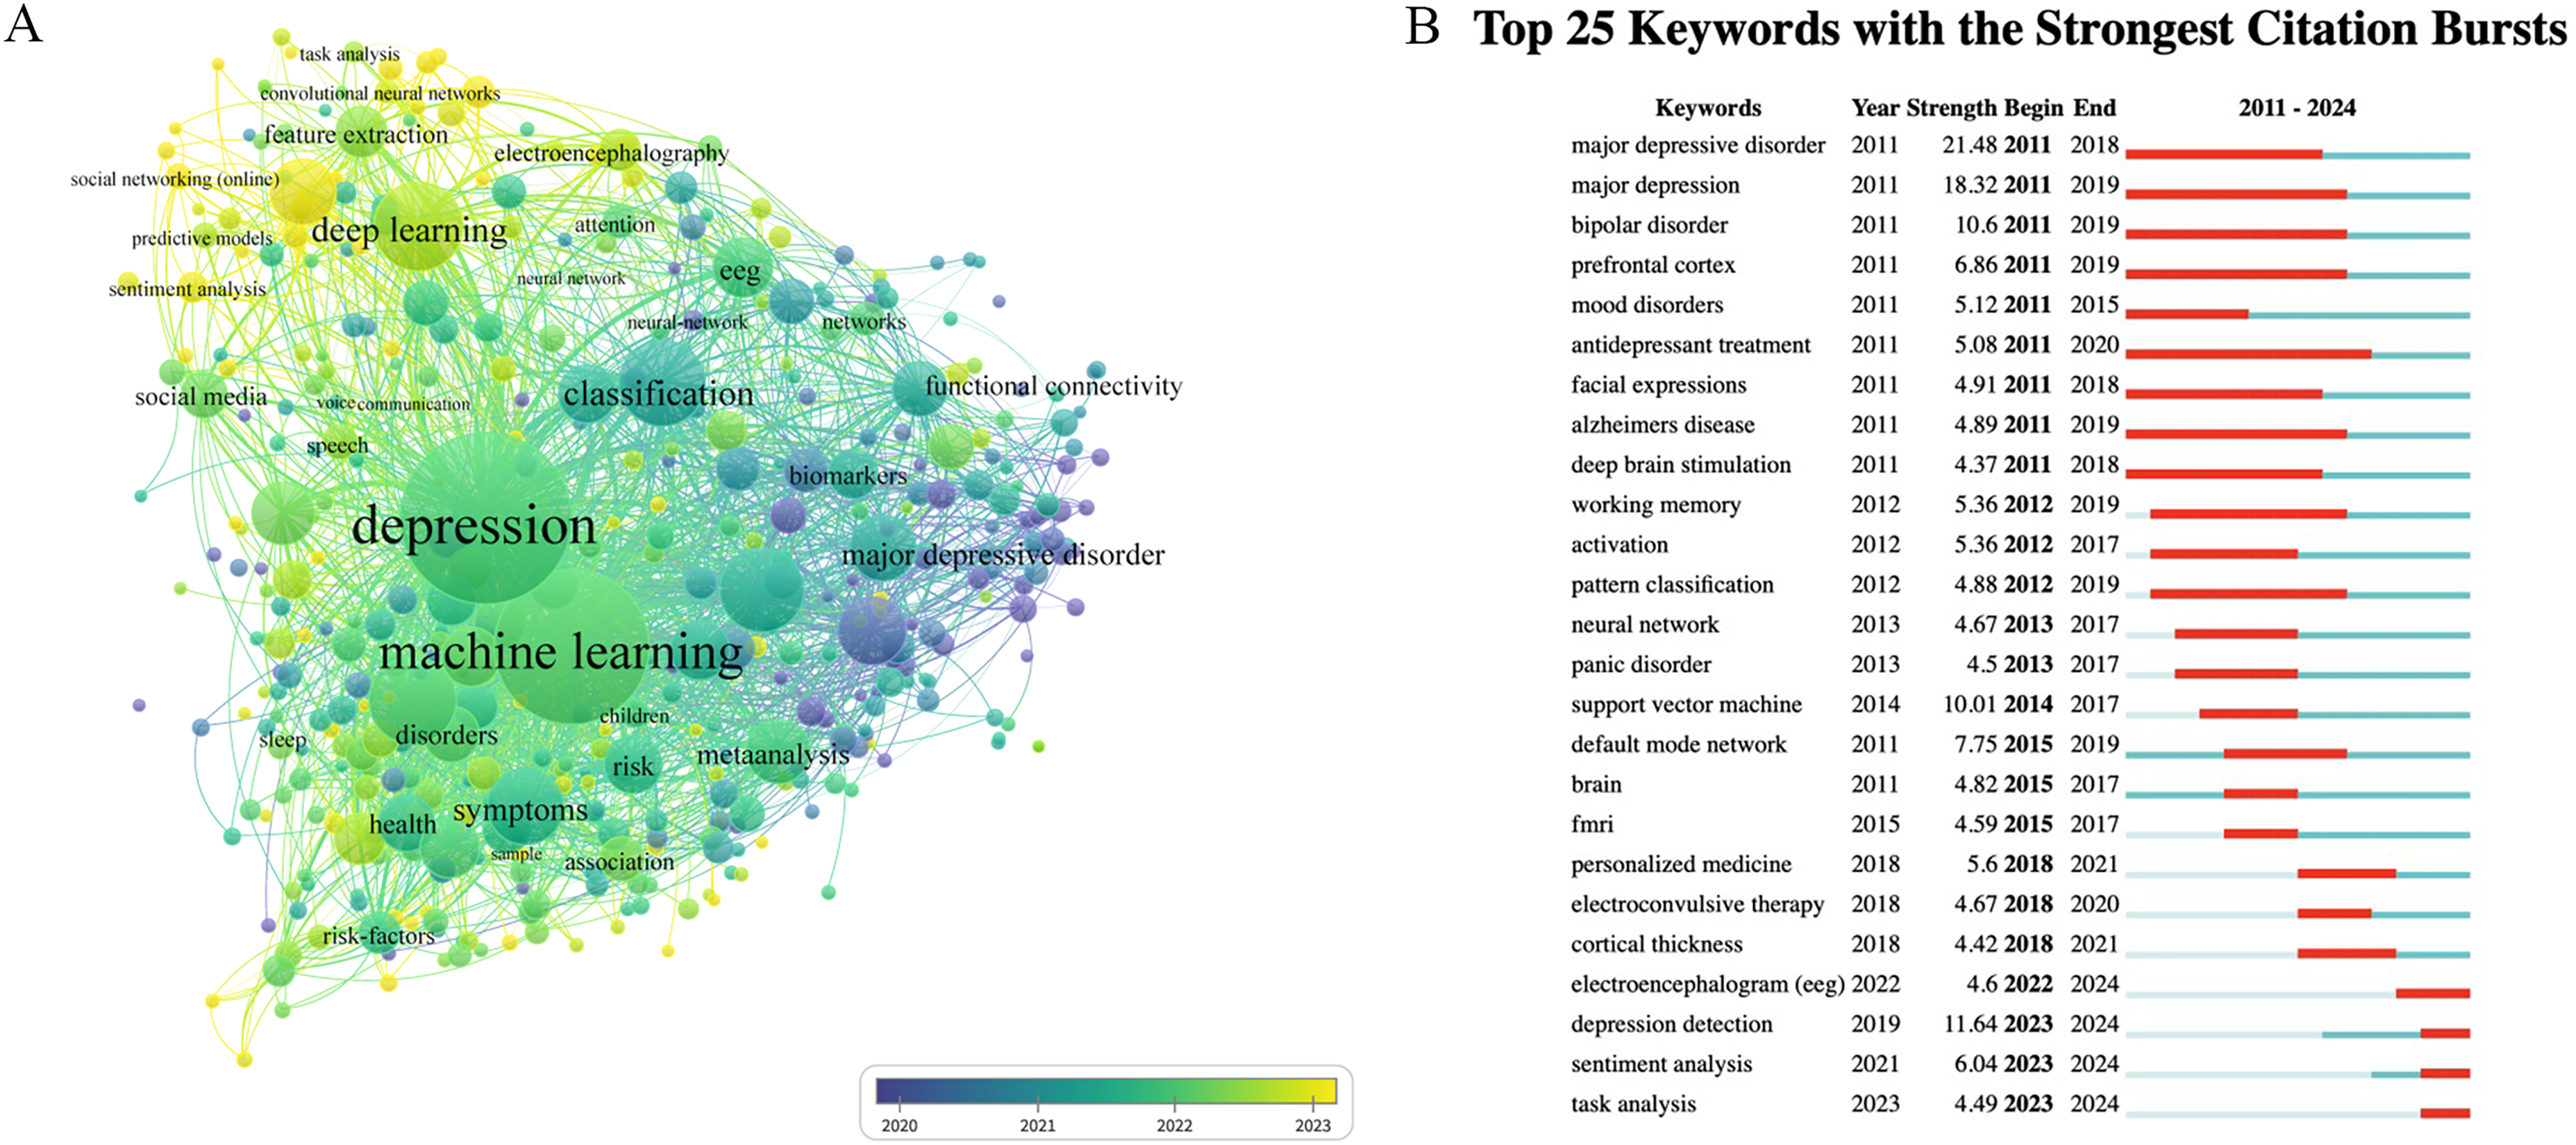
Co-occurrence analysis of keywords. (a) Keyword co-occurrence mapping for 2011–2024, where node size grows with increasing keyword frequency. (b) Top 25 keywords with the strongest citation bursts.
Keyword emergence analysis
Emergent keywords are those frequently cited in a period of time and can be used to explore the development trend of a field. CiteSpace was used to extract the top 25 most groundbreaking keywords, as shown in Figure 9(b). It is found that recent studies have concentrated on individualized medicine, depression detection, task analysis, and other aspects. The persistent emergence of keywords such as EEG, depression detection, emotion analysis, and task analysis indicates that at present, AI technology is being more extensively applied to depression prediction and diagnosis.
Discussion
In this study, CiteSpace and VOSviewer software were used to visualize and analyze the literature on AI in depression-related fields from the WoSCC. This approach presents the current research status, hotspots, and gaps in the field in an intuitive manner, offering valuable research methods and insights for researchers.
Growth and key contributors
Since 2011, the number of annual publications in the interdisciplinary field of AI and depression has shown sustained and rapid growth. Publications numbered fewer than 10 in 2011 but exceeded 300 by 2024. The growth rate increased notably after 2019, which may be attributed to several factors. First, AI technology advanced further in 2020 when OpenAI introduced CLIP, a contrastive learning model that pairs images with natural language text. This innovation enabled effective multimodal learning and laid the groundwork for multimodal AI research and applications, thereby advancing areas such as image generation, understanding, and interaction. 31 Second, the emergence of Transformer architectures and the widespread adoption of pretrained models have provided powerful tools for natural language processing in mental health text analysis. 32 Additionally, the COVID-19 pandemic profoundly affected global mental health, leading to a sharp rise in the incidence of depression and anxiety disorders. 5 By 2024, the application of AI in mental health had shifted from preliminary exploration to a phase of accelerated development.
Our study identified key contributors, such as Bin Hu from Lanzhou University, whose primary research focuses on affective and cognitive computing of mental multimodal information and wearable sensors. In his study, the classification accuracy of MDD was improved through an attention-based multimodal MRI fusion model. 33 They also indicated that facial expressions, speech signals, social media activity, EEG, and eye movement-based methods may serve as adjuncts to depression detection.34–37 Furthermore, our study found that the top 10 journals in terms of publications are predominantly located in Europe and the United States, with the Journal of Affective Disorders in the Netherlands being the most cited journal in this field. These findings highlight the significant scientific influence of Europe and the United States in the field of depression research.
Geographic distribution
In our analysis, China, the United States, and the United Kingdom occupy central positions in terms of publication output, academic influence, and international collaboration networks. China contributed 35.7% of the total publications, and its rapid growth aligns with the national strategy of Healthy China 2030, which emphasizes the promotion of mental health innovation, demonstrating a strong policy-driven stimulus to research productivity. 38 However, the United States exhibits a more prominent performance across comprehensive academic impact indicators: its total citations (9553), H-index (91), and average citations per paper (27.61) all rank first, reflecting its strong leadership in scientific research and robust support from institutions such as Harvard University, Stanford University, and the National Institutes of Health, particularly in AI and medical research. 39 The United Kingdom follows closely, also performing well in total citations and average citations per paper (17.49), confirming the sustained influence of traditional research powerhouses. Furthermore, international collaboration network analysis reveals that the United States maintains the most extensive international cooperation network (total link strength = 323) and shares the highest betweenness centrality (0.27) with the United Kingdom, highlighting its role as both a central hub and a key bridge in global knowledge exchange. Although China and India stand out in terms of publication volume, their relatively lower network centrality (both 0.14) suggests that their international collaborative influence and hub roles require further enhancement.
The highly uneven geographical distribution of research output presents both challenges and opportunities for global mental health equity. On the one hand, research dominance is concentrated in a limited number of resource-rich countries, which may result in technical approaches, data foundations (largely derived from high-income populations), and clinical validation standards in AI-based depression research that primarily reflect the needs and healthcare system characteristics of specific populations. This concentration increases the risk of “algorithmic bias,” whereby AI screening, diagnostic, or predictive tools developed in such contexts may lose validity and fairness when applied to low- and middle-income countries or to culturally and ethnically diverse populations, potentially exacerbating global mental health disparities. On the other hand, the leading roles of countries such as China and the United States also imply a heightened responsibility to steer the field toward greater inclusivity and equity. Based on the foregoing analysis, we propose the following recommendations: (1) encourage research teams from high-output countries to take the lead in establishing open and collaborative international research platforms, jointly designing research protocols, sharing analytical methods, and collaborating on model calibration and validation in local contexts; (2) integrate fairness considerations at the research design stage by actively collecting and utilizing diverse, multicenter datasets for model training and evaluation, publicly reporting model performance differences across subgroups (e.g., gender, race, and socioeconomic status), and developing technical strategies to mitigate bias; and (3) systematically strengthen the research capacity of scientists worldwideiparticularly those from low- and middle-income countries—in AI and mental health through international training programs, joint laboratories, open-source tool platforms, and related initiatives.
Core research hotspots
The co-occurrence analysis of keywords and the analysis of cited literature indicate that machine learning, deep learning, and convolutional neural networks (CNNs) are current research hotspots in the field. They are primarily employed for depression diagnosis, prediction, and classification, with remarkable results achieved. Samuel Banerjee et al. 40 predicted the severity of depression and identified risk factors for its deterioration using machine learning methods. Zhou et al. 41 applied machine learning to develop a model that predicts the neuroimaging features of anxiety in depressed patients. Additionally, machine learning and deep learning algorithms have proven effective in identifying and predicting suicide risk in depressed patients.42,43 In recent years, some researchers have employed deep CNNs to analyze the EEG data, aiding in the automatic prediction of depression states by capturing discriminative features in motor activity, thus improving prediction accuracy.44,45 In conclusion, AI holds great potential for both diagnosis and prediction in the field of depression.
Research trends
Electroencephalogram signals
In the current study, our findings suggested that EEG signals, social media, feature extraction, and task analysis may represent emerging trends for future development. These trends indicated that researchers were increasingly focused on developing more precise and efficient diagnostic tools, aimed at enabling earlier identification and intervention for depression.
In recent years, noninvasive brain imaging techniques have become increasingly sophisticated, with methods such as fMRI and EEG being widely used in neurological and psychiatric research.46,47 Resting-state fMRI (rs-fMRI) provides further insights into the abnormalities in the brains of depressed patients from a neurodynamic perspective. 48 Zhang et al. 49 constructed supervised-learning predictive models for depression in young adults by integrating machine learning techniques and longitudinal data from the Beck Depression Inventory and structural MRI (sMRI) and rs-fMRI. The optimal model yielded an accuracy of 0.85 and an AUC of 0.80, providing empirical support for integrating sMRI and rs-fMRI features with ML in the preclinical detection of depression. Electroencephalography can detect and record the weak electrical signals generated on the scalp when neurons fire, using electrodes placed on the scalp.50,51 These electrical signals are typically represented as sinusoidal waves, demonstrating different frequency rhythms in the brain. 52 Additionally, EEG can identify potential brain biomarkers in depression and predict factors contributing to its development.53,54 For example, Zhu et al. 55 investigated changes in EEG oscillatory brain networks during music listening, using a method based on spatially independent component analysis, which focused on the differences between healthy subjects and depressed patients. A previous study introduced a deep learning method for prescreening depression by converting asymmetric features of the EEG into a matrix image, which was then input into CNNs, achieving an accuracy of 98.85%. 56 Some researchers also combined machine learning with EEG and further improved the classification performance of a support vector machine using conformal kernel transformations, achieving an accuracy of 91.07% in the training set and 84.16% in the test set. 57 A recent study indicated that EEG-driven fMRI disclosed distinct correlates for separate cognitive processing steps, N2 and P3, highlighting differences between MDD and healthy controls. 58 In conclusion, integrating EEG with state-of-the-art AI frameworks offers an valuable way to elucidate complex cognitive processes and holds considerable promise for advancing precision diagnostics and personalized therapeutic strategies in depression.
Social media and feature extraction
In recent years, research on predicting depression through social media has gradually become a hotspot at the intersection of mental health and computer science. Increasing numbers of people share texts, emoticons, pictures, videos, likes, and other behavioral signals related to their emotions on various social media platforms. Researchers can extract features characterizing depression, such as voice signals, facial expressions, text features, and behavioral signals, using feature extraction algorithms to construct depression recognition models for predicting depression. 59
Depression detection
With the advancement of AI algorithms, particularly deep learning networks such as CNNs, long short-term memory, deep CNNs, and deep residual regression CNNs, 60 the accuracy of depression prediction has significantly improved. Lyu et al. 61 built a plain-text social media prediction model and demonstrated that words related to cultural–psychological factors and suicide risk correlate with depression, helping to predict depressive states through text features. Liu et al. 62 examined the relationship between text message language and depression severity, revealing that the degree of depression, mood, and the use of personal pronouns strongly correlate with self-reported depression, with first-person singular pronouns serving as a strong linguistic marker of depression and negative affect. Gilanie et al. 63 proposed a multimodal depression detection system based on CNNs and Support Vector Machines, improving depression detection accuracy by extracting microexpressions related to sadness, disgust, and contempt using the Facial Action Coding System. Despite significant improvements in research on the assisted diagnosis and treatment of depression, prediction results can be biased if data are not extracted in a standardized manner or if the sample size is too small, as AI algorithms rely on large datasets for training and learning. 64 In conclusion, future studies need to collect more multimodal databases, including images, text, audio, video, physiological signals, and other information, to further optimize the performance of algorithms and promote the application and development of AI in depression diagnosis and treatment.
Limitations
This study has several limitations that should be considered when interpreting its findings. First, the literature search was limited to the WoSCC, which, despite its extensive coverage and strong academic reputation, may not include all relevant publications. This limitation may introduce database-related selection bias and result in a smaller sample size than would be obtained through a multidatabase search. Second, only English-language articles and reviews were included, potentially leading to language bias. Important studies published in other languages may therefore have been excluded, which could reduce the comprehensiveness of the analysis and affect the generalizability of the findings. Third, the search strategy may not have identified all relevant studies due to limitations in keyword selection or incomplete coverage of related thematic areas, further contributing to potential omissions in the literature sample. Finally, as a bibliometric analysis, this study is inherently affected by the timeliness of citation data. Recently published high-quality studies may have accumulated fewer citations, creating a lag in the identification of emerging research trends. Consequently, periodic updates to the analysis will be necessary to ensure continued relevance in a rapidly evolving research landscape.
Conclusion
Our findings revealed a steady increase in research on the application of AI in the field of depression. The analysis indicated that AI models based on machine learning and deep learning are gaining widespread adoption in depression research. However, issues such as the development of multimodal databases, the accuracy of AI models in depression detection, and the validation of their clinical utility require further attention. Therefore, we recommend that future research should prioritize improvements in AI algorithms, clinical validation of AI models, and the enhancement of multimodal databases for depression.
Supplemental Material
sj-docx-1-dhj-10.1177_20552076261427866 - Supplemental material for Global research landscape and emerging trends in the application of artificial intelligence in depression: A bibliometric analysis
Supplemental material, sj-docx-1-dhj-10.1177_20552076261427866 for Global research landscape and emerging trends in the application of artificial intelligence in depression: A bibliometric analysis by Yanyan Tian, Shumin Wang, Guiyan Li, Jie Deng, Dongdong Yang and Yu Fang in DIGITAL HEALTH
Footnotes
Acknowledgements
The authors thank all authors who participated in the study.
Ethical approval
The study was exempted from institutional ethics review because only publicly available data were analyzed.
Contributorship
Study design: FY, DDY; data collection, analysis, and interpretation: YYT, SMW; drafting the manuscript: YYT; critical revision of the manuscript: GYL, DJ. All authors contributed to the article and approved the submitted version. FYand DDY are co corresponding authors.
Funding
The authors disclosed receipt of the following financial support for the research, authorship, and/or publication of this article: The work was supported by the Natural Science Foundation of Sichuan Province (2024NSFSC1824).
Declaration of conflicting interests
The authors declared no potential conflicts of interest with respect to the research, authorship, and/or publication of this article.
Data availability statement
Data are available on reasonable request.
Guarantor
DDY and YF, the corresponding author, serves as the guarantor of this work.
Supplemental material
Supplemental material for this article is available online.
References
Supplementary Material
Please find the following supplemental material available below.
For Open Access articles published under a Creative Commons License, all supplemental material carries the same license as the article it is associated with.
For non-Open Access articles published, all supplemental material carries a non-exclusive license, and permission requests for re-use of supplemental material or any part of supplemental material shall be sent directly to the copyright owner as specified in the copyright notice associated with the article.