
Abstract
Objective
To develop and validate machine learning models to predict osteoporosis risk in chronic kidney disease (CKD) patients.
Methods
Data from the National Health and Nutrition Examination Survey (2005–2010, 2013–2014, 2017–2018) included 50,463 participants. Separate models for male and female CKD patients were developed using 59 potential predictors, with key variables selected through the Least Absolute Shrinkage and Selection Operator and Boruta algorithms. Seven single-base models, including logistic regression, support vector machine, extreme gradient boosting, K-nearest neighbors, gradient boosting decision tree, random forest (RF), and neural network, were trained. Additionally, stacking ensemble models were constructed. Model performance was evaluated using receiver operating characteristic curves, F1 scores, Matthews correlation coefficient, and Brier scores. The best models were externally validated and visualized for interpretability.
Results
Among 3796 CKD patients, osteoporosis prevalence was 12.54% (7.28% in males and 17.57% in females). RF models demonstrated superior performance in each gender. The male RF model achieved an area under the curve of 0.845 in testing set and 0.728 in the external validation set, while the female RF model achieved and 0.859 and 0.812, respectively. Shapley additive explanations values summary plots showed that the top five important features for the male RF model were weight, age, height, Non-Hispanic Black ethnicity, and estimated glomerular filtration rate. For the female RF model, the top five important features were weight, use of female hormone medications, age, Non-Hispanic Black ethnicity, and red blood cell. Online calculators were constructed to facilitate the clinical practical application.
Conclusions
The RF model in female CKD patients demonstrated strong predictive performance for osteoporosis, while models for males were less effective.
Introduction
Chronic kidney disease-mineral and bone disorder (CKD-MBD) is a major complication of CKD, more than doubling the risk of fragility fractures compared to the general population. While fragility fractures are well-established predictors of mortality in the general population, their prognostic significance in CKD patients may be underestimated. 1 The diagnosis of CKD-MBD remains inadequate. Although bone biopsy is the gold standard, its invasiveness limits widespread use. However, the inability to perform a biopsy should not delay early intervention in high-risk patients.
The application of dual-energy X-ray absorptiometry (DEXA) in CKD patients remains controversial. The study had demonstrated that bone mineral density (BMD) measured by DEXA can predict fractures of any type in women with low parathyroid hormone levels. 2 The 2017 Clinical Practice Guidelines from Kidney Disease: Improving Global Outcomes recommend BMD testing to assess fracture risk if the results influence treatment decisions in CKD patients at stages G3a–G5D with evidence of CKD-MBD and/or osteoporosis risk factors (2B). 3 However, concerns such as over-screening, radiation exposure, and high costs highlight the need for more accessible and cost-effective screening tools. The Fracture Risk Assessment Tool (FRAX), widely used for fracture risk prediction in the general population, has also shown predictive value in CKD patients,4,5 supporting the role of predictive models in disease diagnosis and risk stratification.
Machine learning is an advanced analytical approach capable of capturing complex, non-linear interactions within large datasets, making it particularly suited for diseases with multifactorial pathophysiology. 6 Additionally, machine learning enables the automated identification and prioritization of key variables. Yang et al. developed a machine learning-based preclinical osteoporosis screening tool with high predictive accuracy in the Hong Kong Chinese population. 7 Compared to the general population, CKD patients exhibit a more complex pathophysiology and a wider spectrum of risk factors for osteoporosis. Our study aims to develop and validate a predictive model for osteoporosis in CKD patients using routine clinical parameters from CKD follow-up assessments, without relying on medical imaging. The model will integrate both conventional osteoporosis risk factors and CKD-specific variables, such as serum creatinine, estimated glomerular filtration rate (eGFR), dialysis status, parathyroid hormone levels, and vitamin D, which are not currently included in the FRAX tool. This approach would facilitate early identification of high-risk individuals, enabling timely interventions in both clinical and community healthcare settings.
Materials and methods
Data sources
The data were obtained from the publicly accessible National Health and Nutrition Examination Survey (NHANES) (https://wwwn.cdc.gov/nchs/nhanes/Default.aspx), a project by the National Center for Health Statistics (NCHS) providing nationally representative data on the U.S. population. Approved by the NCHS Institutional Review Board, all participants provided written informed consent. As this study is a secondary analysis, it is exempt from ethical review.
Sample selection and datasets construction
Data were obtained from the NHANES across three cycles: 2005–2010, 2013–2014, and 2017–2018, comprising a total of 50,463 participants. Individuals were included if they met the diagnostic criteria for CKD, defined as either (1) an eGFR < 60 mL/min/1.73 m², calculated using the CKD Epidemiology Collaboration equation 8 ; or (2) a urine albumin-to-creatinine ratio (UACR) ≥ 30 mg/g. Data from the 2005–2010 and 2013–2014 survey cycles were used to construct the cohort, which was then divided into a training set and an internal validation set in an 80:20 ratio. The training set was utilized to identify osteoporosis risk factors and develop the prediction model. The 2017–2018 NHANES cycle was used as the external validation set. As each NHANES cycle comprises a distinct, independently sampled population, there is no participant overlap between cycles. This ensures the external validation dataset is entirely independent from the earlier cycles, providing a robust basis for model evaluation. Participants were excluded if they lacked CKD or had missing osteoporosis-related diagnostic information, and only adults aged 20 years or older were included.
Diagnosis of osteoporosis
Osteoporosis in this study was diagnosed based on BMD measurements obtained via DEXA (HOLOGIC Discovery A, U.S.). BMD was measured at the total femur, femoral neck, and vertebrae, and the lowest T-score among these three sites was used to define osteoporosis. The T-score was calculated as the participant's BMD minus the mean BMD of the reference group, divided by the standard deviation (SD). In accordance with World Health Organization criteria, postmenopausal women (≥ 50 years) and men aged ≥ 50 years were classified as having osteoporosis if their T-score was ≤ -2.5. For premenopausal women (< 50 years) and men aged < 50 years, osteoporosis was diagnosed based on ethnicity-specific Z-scores, as recommended by the International Society for Clinical Densitometry, with a Z-score ≤ -2.0. The reference group comprised non-Hispanic white individuals aged 20–29 years from NHANES.9−11
Candidate predictors
We conducted a comprehensive literature review to identify common clinical indicators as candidate predictors, categorizing them into five groups: demographic data, clinical examination data, laboratory test results, dietary data, and questionnaire information. Demographic data included variables such as age, gender, race, education, marital status, and poverty-income ratio. Clinical examination data included DEXA measurements, height, weight, body mass index (BMI), waist circumference, hand grip strength, and arm muscle circumference. Laboratory test data included serum creatinine, blood urea nitrogen, UACR, serum uric acid, albumin, fasting blood glucose, hemoglobin A1c (HbA1c), total cholesterol, triglycerides, low-density lipoprotein (LDL), high-density lipoprotein, alkaline phosphatase, lactate dehydrogenase, alanine transaminase, aspartate aminotransferase, serum iron, serum calcium, serum phosphorus, red blood cell count, hemoglobin, red blood cell distribution width, white blood cell count, platelet count, monocyte count, lymphocyte count, parathyroid hormone, serum folate, 25-hydroxyvitamin D (25(OH)D3), and estradiol levels. Dietary data included calcium intake and total saturated fatty acids intake. Questionnaire information included smoking status, alcohol consumption, hypertension, diabetes, thyroid disease, coronary heart disease, CKD, osteoporosis, arthritis, cancer, dialysis, fracture, family history of osteoporosis (FHOS), menstrual history, medication use, physical activity, and previous year weight change. Alcohol consumption was defined as >12 alcoholic beverages in the past 12 months. Current smokers were defined as individuals who have smoked more than 100 cigarettes in their lifetime and currently smoke daily or occasionally. FHOS referred specifically to a parent being diagnosed with osteoporosis. Diabetes was defined by self-report, HbA1c ≥ 6.5%, or fasting blood glucose ≥ 7.0 mmol/L. Hypertension was diagnosed by self-report or systolic blood pressure ≥ 130 mmHg and/or diastolic blood pressure ≥ 80 mmHg.
Statistical analysis
Data preprocessing
Due to missing data, preprocessing was performed to ensure data quality and minimize bias. Values of “7,” “9,” “77,” and “99” were assigned as “NA,” and variables with over 30% missing data were removed. For variables with less than 30% missing data, multiple imputation was performed using the mice package in R.12,13 After imputation, summary statistics were calculated. Normally distributed continuous variables were presented as means ± SD and compared using t-tests, while non-normally distributed continuous variables were presented as medians (interquartile ranges) and compared using non-parametric tests. Categorical variables were expressed as n (%) and compared using chi-squared tests. One-hot encoding was applied to categorical variables, and continuous variables were standardized using Z-scores. This standardization step was critical for optimizing the performance of distance-based models. To account for gender differences in osteoporosis prevalence, male and female CKD patients were analyzed separately. We applied the Adaptive Synthetic Sampling (ADASYN) algorithm (K = 5) in the training set to improve class balance.
Feature selection
Feature selection was performed to identify key predictors of osteoporosis in CKD patients, reduce dimensionality, and prevent overfitting. To enhance robustness, we integrated two methods: the Least Absolute Shrinkage and Selection Operator (LASSO) regression and the Boruta algorithm. LASSO regression uses L1 regularization, which applies a series of adjustment parameters and cross-validation. This approach facilitates feature selection, model simplification, and the identification of optimal variables. The Boruta algorithm iteratively compares the importance of original features with shadow features using a random forest (RF) classifier, marking features as “confirmed” if their importance consistently exceeds the best shadow feature. This method effectively captures the importance of non-linear and complex variable relationships, thereby compensating for the limitations of LASSO. To ensure conservative feature selection and reduce overfitting, only predictors selected by both LASSO and Boruta were retained. Features identified by only one method were excluded. Feature selection was restricted to the training set to ensure unbiased evaluation. Collinearity was assessed using the Spearman's rank correlation coefficients or point biserial correlation coefficients, and the Boruta algorithm was used to prioritize correlated features. 14 In addition, multicollinearity was evaluated using the variance inflation factor (VIF) and the absence of multicollinearity was confirmed when the VIF was < 5 to 10. 15
Model construction and evaluation
Machine learning methods are commonly classified into supervised, unsupervised, semi-supervised, and reinforcement learning. This study used seven supervised learning algorithms, including logistic regression (LR), support vector machine, extreme gradient boosting (XGBoost), K-nearest neighbors (KNN), gradient boosting decision tree, RF, and neural network, all validated for medical diagnostics. Additionally, we developed stacking ensemble models comprising three base classifiers and a meta-classifier. The base layer comprised XGBoost, RF, and KNN, selected for their complementary strengths in handling complex medical data. The meta-classifier, implemented as a LR model, combines the predictions from the base models to produce the final classification. Hyperparameter optimization was performed using grid search combined with 5 × 5 repeated cross-validation for model training. Model predictive performance was evaluated using the receiver operating characteristic (ROC) curve, with a larger area under the curve (AUC) indicating better discriminative ability. To address the class imbalance in the dataset, additional metrics were employed, including accuracy, precision, sensitivity, specificity, F1-score, Kappa, and Matthews correlation coefficient (MCC), with values closer to 1 indicating better model performance. The Brier score was used to evaluate the accuracy of probabilistic predictions, defined as the mean squared error between predicted probabilities and observed outcomes, with lower scores reflecting superior model calibration. External validation was conducted using AUC, calibration curves, and decision curve analysis (DCA) to evaluate discriminative ability, accuracy, and clinical utility. The model was deemed successfully constructed if it performed consistently across three external validations. Shapley additive explanations (SHAP) analysis was used to assess feature importance for model interpretability. An online calculator was developed using the “Shiny” package. All analyses were performed using IBM SPSS Statistics (version 26.0) and R (version 4.4.0). A two-sided p-value < 0.05 was considered statistically significant.
Results
Participant characteristics
A total of 3796 CKD patients were included in the study based on predefined inclusion and exclusion criteria. The sample selection process is shown in Figure 1, and detailed cohort characteristics are provided in Table S1. The overall prevalence of osteoporosis was 12.54%, with 7.28% in male patients and 17.57% in female patients. Considering the significant differences in osteoporosis prevalence and physiological characteristics between sexes, all machine learning analyses were conducted separately for male and female patients. Variables with more than 30% missing data, including LDL, fasting plasma glucose, handgrip strength, estradiol levels, and parathyroid hormone, were excluded from further analysis. For the remaining variables, missing values were addressed using multiple imputation. The specific variables and their corresponding missing data proportions are summarized in Table S1. Comparative analyses revealed no significant differences between the raw and imputed datasets, suggesting that the imputation process adequately preserved the data structure and reduced bias. Gender-specific datasets were divided into training, internal validation, and external validation subsets. The external validation set exhibited significant differences in age, race, education, and several laboratory parameters compared to the training and internal validation sets, making it particularly suitable for validating the predictive models (Table S2).

Selection flowchart of study participants. CKD: chronic kidney disease; NHANES: National Health and Nutrition Examination Survey.
Feature selection
LASSO LR and the Boruta algorithm were applied to the training set to identify key predictors (Figure S1). Only variables identified by both methods were retained for model development. Spearman's rank correlation coefficients and point biserial correlation coefficients exceeding 0.7 indicated collinearity among these variables (Figure S1). To ensure model interpretability, less relevant variables were excluded from the analysis. Ultimately, five features were identified as significant predictors of osteoporosis in male CKD patients: weight, age, eGFR, height, and Non-Hispanic Black ethnicity. In female patients, seven predictors were retained: weight, age, height, serum creatinine, use of female hormone medications, red blood cell, and Non-Hispanic Black ethnicity. VIFs were calculated for all variables in the LR models, with all values below 5, indicating no significant multicollinearity.
Model development and comparison
Table S3 summarizes the optimized hyperparameters for each algorithm, tuned separately for the male and female cohorts. Internal validation results are presented in Table 1. Among all models, the RF model demonstrated superior performance in both male and female CKD patients, achieving AUC values of 0.845 and 0.859, respectively (Figure S2 and S3). To further improve predictive performance, we applied a stacking ensembles algorithm to combine the predictions of individual models. However, the stack-based ensemble models achieved AUCs of 0.824 for males and 0.855 for females, showing no significant improvement over the best individual models. After a comprehensive evaluation of additional performance metrics, particularly the F1 score and MCC, the RF model was ultimately selected as the optimal model for predicting osteoporosis in both sexes.
Performance of each model in the internal validation dataset.

LR: logistic regression; RF: random forest; GBDT: gradient boosting decision tree; SVM: support vector machine; NN: neural network; KNN: K-nearest neighbors; XGBoost, extreme gradient boosting; AUC: area under the curve; CI: confidence interval; MCC: Matthews correlation coefficient.
External validation of predictive models
To ensure the generalizability of the predictive model, the best-performing models were validated on external validation dataset from the NHANES 2017-2018 cycle. In male patients, the RF model achieved an AUC of 0.728 (Figure 2A), with a Brier score of 0.163. Decomposition of the Brier score yielded a reliability of 0.091, resolution of 0.005, and uncertainty of 0.068. In female patients, the RF model demonstrated better discriminative performance, achieving an AUC of 0.812 (Figure 2D), with a Brier score of 0.221, and corresponding reliability, resolution, and uncertainty values of 0.104, 0.034, and 0.153, respectively. Although the external validation cohort differed from the training dataset in baseline characteristics and laboratory parameters (Table S2), the calibration curves (Figures 2B, 2E) indicated a decline in calibration performance in the external dataset. The DCA demonstrated that, within threshold probability ranges of 0.1–0.2 for males and 0.2–0.5 for females, the predictive models offered a net clinical benefit compared to the default “treat all” and “treat none” strategies (Figure 2C, 2F). The broader threshold range observed in females further supports the model's greater clinical utility in this subgroup. Overall, the results indicate that the predictive model for female patients exhibited superior performance compared to the male model.

External validation for predictive models. (A) ROC curve for RF models in male patients. (B) Calibration curves for RF models in male patients. (C) Decision curve analysis curves for RF models in male patients. (D) ROC curve for RF models in female patients. (E) Calibration curves for RF models in female patients. (F) Decision curve analysis curves for RF models in female patients. RF: random forest; AUC: area under the curve; ROC: receiver operating characteristic; CI: confidence interval.
Model interpretability and visualization
To effectively convey the clinical significance of key features, we quantified their contributions using SHAP values. Figure 3A and 3B displays the SHAP summary plot for the selected model, illustrating the influence of various factors, which ranked by their mean absolute SHAP values. According to the feature importance ranking, the variables for male CKD patients, in order of importance, were weight, age, height, Non-Hispanic Black ethnicity, and eGFR. For female patients, the variables were weight, use of female hormone medications, age, Non-Hispanic Black ethnicity, red blood cell, height, and serum creatinine. We also constructed online web calculators in order to facilitate the use of the model (Figure 3C and 3D, https://osteoporosis.shinyapps.io/male_ckd_app/ and https://osteoporosis.shinyapps.io/female_ckd_app/).
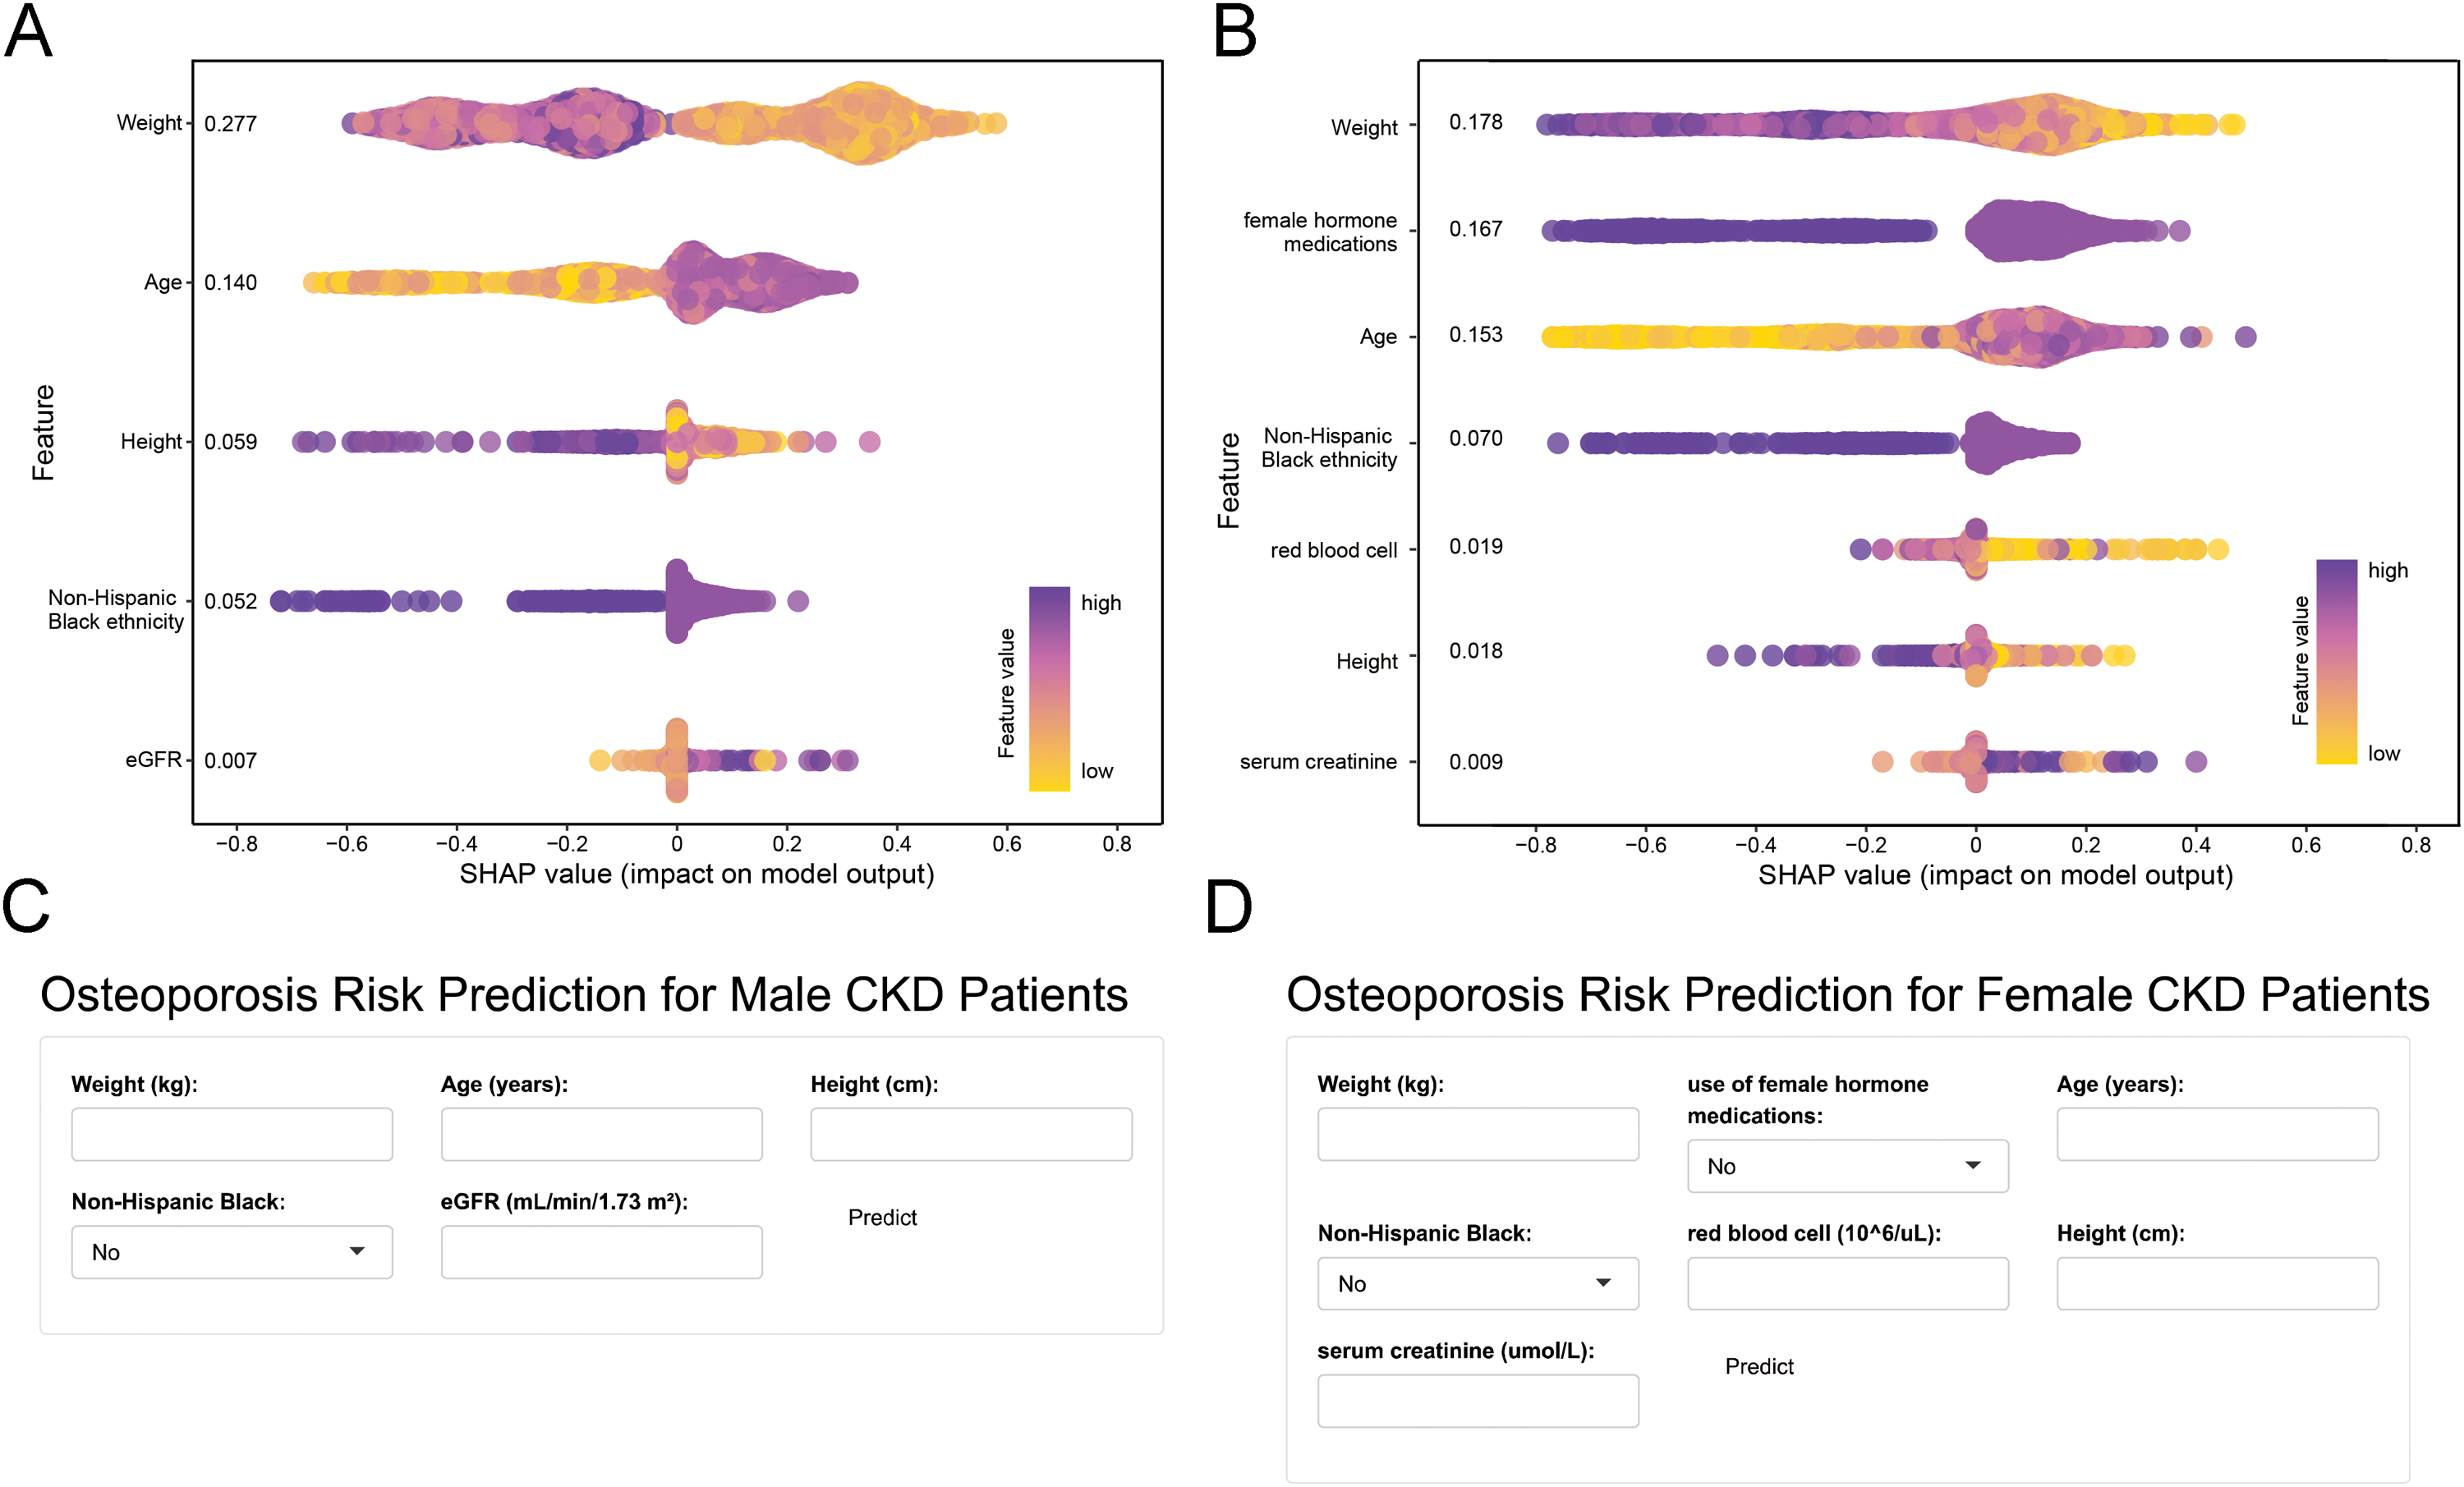
The SHAP summary plot for the important features and online network calculators. (A) The RF model for male CKD patients. (B) The RF model for female CKD patients. (C) RF model constructs an online network calculator to predict the risk of osteoporosis in male CKD patients. (D) RF model constructs an online network calculator to predict the risk of osteoporosis in female CKD patients. The horizontal position indicates whether the impact of the value is associated with a higher (purple) or lower (yellow) prediction. The vertical coordinates show the importance of the features, sorted by the importance of the variables in descending order, with the upper variables being more important to the model. RF: random forest; SHAP: Shapley additive explanations; CKD: chronic kidney disease.
Discussion
In this study, we employed machine learning combined with interpretable workflows to develop predictive models for osteoporosis in CKD patients. Acknowledging the pathophysiological differences in osteoporosis between male and female patients, we analyzed them separately. The results showed that the RF model achieved an AUC of 0.845 for male patients, while RF model for female patients achieved an AUC of 0.859. External validation further indicated that the performance of the model for female patients was significantly better than that for male patients. Despite the modest predictive performance in the male cohort, the model's results are still considered acceptable due to the practical and cost-effective nature of the predictive factors. We believe these predictive models can assist in identifying high-risk individuals. These models could be particularly valuable in community settings or regions where DEXA is not available.
Although traditional osteoporosis screening tools have been validated in the general population, few are designed specifically for CKD patients, who face a significantly higher prevalence of osteoporosis.4,16−21 This increased risk is mainly attributed to advanced age, postmenopausal status, and the accumulation of uremic toxins. The FRAX tool estimates fracture risk using variables including age, sex, weight, height, previous fractures, parental history of hip fractures, smoking status, glucocorticoid use, rheumatoid arthritis, secondary osteoporosis, alcohol consumption, and BMD in the general population. Whitlock et al. demonstrated its utility in non-dialysis CKD patients even without BMD data. 5 However, the cohort predominantly comprised adult Canadian women, limiting the generalizability of the findings to male CKD patients or individuals from different regions.
Our study focuses on CKD patients and employed routine laboratory tests combined with machine learning to develop optimal predictive models for osteoporosis. In female CKD patients, the most important predictors were weight, use of female hormone medications, age, Non-Hispanic Black ethnicity, red blood cell counts, height, and serum creatinine. These parameters are essential routine examination indicators for each follow-up visit of CKD patients and are easily accessible. Postmenopausal hormonal changes significantly increase the risk of osteoporosis and fractures in female, with prevalence rates two to four times higher than in males.22,23 Although osteoporosis has traditionally been seen as a female-dominated condition and is often underdiagnosed in males, studies indicate that male experience more osteoporosis-related complications and exhibit higher mortality rates after osteoporotic fractures.24,25 The etiology of male osteoporosis is complex, potentially involving genetic factors, yet research on this topic remains limited. However, it is evident that its pathophysiological mechanisms differ from those in female. Our predictive model for male CKD patients included weight, age, height, Non-Hispanic Black ethnicity, and eGFR as key predictors.
Low body weight has been consistently associated with an increased risk of fractures, particularly hip fractures, while recent evidence suggests obesity may also elevate the risk of fractures at specific skeletal sites such as the upper arm. 26 Although our model did not account for fracture location, future research could incorporate site-specific risk to enhance clinical relevance. Notably, height, typically considered irrelevant, was also identified as a meaningful predictor. 27 The use of menopausal hormone therapy has been limited due to controversy over associated side effects, yet some researchers still advocated for considering menopausal hormone therapy as a therapeutic option specifically as an additional benefit in the context of treatment of menopausal symptoms. 28 This aligns with our findings. Age remains a well-established risk factor, and individuals over 50 are often prioritized for osteoporosis screening. 29 Consistent with prior studies, our model found a lower prevalence of osteoporosis among Non-Hispanic Black individuals. 30 Vásquez et al. reported that this lower prevalence persisted even after adjusting for age, sex, BMI, poverty-income ratio, smoking, and osteoporosis medication, despite their relatively low rates of meeting physical activity recommendations. 31 Additionally, Non-Hispanic Black individuals tend to have higher BMI levels, likely due to physical inactivity and poor eating habits. While higher BMI is typically linked to greater BMD in this population, an increase in BMI was associated with a slight albeit significant increase in the odds of having a low BMD. 32 These findings highlight the multifactorial nature of racial differences in BMD, involving genetics, lifestyle, and socioeconomic factors. We also observed an association between lower red blood cell counts and osteoporosis in female CKD patients. Similar findings have been reported in type 2 diabetic patients, where anemia was linked to osteoporosis, regardless of sex. 33 Serum creatinine reflected muscle mass, and previous study shown that lower serum creatinine is associated with low BMD in subjects without overt nephropathy. 34 Meanwhile, creatinine clearance <65 mL/min has been identified as a fracture risk factor. 35 Interestingly, SHAP analysis from our models indicated that lower serum creatinine was associated with a reduced risk of osteoporosis in female CKD patients, whereas higher eGFR increased risk in males, despite both having low overall importance. The direction of these variables’ marginal effects varied across individuals, likely reflecting complex interactions, heterogeneity in patient profiles, or the model's emphasis on prediction over interpretation. These results caution against directly equating machine learning-derived feature importance with causal inference.
Stacking ensemble is a machine learning technique in which multiple base-level classifiers are combined with a meta-learner to improve overall predictive performance, particularly by enhancing the accuracy of weaker models. 36 In our study, the stacking ensemble model did not exhibit a significant improvement in performance compared to the best-performing single-base model. While several studies have successfully implemented stacking ensembles for disease prediction or diagnosis,37−39 other studies have shown that stacking presented lower performance metrics than single-base models, similar outcomes to our research.40,41 Several factors may account for this outcome. First, the relatively limited sample size in our study, which may restrict the advantage of ensemble learning. Second, the similar and generally good performance of the individual base models, leading to high redundancy among their predictions. Lastly, insufficient model diversity, as the base models may capture overlapping data features and patterns, thus limiting the stacking model's ability to integrate complementary information effectively. Overall, the performance of stacking ensemble methods may vary depending on the dataset characteristics, highlighting the need for context-specific evaluation.
Our study has several limitations. First, the cross-sectional design of the NHANES dataset prevents establishing causal relationships between the identified predictors and osteoporosis, thereby limiting causal inference. Second, data quality and completeness may affect model accuracy. Reliance on self-reported variables introduces potential recall bias, and the exclusion of important factors such as parathyroid hormone, closely related to osteoporosis in CKD, due to excessive missing data may have introduced bias and limited the model's comprehensiveness. Third, despite the use of cross-validation to reduce overfitting, the relatively small sample size and the complexity of machine learning models may still pose a risk of overfitting and reduce model robustness. Fourth, although external validation was performed, it was confined to the U.S. population, which may limit its generalizability to other populations. Future studies should incorporate multinational cohorts to assess ethnic variability in model performance. Finally, extreme class imbalance remained a significant challenge. Despite the use of ADASYN, the model exhibited persistently low F1 scores, reflecting suboptimal sensitivity and limited performance in detecting minority outcomes.
Conclusion
This study presents user-friendly models utilizing interpretable machine learning algorithms to predict osteoporosis in CKD patients. Additionally, we provide an online tool for osteoporosis screening in both community and inpatient settings.
Supplemental Material
sj-docx-1-dhj-10.1177_20552076251357758 - Supplemental material for Development and validation of machine learning models for osteoporosis prediction in chronic kidney disease patients: Data from National Health and Nutrition Examination survey
Supplemental material, sj-docx-1-dhj-10.1177_20552076251357758 for Development and validation of machine learning models for osteoporosis prediction in chronic kidney disease patients: Data from National Health and Nutrition Examination survey by Hui Li, Ya Zhang and Chong Zhang in DIGITAL HEALTH
Supplemental Material
sj-docx-2-dhj-10.1177_20552076251357758 - Supplemental material for Development and validation of machine learning models for osteoporosis prediction in chronic kidney disease patients: Data from National Health and Nutrition Examination survey
Supplemental material, sj-docx-2-dhj-10.1177_20552076251357758 for Development and validation of machine learning models for osteoporosis prediction in chronic kidney disease patients: Data from National Health and Nutrition Examination survey by Hui Li, Ya Zhang and Chong Zhang in DIGITAL HEALTH
Footnotes
Acknowledgments
We acknowledge the data from the NHANES.
Ethical considerations
This study utilized publicly available data involving humans, approved by the NCHS Institutional Review Board, with all participants providing written informed consent. As this study is a secondary analysis, it is exempt from further ethical review.
Informed consent statement
Informed consent was obtained from all subjects involved in the study. More details can be found at the following links: https://wwwn.cdc.gov/nchs/nhanes/continuousnhanes/documents.aspx?BeginYear = 2005, https://wwwn.cdc.gov/nchs/nhanes/continuousnhanes/documents.aspx?BeginYear = 2007, https://wwwn.cdc.gov/nchs/nhanes/continuousnhanes/documents.aspx?BeginYear = 2009, https://wwwn.cdc.gov/nchs/nhanes/continuousnhanes/documents.aspx?BeginYear = 2013, ![]() .
.
Author contributions
HL did writing—review & editing, writing—original draft, methodology, data curation, and conceptualization. YZ did writing—review & editing, validation, and methodology. CZ did writing—review & editing, validation, supervision, project administration, and conceptualization.
Guarantor
CZ
Funding
The author(s) disclosed receipt of the following financial support for the research, authorship, and/or publication of this article: This study was funded by National Natural Science Foundation of China (82470705), Natural Science Foundation of Shanghai (24ZR1450200), and Sailing Special Project of Shanghai Rising-Star Program (23YF1425400).
Declaration of conflicting interests
The authors declared no potential conflicts of interest with respect to the research, authorship, and/or publication of this article.
Data availability
Supplemental material
Supplemental material for this article is available online.
References
Supplementary Material
Please find the following supplemental material available below.
For Open Access articles published under a Creative Commons License, all supplemental material carries the same license as the article it is associated with.
For non-Open Access articles published, all supplemental material carries a non-exclusive license, and permission requests for re-use of supplemental material or any part of supplemental material shall be sent directly to the copyright owner as specified in the copyright notice associated with the article.