
Abstract
Objective
Mortality risk prediction (MRP) enhances healthcare resource allocations and end-of-life care. High prediction accuracy has been reported for MRP in intensive care units (ICUs). However, there have been fewer studies on the use of MRP in care facilities, which lack laboratory test data and continuous vital signs monitoring. Among related studies, vital signs-based therapy (VSbT), common in hospitals and care facilities, can dramatically affect vital signs, but VSbT effect has not been considered in related studies. This lack of consideration might cause lower prediction accuracy.
Methods
The purpose of this study was to explore the feasibility of using MRP in care facilities, but with sparse vital signs measurements from nurseChart, part of an open ICU database. To make clear the effect of VSbT on MRP, the authors proposed a feature-exploring algorithm for identifying the VSbT-related features and thereby identify a classifier for vital signs-based MRP. Moreover, appropriate vital signs measurement intervals were investigated using the data of continuous vital signs contained in the database as reference.
Results
This study shows that of all the vital signs, temperature is strongly subject to VSbT effects. Moreover, with sparse vital signs data and certain personal information, the classifier with the proposed VSbT-related features could outperform those reported so far (G-mean: 0.6462 vs. 0.6307). Moreover, for each vital sign, the appropriate measurement interval was determined for care facility scenarios.
Conclusion
Using sparse data from an open ICU database, this study shows the feasibility of vital sign-based MRP use at care facilities, which is a big step towards the practical use of the MRP in those facilities.
Keywords
Introduction
The aging population is rapidly growing around the world. 1 With end-of-life care, a high staff-to-patient ratio is necessary for intensive patient monitoring. Therefore, mortality risk prediction (MRP), which enables early notification to the patient's family members, 2 can help allocate resources, improve palliative care decisions, provide dignity during end-of-life care, 3 and advocate improved end-of-life decision-making.4,5
Several studies have explored models for predicting mortality risk for patients in intensive care units (ICUs).6–25 These studies employed models that included laboratory results, demographics (age, gender), and vital signs.8,20 However, laboratory results are very time-consuming, and they are difficult to obtain in non-ICU settings such as care facilities. Consequently, some studies have used only a small number of laboratory results. For example, Aya Awad et al. developed a model for early prediction, at 6 hours after ICU admission, by using vital signs and two laboratory result variables. 9 For care facility cases, many studies only focused on mortality-related factors,26–29 but few studies have used data-driven methods to predict mortality with associated factors and scores. 30 For example, Chendra et al. used demographics, medical comorbidity, and laboratory values to predict mortality within 6 months of hospital discharge and transfer to facility care. 30 Some limited consideration has been given to vital signs in care facility settings. For example, Bonnez et al. studied correlation levels between vital signs and mortality using statistical techniques, 31 but this type of analysis merely identifies correlation. It does not predict mortality.
One important issue to note is that all existing MRP studies failed to take into consideration the vital signs-based therapy (VSbT) effect. VSbT refers to clinical interventions that are initiated in response to abnormal vital signs measurements according to established clinical guidelines. Compared to ICUs, care facilities exhibited greater variability in both VSbT implementation and treatment outcomes, often with less aggressive interventions and a higher likelihood of incomplete treatments. While VSbT guidelines in both settings share fundamental vital sign thresholds that trigger clinical concern, they differ significantly in intervention intensity and monitoring frequency. Vital signs respond to different excitations (e.g. sepsis and medication) 32 and cause changes to each other.33–35 The treatment of fever can cause a dramatic change in temperature and other vital signs, as elevated temperature is linked to increased heart rate and decreased blood pressure and oxygen saturation. 34 The antipyretic treatments primarily extended the length of the fever rather than reducing its intensity. 35 Increased mortality rates associated with antipyretic drugs could be due to their toxic effects or their interference with the body's natural fever response, which is typically protective against infection. 35 As another example, the role of oxygen therapy in intensive care management varies depending on different SpO2 levels and accompanying conditions. 36
Therefore, it is reasonable to claim that changes in vital signs following VSbT might be different from the vital signs before the VSbT,37,38 indicating that multiple dynamics might be hidden in one vital signs data sequence. When using vital signs to predict mortality, if the effects of VSbT are neglected, then one single prediction mechanism must deal with multiple dynamics. A complex prediction mechanism would be required, and it possibly could result in lower MRP accuracy. Except for the prediction of the onset of intervention,37,39 the VSbT effect has not been made clear in the literature.
The therapies are not only important for ICUs. They are also important for end-of-life management in nursing homes, which urgently require MRP. 40 In nursing homes for example, the frequency and pattern of vital signs abnormalities have been associated with hospitalization and mortality, 31 suggesting that appropriate VSbT in these settings could significantly impact outcomes for residents requiring end-of-life care.
It is important to note that while VSbT guidelines used in care facilities and ICUs share similar fundamental vital sign thresholds, the guidelines differ significantly in implementation. Care facilities typically employ a subset of the interventions available at ICUs, with less intensive monitoring and more limited treatment options. As an example, both settings recognize similar fever thresholds (approximately 37.8–38.0 °C),34,35,41,42 but ICUs can implement more aggressive fever management protocols.34,35 Trilling et al. reported that hypertension in nursing homes is defined using similar thresholds (≥140/90 mmHg)43–45 to those used in ICUs settings. Despite the differences in criteria, the underlying physiological responses to interventions and their relationship to mortality risk likely follow similar patterns. Therefore, the ICU-based analysis in this study is relevant to care facility settings, with appropriate adjustments for the more limited intervention capabilities.
Abnormal vital signs are strongly related to life-threatening adverse events, 46 various criteria have been reported for determining abnormal vital signs.43,44,46,47 However, the vital signs criteria for triggering VSbT are either not clear or are mixed. 32 Although the effects of VSbT were investigated by comparing adverse effects of treatment groups and control groups, 35 there haven’t been any studies reporting VSbT's effects on MRP.
The purpose of this study was to explore the feasibility of MRP in care facilities, but using an open ICU database (eICU-CRD: eICU Collaborative Research Database 48 ), addressing two challenges: limited data availability due to the scarcity of nursing home records, requiring emulation using open ICU database, and the need to account for VSbT effects. This exploration is necessary because feasibility studies are required before any trials can be carried out in care facilities.
This study first made clear the effects of different types of therapies on MRP by splitting the dataset into subgroups with the vital sign dependent thresholds following the criteria for abnormal vital signs. In our study, VSbT specifically refers to evidence-based clinical interventions triggered by abnormal vital sign values according to the vital signs criteria for triggering guidelines. A feature-exploring algorithm was proposed for capturing information for significant VSbT effects and for MRP. If the overall accuracy of MRP for the split subgroups is much higher than that of the original single dataset, it can be inferred that the VSbT effects should be taken into consideration. It can also be inferred that the splitting of the dataset at therapy instance (the threshold of the vital sign) is one way to improve mortality prediction. This study adheres to the TRIPOD (transparent reporting of a multivariable prediction model for individual prognosis or diagnosis) guidelines, 49 with the completed checklist available (Supplemental Appendix S1).
Materials and methods
Database and data selection
The eICU-CRD 48 database used in this study contains records for over 160,000 patients who were admitted to ICUs. This study focuses on older patients admitted to ICUs, thus one criterion used to select the dataset was the patient's age ≥ 60 years old, without any restrictions on causes of admission to an ICU. This focused selection of elderly patients helps bridge the demographic gap between ICU and care facility populations, as older adults represent the primary demographic in long-term care settings. To emulate limited vital signs data typical of care facilities, this study used the sparse vital signs measurement from the “NurseChart” table in eICU-CRD. To obtain 3-day, 4-day, 5-day, and 7-day death predictions, only patients who remained in an ICU for at least 8 days were selected. To avoid re-admission data mixture, if a patient's final ICU admission ended with death, then all previous ICU admission records were excluded from the dataset. However, in cases where a patient survived and was released from ICU care, each ICU admission record for the same patient was considered to be independent.
Vital signs data were obtained from the “nurseChart” table, which contains data recorded by nursing staff. The vital signs of interest in this study are temperature, heart rate (HR), respiration rate (RR), oxygen saturation (SpO2), systolic blood pressure (SBP), and diastolic blood pressure (DBP). Rather than the continuous, dense, and comparatively accurate monitoring data of “vitalperiodic” table, the vital signs in the “nurseChart” table is sparse and inaccurate, which emulates the situation in care facilities. To handle human errors contained in the “nurseChart” table, any value outside the range µ ± 5σ, where µ is mean and σ is standard deviation (SD) of the normal distribution fit from the data throughout the recording period, was assumed to be an outlier and excluded from the study. For SpO2, values over 100 were excluded following the highest scale of SpO2. Because some records in the “nurseChart” table are unevenly measured and sparse, which makes time series analysis difficult, the following criteria were used to select samples that contained enough records for processing:
For the five vital signs used in this study (HR, RR, SpO2, SBP, and DBP), samples must have at least eight records per day. For temperature, samples must have at least three records per day.
In the database, records for temperature were less frequent than records for the other vital signs. Therefore, the minimum number of records for temperature was set to only three per day.
As a result of the selection process, the total dataset for further study included samples for 2277 patients where 1981 survived and 296 died at discharge. The mean patient age was 71.90 ± 8.02 years, with a gender distribution of 54.90% male (n = 1250) and 45.10% female (n = 1027). For patients that died at discharge, 167 were male and 129 were female. For patients that survived, 1083 were male and 898 were female. The mean duration of stay in an ICU was 14.9 ± 9.1 days, with patients who died having a longer average stay (16.9 ± 17.2 days) compared to those that survived (14.6 ± 7.0 days). The larger SD in the deceased group's ICU stay is due to the smaller number of samples and larger variability in length of stay. The most frequent reasons for ICU admission, based on Apache admission diagnosis categories, were: respiratory disorders, cardiovascular disorders, sepsis, pulmonary conditions, and pneumonia.
Splitting threshold options
Figure 1 shows the distribution of vital signs (oxygen saturation, heart rate, respiratory rate, DBP, SBP, and temperature) across various temperature thresholds (34.0–40.0 °C, horizontal axis). The plots represent four color-coded patient groups denoted by blue, red, yellow, and green. These colors correspond to the distributions of high-temperature subgroup alive, high-temperature subgroup death, low-temperature subgroup alive, and low-temperature subgroup death, respectively. By splitting the dataset into high- and low-temperature subgroups, the difference between the signal distribution of the death and survival groups becomes clearer for several vital signs at certain temperature values, for example temperature at 38.0 °C. Each plot visualizes the variation in probability density across the range of possible measurements. This change indicates that there might be potential to enhance the MRP by implementing data splitting to take VSbT effects into consideration. Sample size distribution analysis across temperature thresholds is tabulated in Supplemental Appendix S3, Table S1.

The distribution of each vital sign for 3-day predictions, split with different thresholds of temperature: (A) temperature, (B) oxygen saturation, (C) systolic blood pressure, (D) diastolic blood pressure, (E) respiratory rate, and (F) heart rate.
Regarding reasonable threshold values for each vital sign, various VSbT treatment criteria43,44,46,47,50 can be referenced in the literature, although no systematic investigation has been done. To identify an option list of threshold values for each vital sign, the following criteria were reviewed and analyzed.
Normal ranges for vital signs from Sapra et al.
46
The criteria for vital signs for triage from Barfod et al.
47
Hypertension guidelines from Burnier
43
and Magee and von Dadelszen
44
Systemic inflammatory response syndrome (SIRS) criteria
50
as follows:
HR > 90 beats/minute Temperature > 38 °C or <36 °C RR > 20 breaths/minute
Splitting threshold options for heart rate
For heart rate, the normal range of vital signs definition, the criteria for vital signs for triage, and SIRS were analyzed. Tachyarrhythmia and bradycardia are defined as HR > 100 beats/minute 51 and HR < 60 beats/minute, 52 respectively. They are boundary values for the normal range of heart rate. However, for bradycardia, noticeable symptoms typically begin around an HR of 50 beats/minute. Symptoms such as fatigue, weakness, and dizziness were judged at the lower rate. 52 The achievement of atrial fibrillation control is associated with a heart rate after treatment of ≤110 beats/minute. 53 HR < 50 beats/minute and an HR > 110 beats/minute mark the beginning of triage in criteria for vital signs for triage. HR > 130 beats/minute is the resuscitation level. HR > 90 beats/minute is associated with SIRS criteria. Moreover, spending 10% more time with a heart rate below 90 beats/minute was associated with increased survival, while spending 10% more time with a heart rate > 120 beats/minute resulted in decreased survival. 54 Therefore, HR of <50, <60, >90, >100, >110, >120, and >130 were used for comparison as shown in Table 1.
Vital sign thresholds used for dataset splitting in this study.
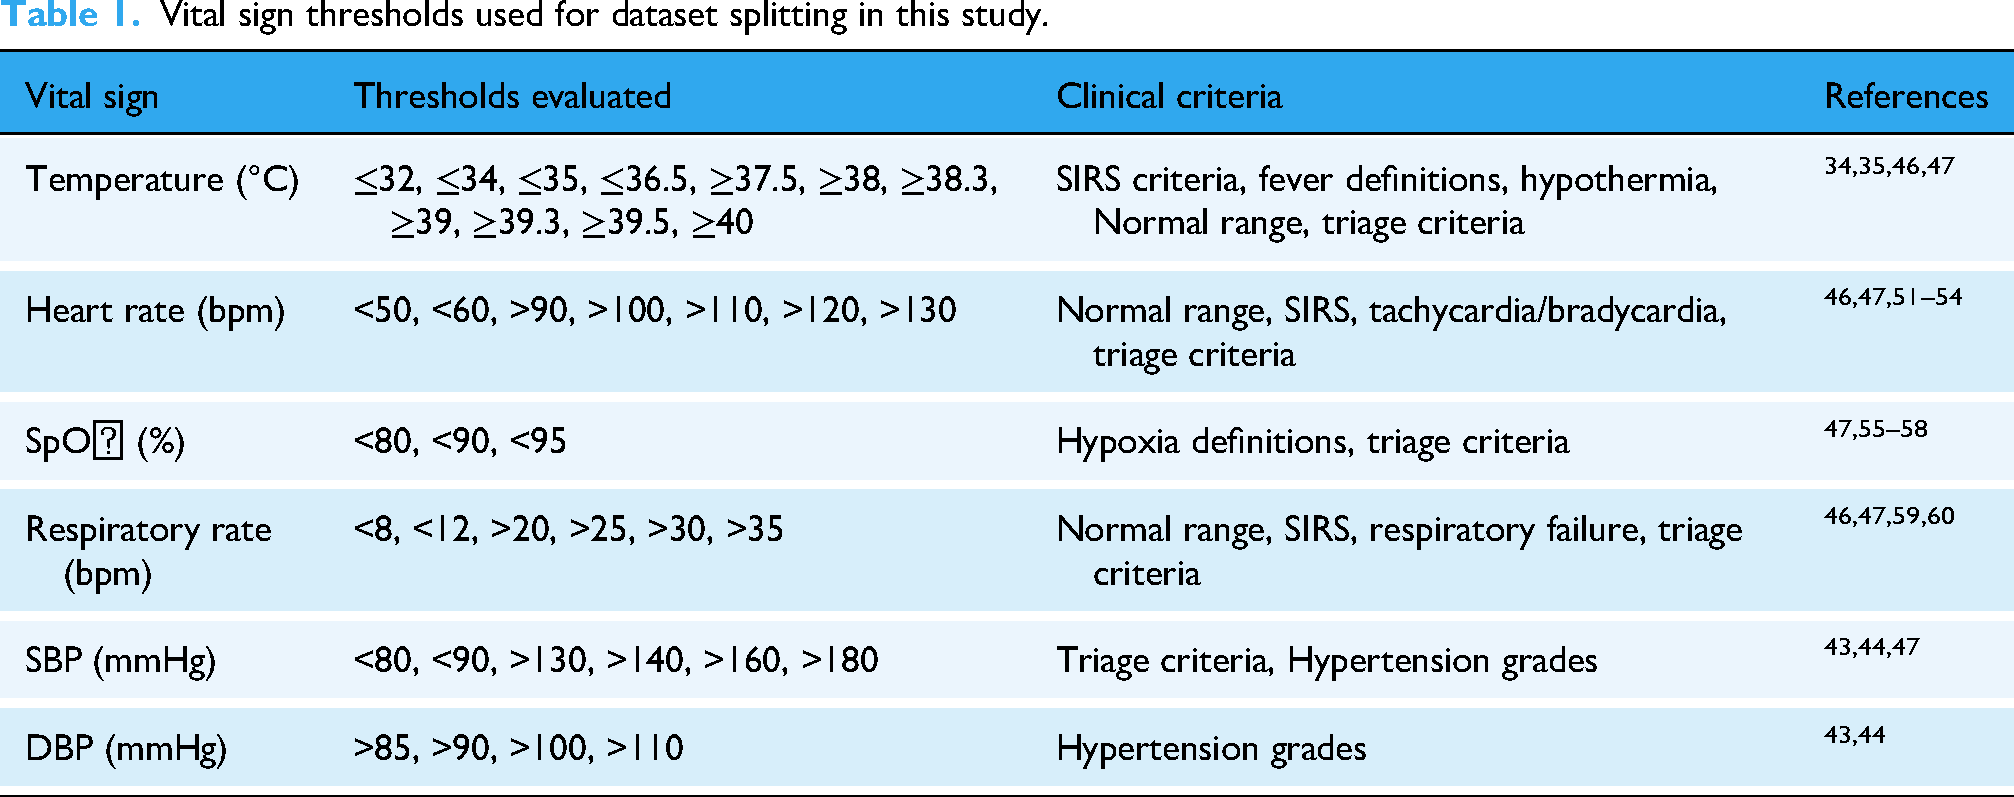
Splitting threshold options for SpO2
SpO2 less than 95% is considered abnormal. 55 Zhou et al. 56 found that the time spent in an oxygen saturation of 95% to 99% was associated with reduced mortality in ICUs with interventions such as mechanical ventilation. SpO2 less than 90% is defined as hypoxia 57 and can lead to a clinical deterioration.52,53 The best threshold to start oxygen therapy in acute stroke or acute myocardial infarction patients might be 90%. 58 Moreover, the brain gets effect when SpO2 is less than 80%. 55 Therefore, three SpO2 thresholds were evaluated following the vital signs criteria for triage: <95%, <90%, and <80%.
Splitting threshold options for respiration rate
For respiration rate, RR > 20 breaths/minute is one of the indicators of SIRS criteria. RR < 12 breaths/minute and RR > 20 breaths/minute are boundary values for the normal range of RR. 46 RR > 25 breaths/minute and RR < 8 breaths/minute generally indicate clinical deterioration. 59 RR > 35 breaths/minute is one of the criteria for acute respiratory failure. 60 The criteria for vital signs for triage are defined for different levels of resuscitation as <8, >25, >30, and >35. Therefore, the threshold options of RR were determined as follows: <8, <12, >20, >25, >30, and >35 for RR.
Splitting threshold options for diastolic and systolic blood pressure
Hypertension guidelines define different states of hypertension. Therefore, the following criteria for both triage and hypertension guidelines were adopted to decide the threshold options for blood pressure:
>85, >90, >100, and >110 for DBP <80, <90, >130, >140, >160, >180 for SBP
Splitting threshold options for temperature
For temperature, the criteria for vital signs for triage, SIRS criteria, and the normal range of vital signs definition were used. However, different fever manifestations are associated with different physiological responses. 35 From the literature, peak temperatures ≥39, ≥39.3, and ≥39.5 were associated with increased mortality, 35 and fever was defined as ≥38.3. 34 Therefore, to cover all VSbT events, the following threshold options for temperature were used: ≤32, ≤34, ≤35, ≤36.5, ≥37.5, ≥38, ≥38.3, ≥39, ≥39.3, ≥39.5, and ≥40.
Intervention effect evaluation through mortality prediction splitting threshold options
A method was designed to explore splitting thresholds for vital signs while investigating the performance of mortality predictions. Figure 2 shows the three steps of the method used in this study. In the first step, for each vital sign, the values in the option list acquired through the analysis in the splitting threshold options section were set as the thresholds. Detailed pseudocode for the complete pipeline is provided in Supplemental Appendix S2. Then, they were evaluated one by one. For one vital sign, the dataset was split into subgroups by threshold. After separating the dataset, features (detailed in the feature exploration section) were extracted from the data for all the vital signs and demographic information for each subgroup. Classifiers were constructed for each subgroup to get an MRP rate. For example, with a temperature threshold of 38.0°C, the 2277 samples contained in the dataset were separated into two groups: the high-temperature subgroup, containing 788 samples with temperatures above 38°C, and the low-temperature subgroup, containing the remaining 1489 samples.

The flow of MRP used to investigate splitting thresholds. Step 1: Evaluation of the thresholds for each vital sign following an option list. Step 2: Comparison of the performance between the split and non-split datasets. And step 3: Integration of the results from multiple classifiers.
The classification results of the two subgroups were averaged and then compared with the non-split approach. To determine the best threshold for the vital sign, the prediction rates of all the values in the option list were compared. If the prediction rate of each vital sign from the split approach outperformed that of the non-split approach, then the output of the split approach was used as input to the next step.
All the classifiers for each vital sign were established, for both the non-split case and the split case using the best threshold. In the last step, a classifier was built to integrate the classification results of the previous steps. For each sample, the outputs of the classifiers corresponding to each vital sign were concatenated as the input to the classifier. For example, the outputs of step one were labeled 1 or 0, where 1 indicates death and 0 indicates survival. If the split approach of five vital signs outperformed the non-split approach, then the five outputs from step one were fed into the next classifier to determine the final results.
However, to consider the effect of subgroups, the subgroups generated by the split approach were combined into a single binary variable, where 1 indicates membership in the high subgroup and 0 indicates membership in the low subgroup. As a result, the final step (step three) received double features as input. For example, if the split approach of five vital signs was outperformed, then the five additional features indicated whether each vital sign belonged to the high subgroup or low subgroup.
Feature exploration
One previous research study 39 recommends using a 12- to 96-hour window to focus on changes in vital signs, while excluding baseline illnesses or chronic conditions, to achieve a more accurate assessment of patient conditions. Similarly, an 84-hour window was used in another study 24 to extract features for MRP, which was shown to be the most efficient and informative period for classification based on the results of several trial tests. This study focused on making “day ahead” predictions. Therefore, a 3-day window was used to calculate features and predict mortality. For example, to make a 3-day ahead prediction, the recordings from day 3rd to day 6th before the patient's discharge are contained in the window, as illustrated in Figure 3. However, for a 7-day ahead prediction, a 1-day window is used since the maximum length of stay in the ICU is 8 days.

Data used for “day ahead” predictions.
Age information, statistical features, selected feature combinations, and episode information for vital signs were considered. The statistical features were expected to capture fundamental characteristics of the vital signs. Pairs of complementary single statistical features may provide sufficient information without using the entire set of statistical features. Moreover, since the statistical features could not reflect incidence frequency of special events for vital signs, which are important for mortality prediction,37,38 episode information was also investigated.
Statistical features
The statistical features mean, median, standard deviation (SD), maximum (max), and minimum (min) were extracted from the raw vital signs measurements contained in n-day windows as described above. Mean and median can provide the average of the vital signs. The standard deviation, maximum, and minimum show the spread and extreme change of the data. For each of the six vital signs, five statistical features were extracted.
Pairs of single statistical features
This new work specifically focuses on temperature measurements not only due to their potential for high performance predictions, but also because temperature is a critical indicator of SIRS, a condition associated with increased mortality.
As an example, the feature pair selection for 3-day predictions was used in the high-temperature subgroup. First, an ANOVA F-test was used to rank all the statistical features. Then, min diastolic was identified as the top-ranked feature, leading to a G-mean of 61.41%. Combining the min diastolic with mean diastolic (the second-ranked feature) resulted in a reduced G-mean of 58.27%. On the other hand, combining the min diastolic with min systolic (the third-ranked feature) yielded a G-mean of 61.27%. Likewise, the min diastolic (the first-ranked feature) combined with max temperature (the fifth-ranked feature) improved the G-mean to 65.50%, and min diastolic combined with the median respiratory rate (the ninth-ranked feature) achieved a G-mean of 63.74%. As a result, the combination of min diastolic with max temperature was identified as the top-performing pair.
Temperature event features
For all vital signs, body temperature was affected by various factors such as infection, age, and medication. 32 Moreover, long-term continuous measurements of body temperature are easier to obtain, even in care facility settings. Both the magnitude and the duration of fever are associated with mortality in ICU patients. 35 In this study, the number of fever episodes 35 were used as the temperature event feature. A fever episode is determined by the onset of fever (≥100.4 F or 38.0 °C) which continues until the temperature returns to within the normal range (≤ 99.5 F or 37.5 °C). The number of samples in the high-temperature subgroup (defined as ≥38.0 °C) is shown in Supplemental Appendix S3, Table S2.
In the high-temperature subgroup (≥38.0 °C), combining the Statistical features and the Temperature Event features with age information resulted in decreased performance. This decline may be due to the inclusion of ambiguous features. Given the strong performance of the combination of min diastolic with max temperature, min diastolic was included as an additional input feature for the high-temperature subgroup. For 3-day ahead predictions, the feature with the highest F-values score, using the ANOVA F-test, in the high-temperature subgroup was min diastolic. For the total dataset and for the low-temperature subgroup, the feature with the highest F-values scores was mean diastolic. The highest F-values score for both temperature subgroups are shown in Table 7.
Classification models and evaluation
Support vector machines (SVM) are well-regarded classifiers known for their high performance, relying on optimal margins to divide datasets into two classes using a hyperplane. Uday et al. conducted a study on time series classification, employing machine learning on the UCI_HAR_Dataset with experts generated features. Their findings revealed that the linear SVM yielded the highest accuracy. 61 Consequently, linear SVM is used for the first step in this study as depicted in Figure 2. The output from step 1, which is binary and represented by either 0 or 1, was fed as an input for the classifier in step 3. In the final step (step 3), the evaluation was conducted using the following models: SVM with both linear and RBF kernels, decision trees (DT), random forests (RF), naive Bayes (NB), and logistic regression (LR).
In the dataset used for this study, the number of patients who died (the minority class) is much smaller than the number of patients who survived (the majority class). As a result, the classification of the dataset is an imbalance classification problem. To ensure that the model did not overfit to the majority class, a class weight was applied to the SVM model using the equation below
62
:
All analyses were conducted using Python 3.11.4 with scikit-learn 1.3.0 for machine learning implementations. For the model implementations, scikit-learn was used with the following configurations:
Linear kernel SVM: C = 1.0, kernel='linear’, class_weight='balanced’ RBF kernel SVM: C = 1.0, kernel='rbf’, class_weight='balanced’ Logistic regression: random_state = 0, class_weight='balanced’ Decision tree: random_state = 0, class_weight='balanced’ Random forest: random_state = 0, class_weight='balanced’ Gaussian Naive Bayes: priors = None, var_smoothing = 1e-09.
To address class imbalance, balanced class weights as described in equation (1) were applied to all classifiers except NB. Unlike the other models, NB does not support class weighting natively because it operates on probability distributions rather than optimizing a decision boundary. Instead, NB inherently adjusts for class imbalances through Bayes’ theorem, which incorporates prior probabilities derived from the training data.
A leave-one-out cross validation was used to evaluate the models. The classification results were used to generate a confusion matrix, which shows true positives (TP), true negatives (TN), false positives (FP), and false negatives (FN). Deceased patients are classified as positive, and survivors as negative. Due to the highly imbalanced nature of the dataset, accuracy is not a reliable performance metric, as a classifier achieves high accuracy by learning to predict the majority class while completely ignoring the minority class. The F1 score, which indicates the ratio of precision and recall only considers the performance for the positive class, whereas in MRP, balanced performance across both classes (survivors and non-survivors) should also be taken into account. Therefore, this study used G-means for assessing classifier performance,64,65 which reflects the compromised but balanced performance between two classes.
The geometric mean (G-mean) is defined as:
This metric accounted for both classes, ensuring that the model performed well in detecting mortality risk without being biased toward the majority class.
Evaluation of the least number of vital sign records per day in terms of MRP
The data from the nurseChart table in the eICU-CRD database is unevenly measured and sparse, similar to what is highly likely to occur in care facilities. Therefore, it is meaningful to investigate the least number of vital sign records per day necessary for MRP to be used in care facilities while taking into consideration the limited workforce of such facilities. The three critical vital signs, temperature, heart rate (HR), and SBP, were chosen for evaluation due to their fluctuating nature. 66 While both HR and SBP exhibited fluctuations, temperature showed a gradual trend. as illustrated in Figure 4. To determine the least number of vital sign records per day for each vital sign, we first interpolated temperature, HR, and SBP data to a consistent 1-minute interval. Subsequently, based on the least frequent measures observed in the “nurseChart” table, evaluations were conducted at intervals of 1, 15, 30, 45, 60, and 120 minutes for HR and SBP, at intervals of 1, 15, 30, 45, 60, 120, 180, 240, and 480 minutes for temperature. Linear interpolation was used for this process, as it provided sufficient accuracy while minimizing potential artifacts that might be introduced by more complex interpolation methods.
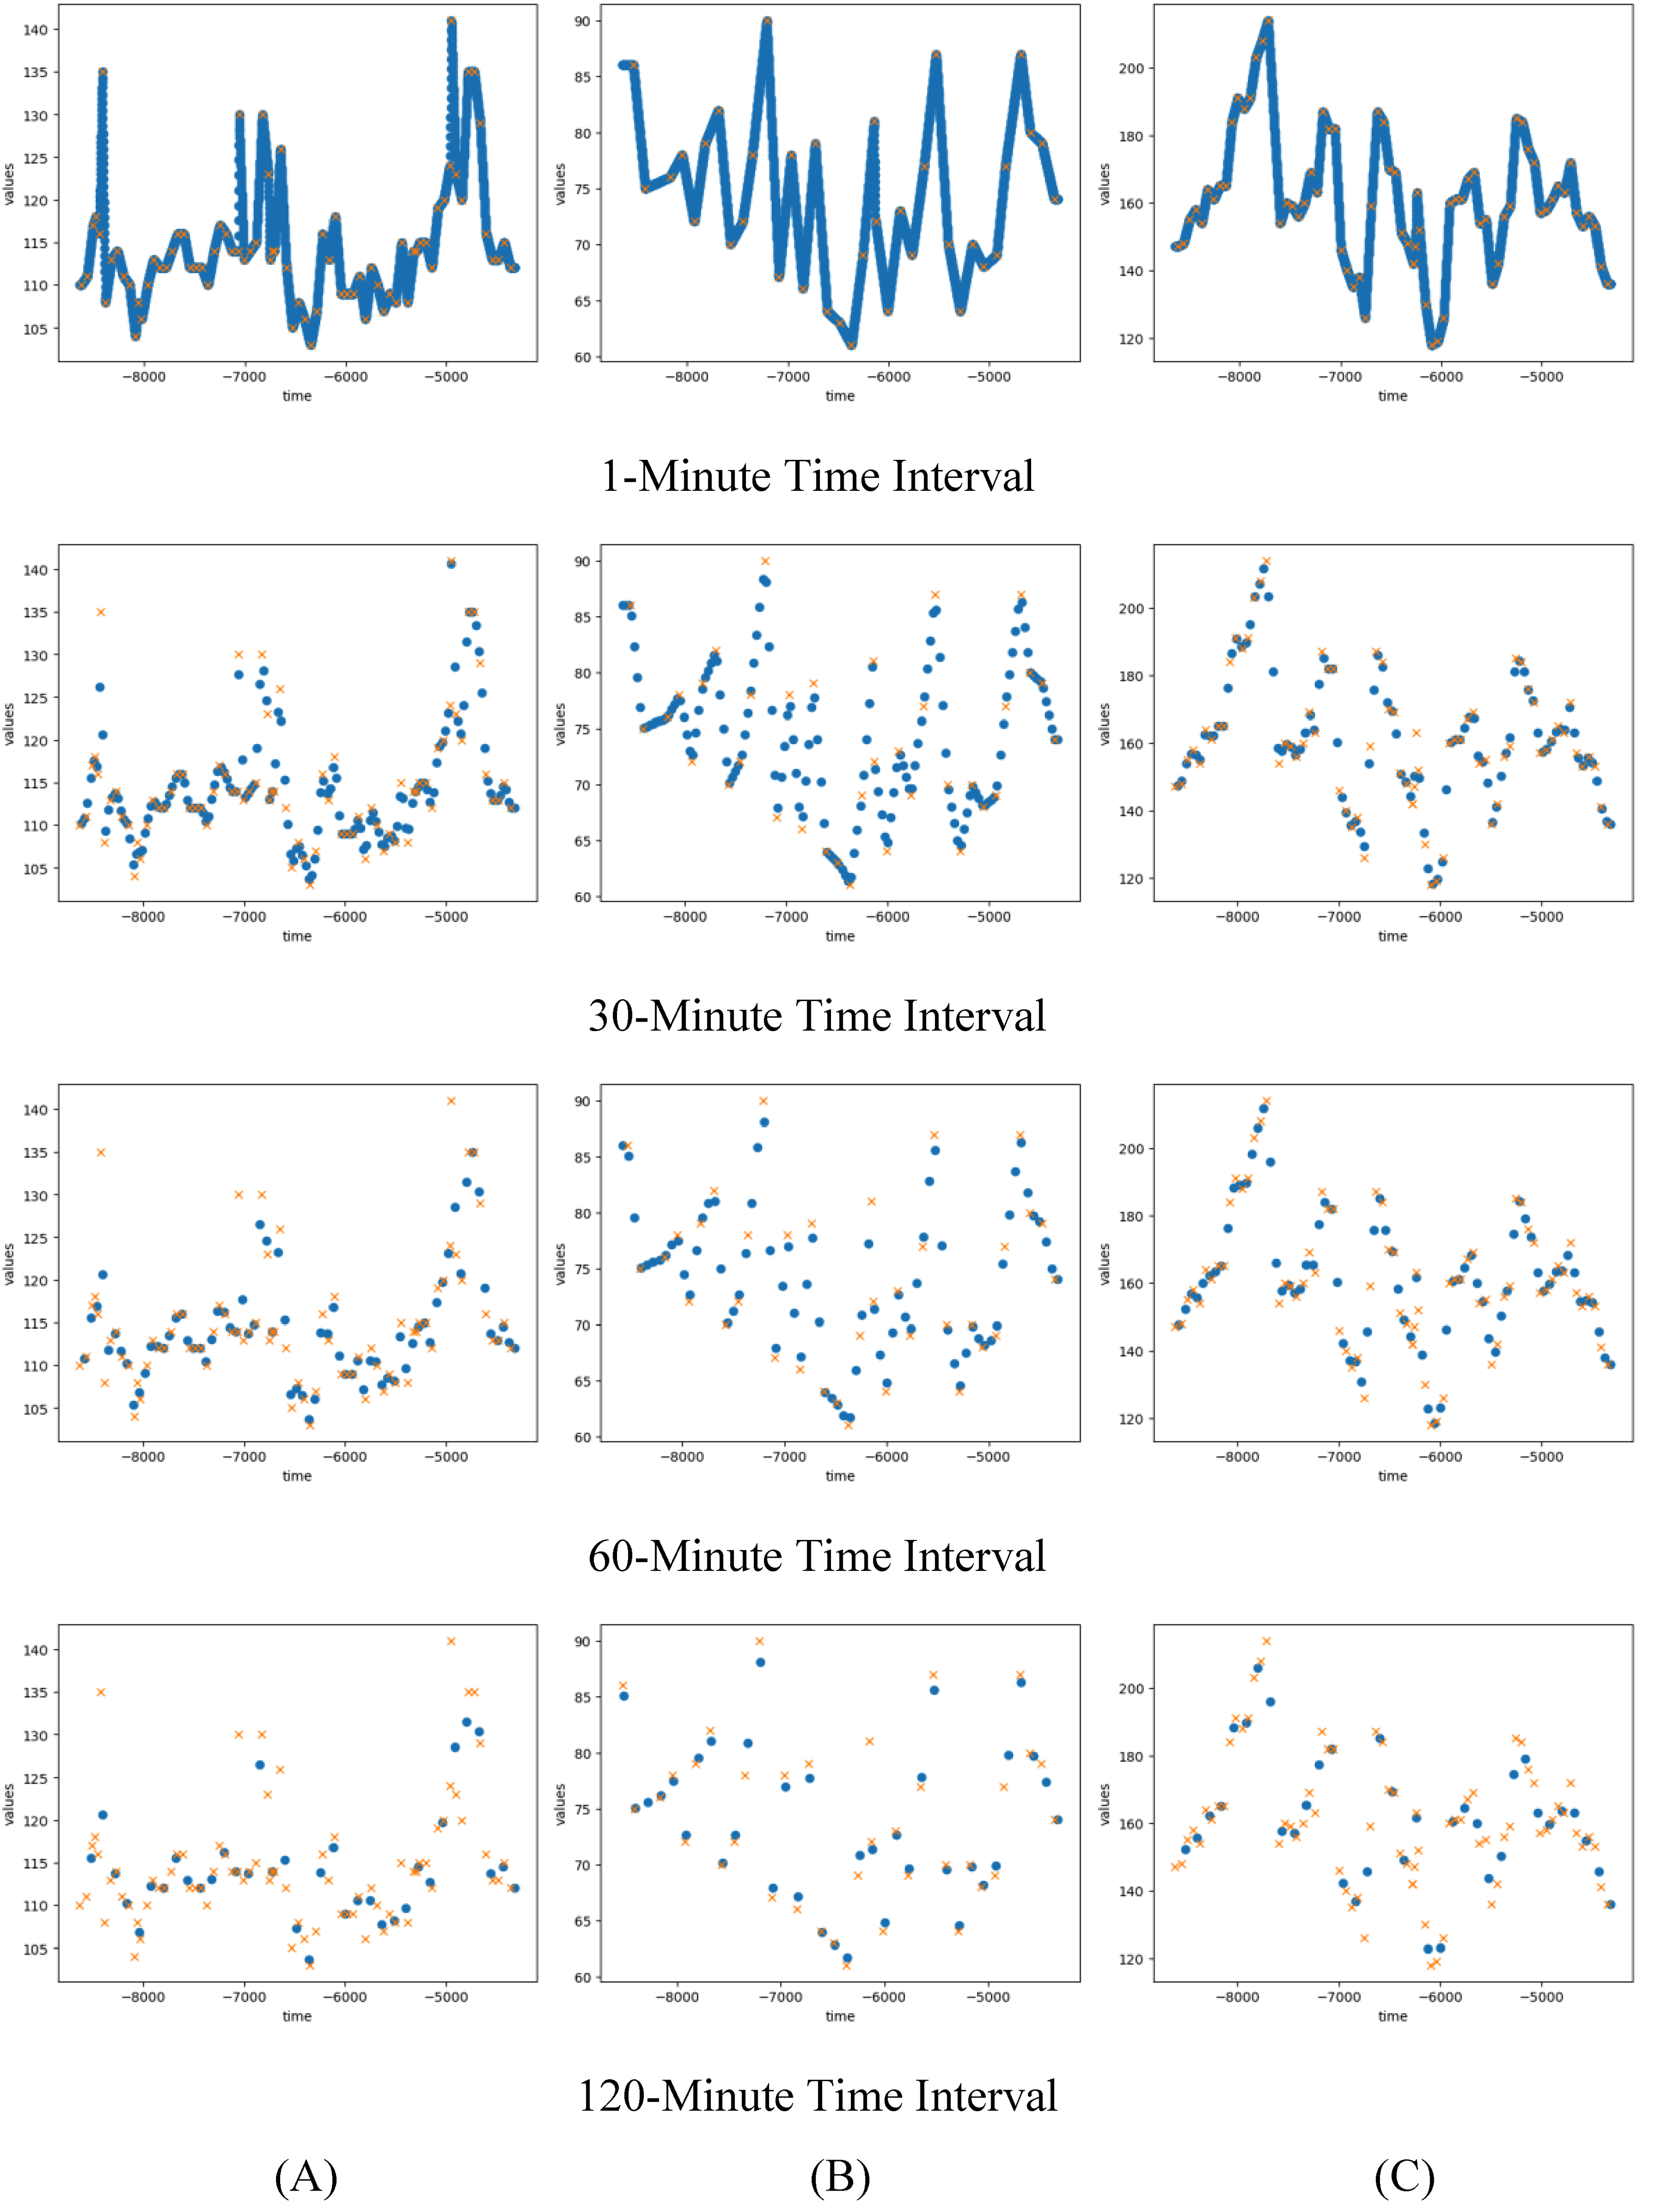
Signals in different time intervals where cross symbols are original data and dot symbols are interpolated data for (A) temperature, (B) heart rate, and (C) systolic blood pressure. The x-axis represents time relative to ICU discharge, with negative values indicating minutes prior to discharge (e.g. −3000 means 3000 minutes before discharge).
Results
Evaluation of thresholds for split approach following VSbT effects
As described in the splitting threshold options section above, various thresholds were evaluated for each vital sign. The results of the split approach for 3-day ahead predictions are shown in Table 2 (Supplemental Appendix S3, Figure S1). The highest performance thresholds in each vital sign for 3-day ahead predictions were ≥38.0 °C for temperature, < 95% for SpO2, >130 mmHg for SBP, >110 mmHg for DBP, >90 beats/minute for HR, and >20 breaths/minute for RR. However, the performance of the split approach for SpO2 < 95% did not outperform the non-split approach. Therefore, results from the split approach for SpO2 were not included as input for the final step.
The maximum performance of each vital sign in the threshold evaluation results for 3-day ahead predictions.

The maximum performance of each vital sign threshold evaluation for 3-day, 4-day, 5-day, and 7-day ahead predictions are tabulated in Tables 2, 3, 4, and 5, respectively. The highest performance of each vital sign in the various day ahead predictions are different.
The maximum performance of each vital sign in the threshold evaluation results for 4-day ahead predictions.

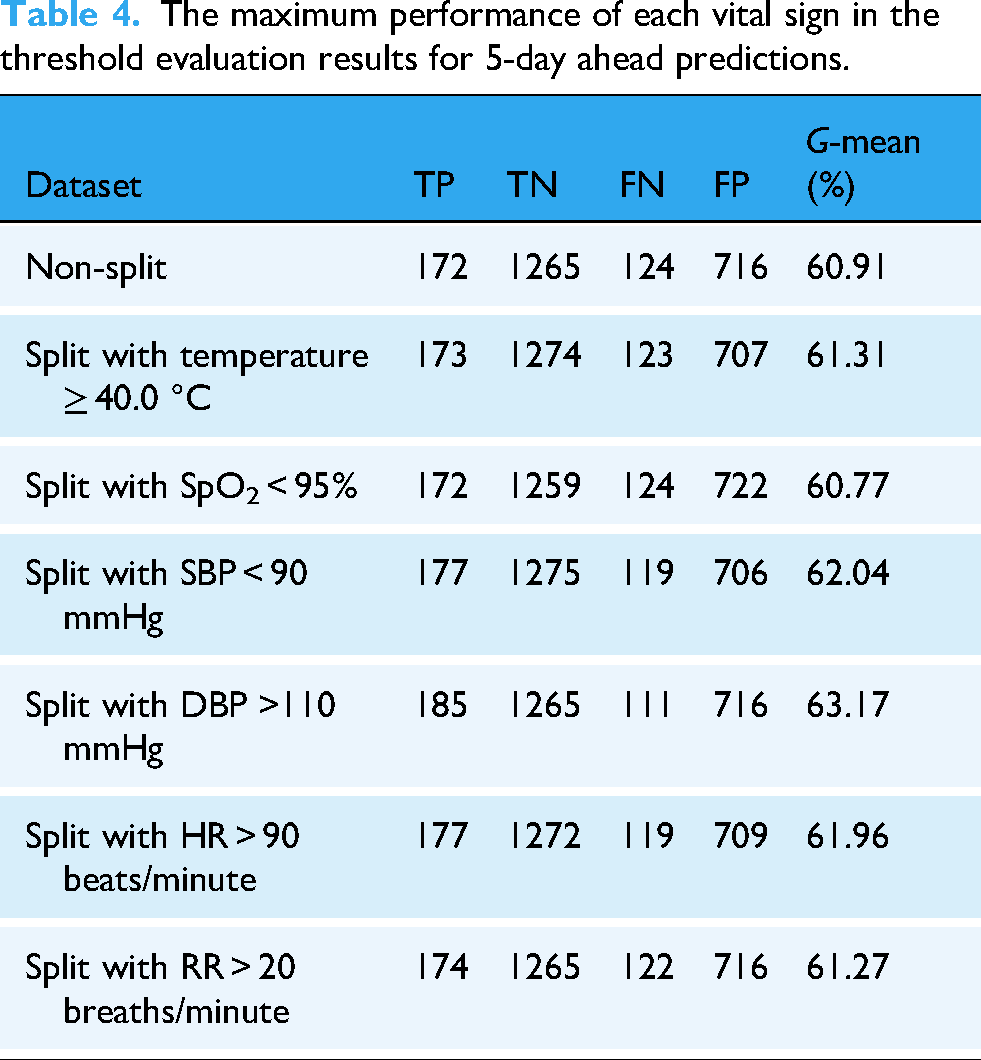
The maximum performance of each vital sign in the threshold evaluation results for 5-day ahead predictions.
The maximum performance of each vital sign in the threshold evaluation results for 7-day ahead predictions.

In step 2, the outputs of the outperforming approach were combined to form an input to step 3. Consequently, all vital signs except SpO2 were selected for predicting 3-day and 5-day ahead predictions. Meanwhile, for 4-day and 7-day ahead predictions, all vital signs in the split approach demonstrated superior performance. Consequently, all vital signs were selected.
Comparison between non-split and split approaches using statistical features
Table 6 (Supplemental Appendix S3, Figure S2) shows the G-mean differences between the non-split approach and the split approach for different day ahead predictions. As can be observed from the table, the 3-day ahead predictions achieved the highest G-mean, followed by 4-day, 5-day, and 7-day ahead predictions. This table also clearly demonstrates that the split approach had the higher G-mean compared with the non-split approach.
Comparison of classification results from the final step with statistical features between the non-split and split approaches for different day predictions.
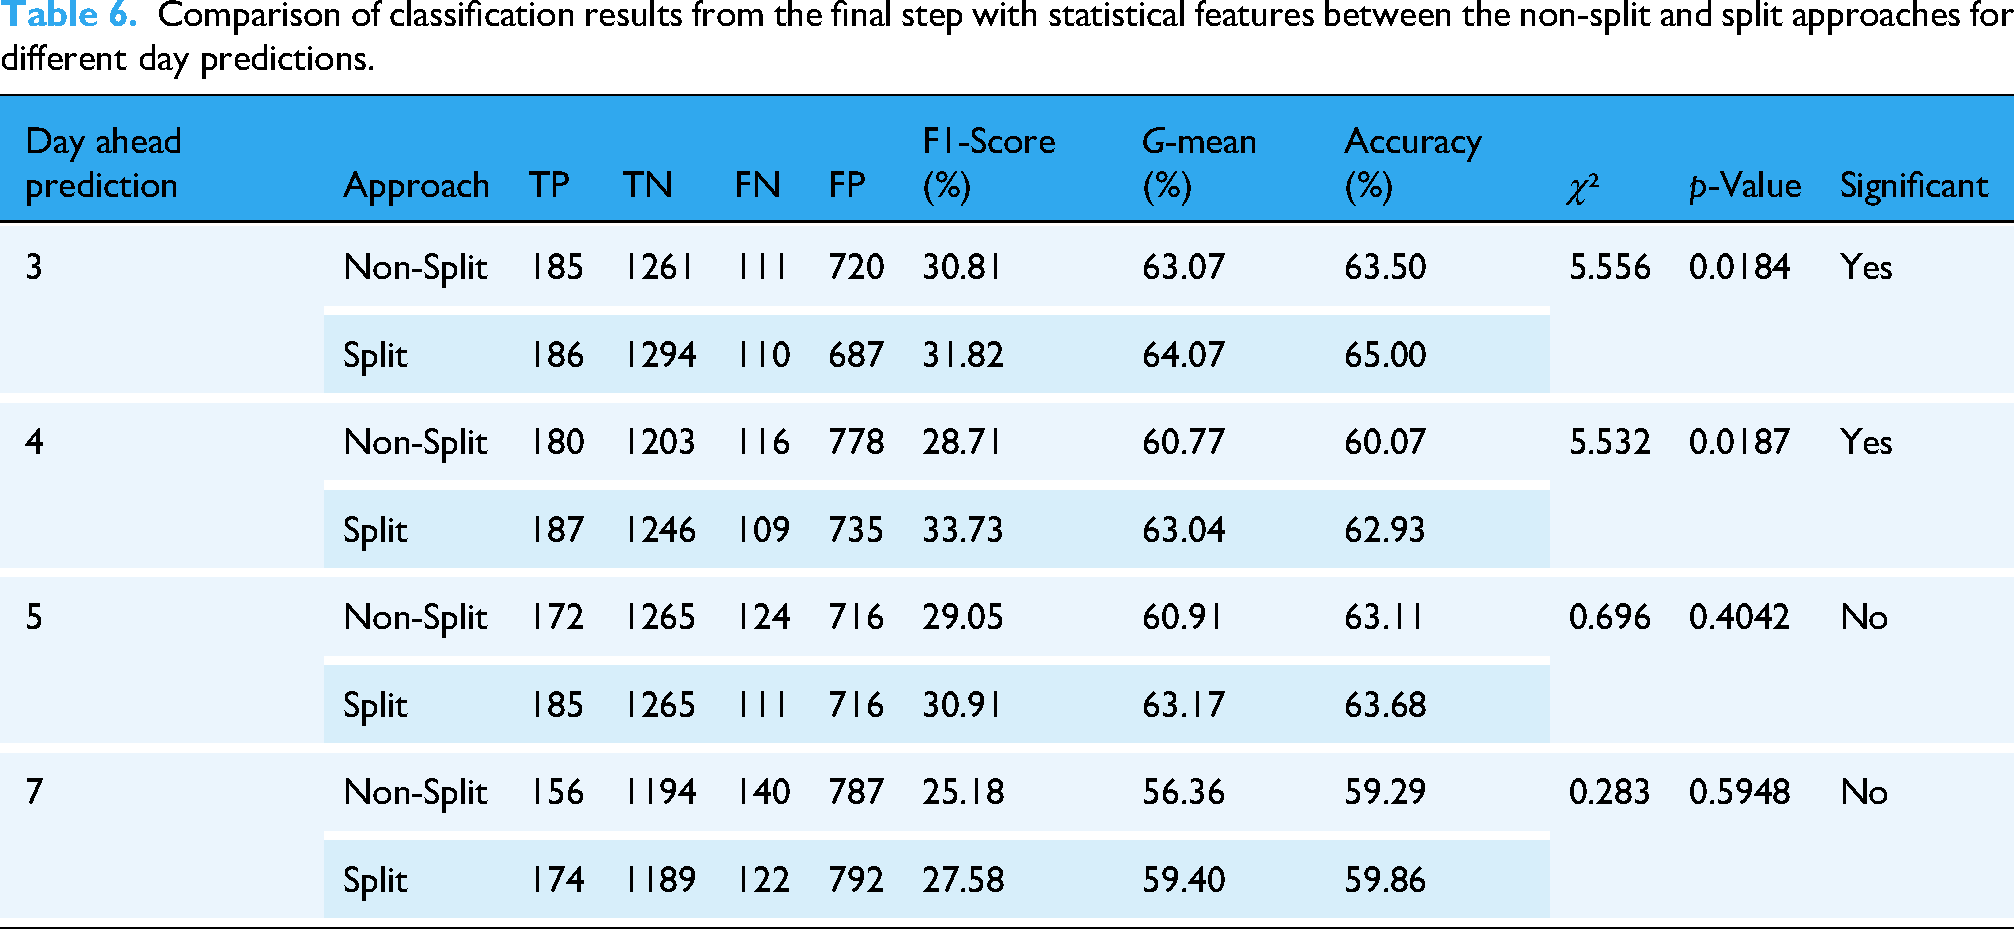
Table 6 displays the performance of the non-split and split approaches for different day ahead predictions. The results indicate that the split approach consistently achieved higher F1-scores, G-means, and accuracies compared to the non-split approach. Furthermore, the 3-day ahead predictions consistently yielded the best performance across all day ahead predictions. These trends are further supported by the results in Supplemental Appendix S3, Table S3, which show improved G-mean and AUC values for the split approach, particularly for the 3-day and 5-day predictions, under both LOOCV and 5-fold cross-validation. The ROC curves for these comparisons are illustrated in Supplemental Appendix S3, Figures S3–S12.
To confirm whether the improvements observed with the split approach were statistically significant, we performed a McNemar test comparing paired prediction outcomes (correct vs. incorrect) between the split and non-split models for each prediction window. In this test, a p-value less than 0.05 is considered indicative of a statistically significant difference. The results showed that the performance improvement for the 3-day and 4-day prediction was statistically significant. Additional details are provided in Supplemental Appendix 3, Table S4. These findings support the robustness of the proposed approach.
Results for temperature event features
The highest F-values score features of the ANOVA F-test in the high-temperature and low-temperature subgroups for different day ahead predictions are tabulated in Table 7. The feature with the highest F-values score in the higher temperature subgroup was min diastolic while that of the total dataset and the lower temperature subgroup was mean diastolic.
The highest F-values score using the ANOVA F-test for both temperature subgroups.

Based on these findings, several feature combinations were evaluated for the high-temperature subgroup. For 3-day ahead predictions, the following feature combinations were evaluated: Statistical + age (G-mean: 65.11%), Temperature Event + max temp + age (G-mean: 60.64%), Statistical + Temperature Event + age (G-mean: 63.75%), and Temperature Event + max temp + min diastolic + age (G-mean: 66.40%). The Temperature Event + max temp + min diastolic + age achieved the highest G-mean at 66.40%, with 79 TP, 435 TN, 37 FN, and 237 FP. Although TN in this combination decreased compared with using only statistical features, the TP increased substantially from 68 to 79, which contributed to improved overall performance.
From Figure 5, the Statistical + age features for the low-temperature subgroup and Temperature Event + max temp + highest F-values score feature + age for the high-temperature subgroup had the highest G-means for 3-day, 5-day, and 7-day ahead predictions. For the 4-day ahead predictions, the Statistical + age features for the high-temperature subgroup and Temperature Event + max temp + highest F-values score feature + age for the low-temperature subgroup had the highest G-means.

G-means for different feature combinations for low- and high-temperature subgroups.
Figure 6 shows the performance of two feature groups (“with temperature event” and “without temperature event”) for different day ahead predictions. The temperature event improved the prediction performance of the model for 3-day and 4-day ahead predictions.

G-means for final results (step 3) with and without temperature event features for different day ahead predictions.
Results for combined features
Table 8 provides a comparison of classification results across various classification models and feature combinations for 3-day ahead predictions. All classification metrics were calculated using a decision threshold of 0.5 for converting predicted probabilities to binary classifications. The features included vital signs alone and a combination of vital signs and high/low subgroup indicator features. For example, the output from a non-split approach from a specific vital sign is combined with high/low subgroup indicator features, where a “1” was assigned for the high subgroup and a “0” was assigned for the low subgroup. DT, RF, and SVMs showed a slight decline in G-mean performance when high/low subgroup indicator features were added. However, NB and LR demonstrated improved G-mean performance with the combined features. Notably, while NB achieved the highest accuracy of 75.41% using only vital signs, LR achieved the highest G-mean at 64.83% using combined features.
Comparison of classification results from the final step with different classification models and combined features for 3-day ahead predictions.

Comparisons with related studies
To make a fair comparison with related studies, the same dataset was used to evaluate the performance of other studies. Baker et al. 23 and Amer et al. 24 adopted only vital signs for MRP. While compared with the laboratory results, vital signs are an easy measurement, and capable of reflecting real-time health conditions used to detect clinical deterioration. Both studies focused on using vital signs to predict mortality. Baker et al. 23 developed a hybrid CNN-BiLSTM network to predict mortality within 3, 7, and 14 days using vital signs and personal information. Their data, sourced from the MIMIC-III database, had inconsistent measurement frequencies that varied during patient stays, but records were averaged every hour. In contrast, the data used in this study, recorded at approximately 4-hour intervals, reflects the measurement schedule typically seen in care facilities. Amer et al. 24 focused on 1.5-day mortality predictions using extracted features from vital signs, with data recorded continuously and averaged over 1- to 2-hour intervals. However, neither study took into consideration the VSbT effect, which this new work demonstrates to be important.
Table 9 shows the performance metrics of three different methods on 3-day ahead predictions. The metrics used to compare these methods are F1-scores, G-mean, accuracy, and AUC, which is the area under the receiver operating characteristics (ROC) curve. The area under the curve (AUC) were used in many studies as an evaluation metric.19,23 The values in parentheses indicate standard deviations. However, since the dataset used in this study is a severe imbalance class, the G-mean was selected to evaluate performance.
Comparing with related studies in terms of the performance of 3-day ahead prediction.
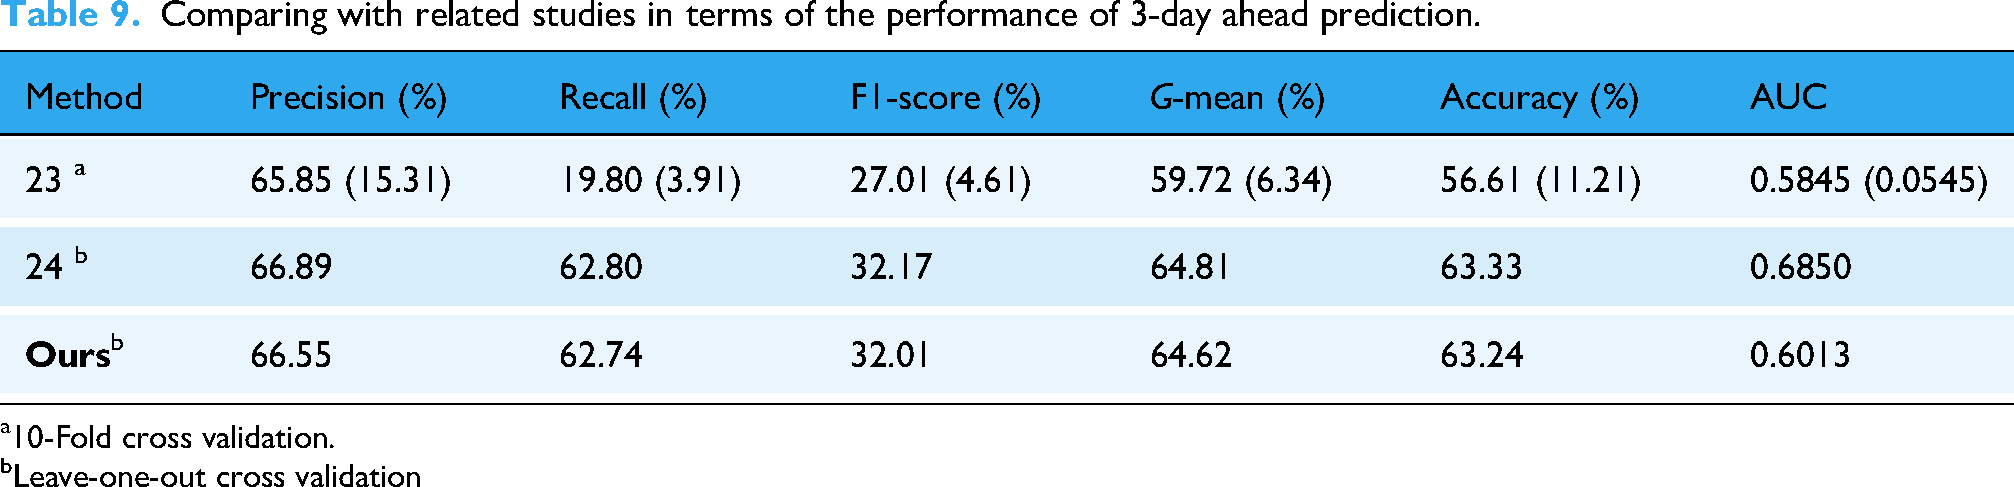
10-Fold cross validation.
Leave-one-out cross validation
The approach used by Amer et al. 24 outperforms the other two methods in terms of all four metrics. Our approach has higher performance than that of Baker et al. 23 Although this approach does not outperform the best approach found in the literature, the VSbT effects were made clear. Our method achieved a G-mean of 64.62% for 3-day ahead predictions. Unlike prior studies, our method relies on sparser and irregularly sampled vital signs from the nurseChart table, without laboratory data, reflecting the resource limitations of care facilities. In contrast, Amer et al. and Baker et al. used denser or more frequent monitoring data, which are often not feasible in long-term care settings. Most importantly, we introduce the consideration of VSbT, which revealed distinct mortality-related patterns not explored in previous work.
Evaluation results for least number of vital sign records per day
Figure 7 presents the 3-day Ahead Prediction performance metrics of one vital sign from temperature, HR, and SBP measured with changing time-interval, but the other two measured with the smallest time interval. The temperature records exhibited the highest G-mean at the 1-minute interval (64.46%). In contrast, for HR, the peak G-mean was observed at the 60-minute interval (65.42%). Similarly, SBP records also demonstrated the highest G-mean at the 60-minute interval (62.97%). These findings suggest that HR and SBP should be measured every 60 minute, while temperature data ideally should be measured every minute for the highest predictive G-mean. However, practical constraints in facility care may limit the feasibility of recording temperature at such a high frequency. Therefore, recording temperature data every 15 minute, 45 minute, or even 240 minute could be viable alternatives. The 240-minute interval appeared to be particularly practical in facility care settings, as it sustained prediction performance within a negligible 0.01 difference in G-mean when compared to the more demanding 1-minute interval.
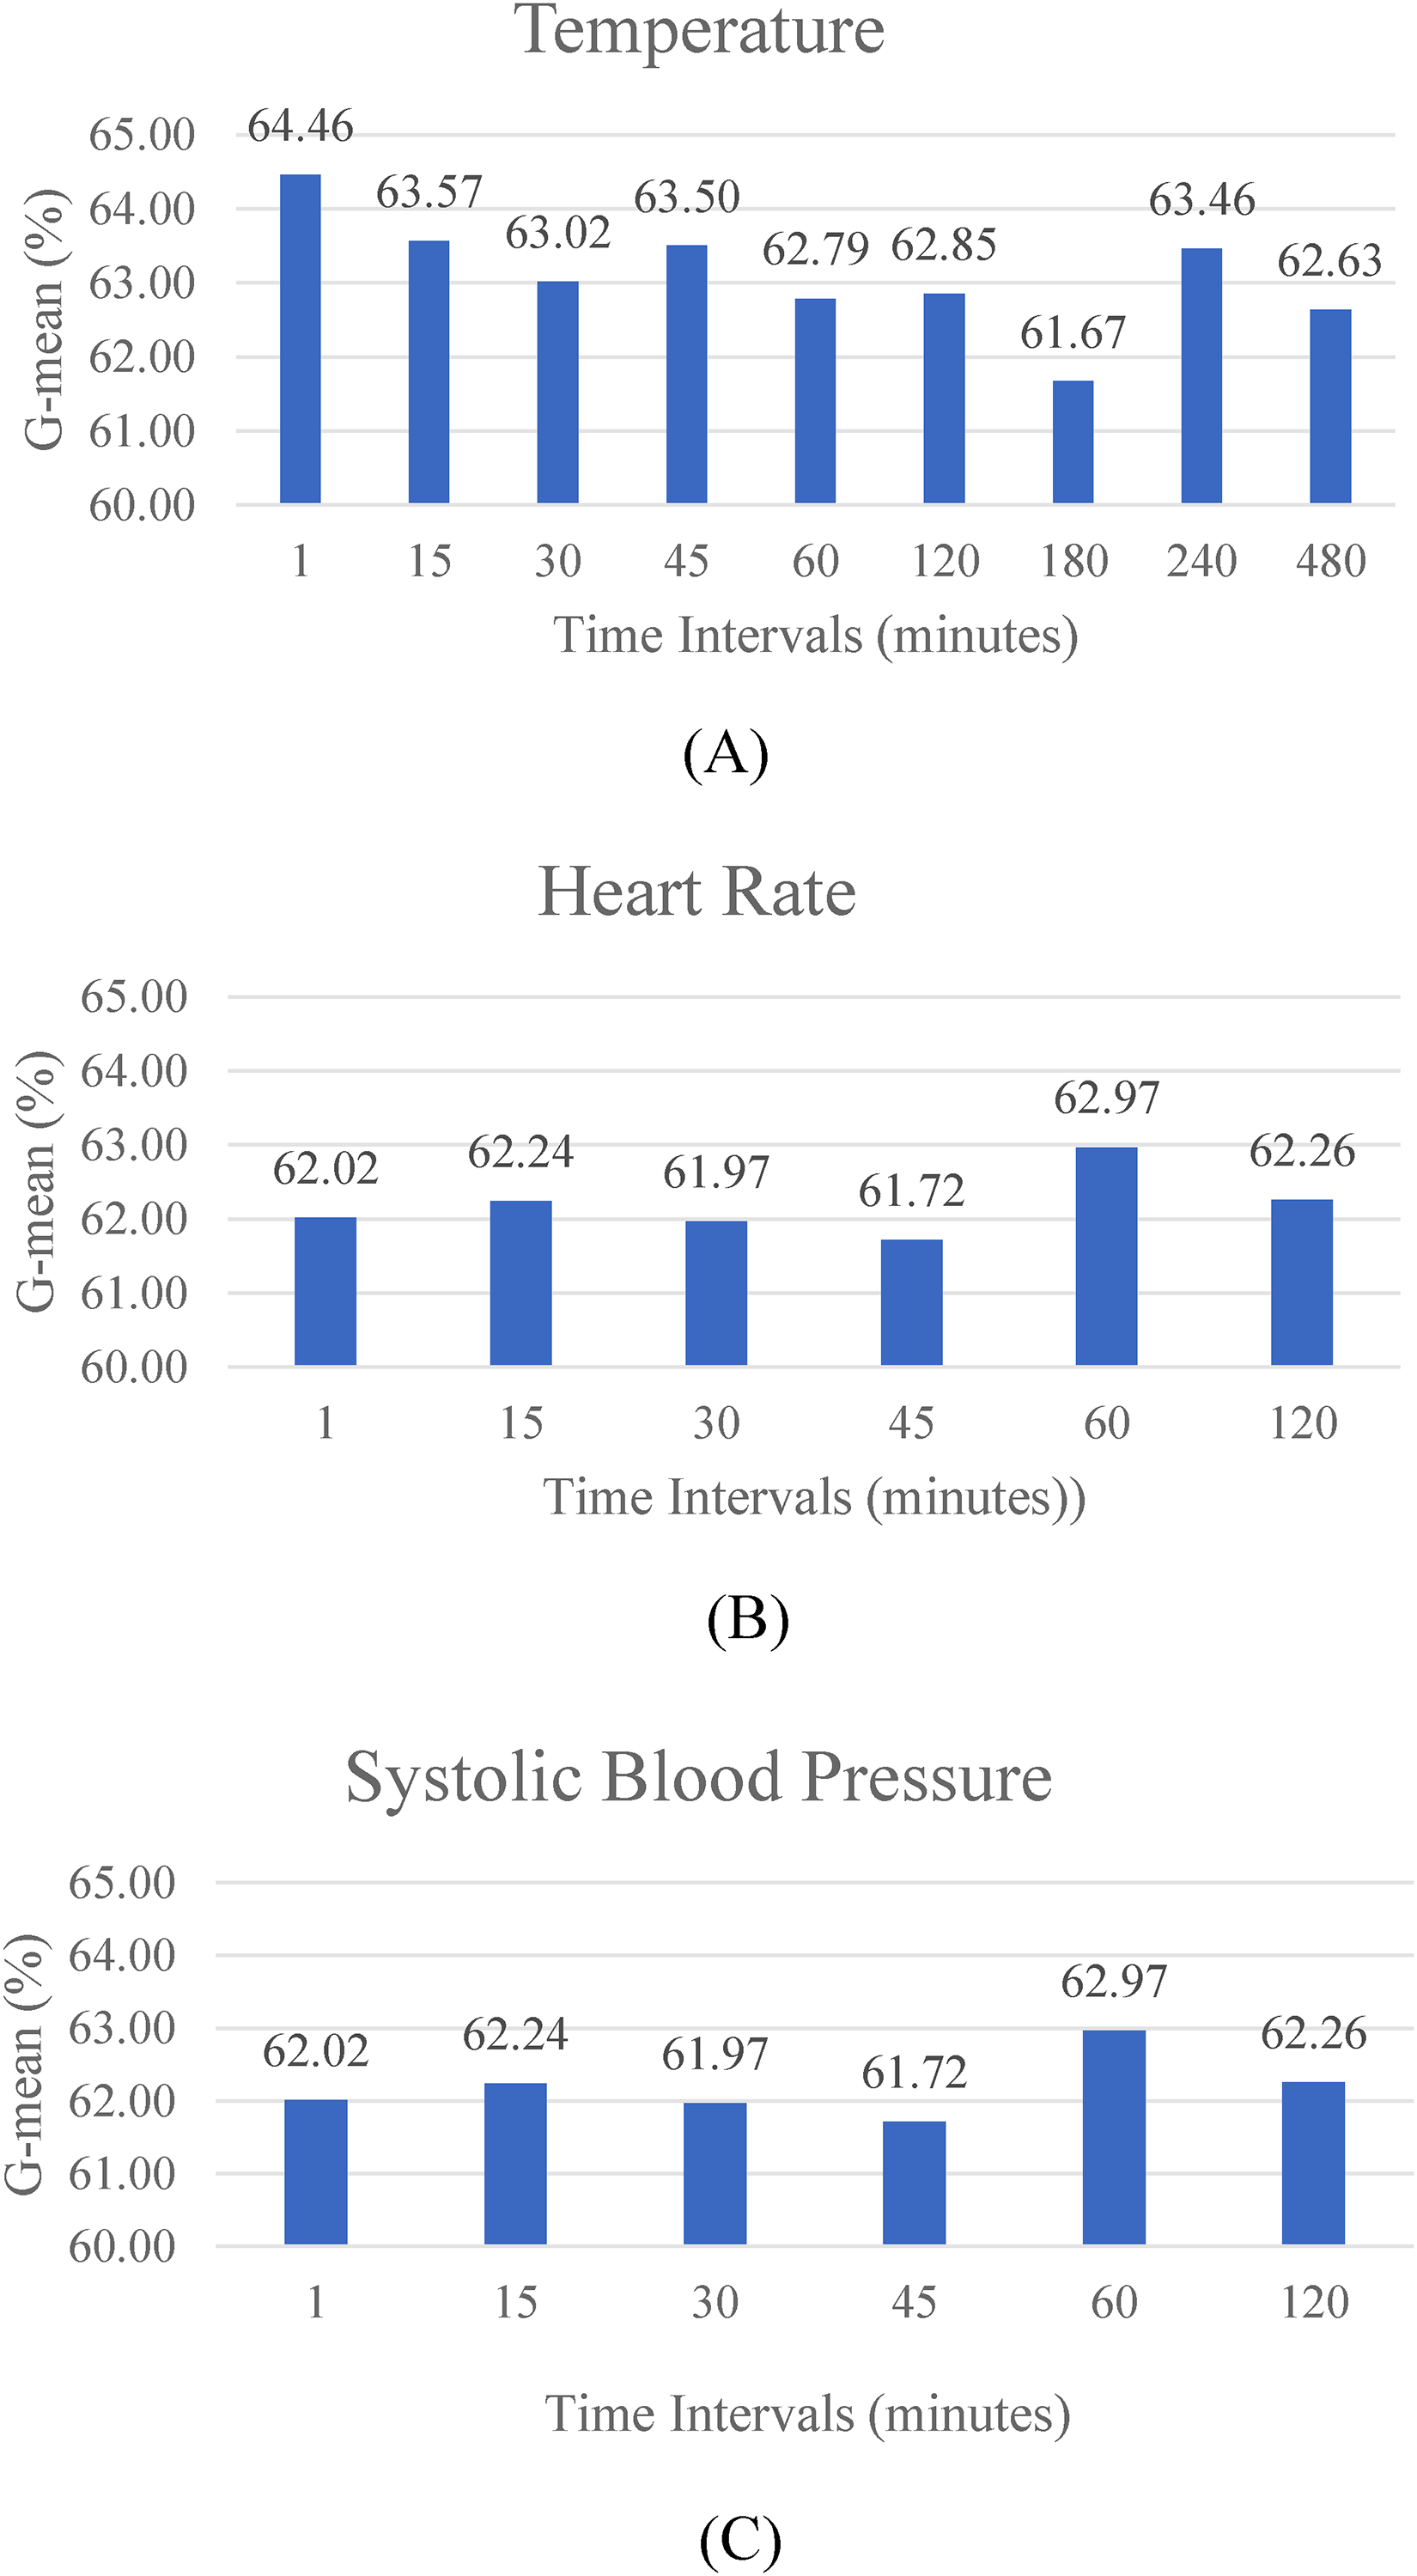
G-means for records evaluation: (A) temperature, (B) heart rate, and (C) systolic blood pressure.
Discussion
The threshold values results from exploration and clinical vSbT criteria
The thresholds of each vital sign vary with the number of days to predict ahead, reflecting VSbT on the MRP with different timeframes. The results indicate that 3-day ahead predictions achieved the highest G-mean, followed by 5-day, 4-day, and finally 7-day ahead predictions. These results are logical because vital signs undergo rapid changes during the final 3 days of life, 67 making data from the 3 days prior to death more challenging for accurate mortality predictions. From a clinical perspective, making decisive predictions based on information gathered more than 3 days before death could be challenging. However, this research shows that specific criteria are linked with mortality through the MRP results.
As shown by the maximum G-mean values in Table 2, the thresholds of three vital signs (temperature, HR, and RR) for 3-day ahead predictions correspond to the SIRS criteria, which denotes HR > 90 beats/minute, Temperature > 38.0 °C, and RR > 20 breaths/minute. These specific thresholds are associated with sepsis-related mortality. 68 Furthermore, previous clinical studies indicated that a fever lasting more than 5 days was associated with an increased risk of mortality, 35 which is consistent with the results of this study. The input for 3-day ahead predictions include recordings from day 3rd to day 6th before death. Additionally, DBP > 110 mmHg indicate grade 3 hypotension criteria and SBP > 130 mmHg is considered high normal.43,44
As shown in Table 3, for 4-day ahead predictions, temperature ≤ 35 °C denotes hypothermia, DBP > 90 mmHg indicates grade 1 hypertension43,44; SBP > 160 mmHg indicates grade 3 hypertension,43,44 HR < 60 beats/minute indicates Tachyarrhythmia and Bradycardia 52 ; and RR < 12 breaths/minute is the beginning triage of abnormal.
As shown in Table 4, the threshold for 5-day ahead predictions has the same SIRS criteria as with 3-day ahead predictions, but a temperature threshold of 40.0 °C is an urgent criterion. 47 DBP >110 mmHg indicates grade 3 hypertension43,44 and SBP < 90 signifies urgent criteria. 47
For 7-day ahead predictions as shown in Table 5, RR > 30 breaths/minute signifies urgent criteria while SBP < 90 mmHg and SpO2 < 80% are criteria for resuscitation. 47 DBP > 110 mmHg indicates grade 3 hypertension.43,44 Temperature ≤ 36.5 °C is the low boundary for normal temperature.
Taking these results as a whole, the thresholds of vital signs in 3-day ahead predictions agree with clinicians’ experiences as reflected in SIRS, which means the indicators for analyzing 3-day ahead mortality are sufficiently clear for use by clinicians. For example, the thresholds for temperature (≥ 38.0°C), HR (> 90 beats/minute), and RR (> 20 breaths/minute) precisely match the SIRS criteria used by clinicians. But for 4-day, 5-day, and 7-day ahead predictions, the indicators for classification differ; there is no available common clinical criterion for VSbT. Therefore, the findings of this study not only validate existing clinical knowledge but also provide novel insights that could inform more temporally clinical decision-making processes.
Various vital signs in day ahead predictions with clinical insight
The DBP > 110 mmHg threshold exhibits the highest performance for 3-day, 5-day, and 7-day ahead predictions, while 4-day ahead predictions have a threshold of DBP > 90 mmHg. Thus, the threshold of DBP > 110 mmHg is an important indicator. The SBP thresholds for the 3-day and 4-day ahead predictions are associated with hypertension, whereas the SBP thresholds for 5-day and 7-day ahead predictions are categorized as urgent criteria. This performance suggests that SBP < 90 mmHg is an indicator for prediction for more than 5 days before death. Furthermore, SBP > 130 is a key determinant for predictions for less than 4 days ahead. The maximum G-mean for SpO2 < 95% was observed in 3-day, 4-day, and 5-day ahead predictions, while SpO2 < 80% represents the maximum G-mean for 7-day ahead predictions, indicating urgent criteria. Therefore, the threshold of SpO2 < 80% could serve as an essential marker for 7-day ahead predictions. Since the thresholds for HR, RR, and temperature exhibit inconsistency across different timeframes, it is reasonable to infer that the importance of these vital signs as indicators changes during end of life. However, this inference needs further investigation.
Temperature event feature effects
The temperature thresholds used to split the dataset for 3-day, 4-day, 5-day, and 7-day ahead predictions were as follows: ≥38.0 °C, ≤35.0 °C, ≥40.0 °C, and ≤36.5 °C, respectively. These thresholds are seen in the results of tests with temperature event features and statistical features in both the high and low subgroups as depicted in Figure 5. For 3-day and 5-day ahead predictions, the thresholds are associated with fever. As a result, temperature event features for the high subgroup and the statistical features for the low subgroup perform the best. Meanwhile, for 4-day ahead predictions, temperature event features for the low-temperature subgroup and statistical features for the high-temperature subgroup perform the best. For 7-day ahead predictions, the threshold is the lower boundary of the normal temperature range. Nevertheless, the best features for this prediction are temperature event features for the low-temperature subgroup and statistical features for the high-temperature subgroup.
As shown in Figure 6, temperature event features are superior for 3-day and 4-day ahead predictions, with G-means of 64.62% and 63.48%, respectively. These results suggest that fever might be related to mortality at least 4 days prior to death, which partially agrees with clinical findings that fever lasting more than 5 days was associated with mortality. 35 However, the temperature event features do not provide useful information for 5-day and 7-day ahead predictions.
Additionally, the top features for both low- and high-temperature subgroups in Table 7 for 3-day and 4-day ahead predictions are the same in two groups: mean diastolic and min diastolic. For 5-day ahead predictions, the top features of both groups are SD SpO2 and max systolic. For 7-day ahead predictions, the highest F-values score of features are min diastolic and mean SpO2. These results indicate that blood pressure and SpO2 combined with temperature event features might be significant indicators of mortality for different timeframes.
Combined features
The results indicate that the LR model was the best choice of classification model. Moreover, the LR model had a significant impact when combined with additional group features. Some models, like SVM (both linear and RBF kernels), DT, and RF, exhibited a decrease in performance when additional group features were included. However, other models, like NB and LR, showed improved performance. Therefore, the benefit of incorporating additional features may depend on the model's ability to handle complex interactions within the data.
LR performed consistently well across both feature sets, particularly excelling in G-mean. The improvement in G-mean with the addition of group features implies that these features provide valuable additional information that enhances the model's discriminative power.
The inclusion of combined features generally had a mixed impact on the models. While some models such as LR benefited from the additional features, other models, particularly SVM (RBF kernel), showed a decrease in performance. The implication is that the utility of additional features depends on how well they contribute to distinguishing between classes. Moreover, some models might be more sensitive to irrelevant or redundant features.
The effect of the least number of vital sign records per day
For large time intervals between measurements, peak points may be lost. As shown in Figure 4, this loss caused a shrinking range of values and a loss of diverse information. As time intervals increase, capturing the true minimum and true maximum values becomes increasingly challenging. For example, in the context of HR and SBP, a 60-minute time-interval still retains some local maximum and minimum points, whereas a 120-minute time interval results in reduced information granularity. This loss of detail can significantly impact the performance of classification models. It particularly affects G-mean values. When considering temperature data, some patients exhibit highly fluctuating temperature signals. Therefore, larger time intervals create a higher risk of missing peak information that could determine whether or not a patient is experiencing fever. These findings have direct implications for care facilities, where staffing constraints often limit the frequency of vital sign measurements. Our analysis suggests that while continuous monitoring would be ideal, obtaining vital signs at strategic intervals could maintain prediction accuracy while remaining feasible within typical care facility workflows.
Contributions and limitations of this study
The novelties and contributions of this study lie in taking into consideration the VSbT effect for MRP. This effect might help provide more information regarding treatment decisions using MRP. As a result of this study, the criteria for VSbT might be either redefined or reassured, which might be an important step forward in our understanding of vital sign changes during the end of life. Better understanding may lead to improvements in palliative care and outcomes. However, MRP should not be used to replace clinicians’ or nursing staffs’ decisions. Instead, MRP can serve as a decision support tool for impending death situations. The criteria acquired through classification trials could be used to (a) verify the currently available heuristics or experiences for determining impending death, and (b) complement current VSbT by providing practical guidelines for different timeframes.
The MRP model used in this study could be integrated into existing clinical workflows, requiring only routine vital signs measurements and basic demographic information. The model can be embedded within electronic health records systems to automatically calculate mortality risk using the identified statistical features, particularly temperature patterns and DBP measurements. This approach could create an early notification system to recognize signs of impending death. Because the model is interpretable and based on clinically familiar thresholds, it aligns with established criteria. This design facilitates potential integration into clinical workflows, for example as a decision-support tool that complements existing scoring systems and could be implemented within electronic health record platforms. Care facilities can allocate resources more efficiently and offer suitable support care for residents. For high-risk residents, the system prompts timely family conversations about goals of care and end-of-life preferences. This approach transforms statistical findings into practical clinical tools that support timely interventions. It also enhances communication about end-of-life care, ultimately improving care quality for care facility residents during their final days.
Our primary motivation was to develop a model that reflects clinical reality rather than simply maximizing statistical performance. The split-group approach explicitly acknowledges that vital signs have different prognostic significance depending on whether VSbT have been applied. This is supported by our analysis, which showed markedly different feature importance rankings between high- and low-threshold groups (Table 7). For example, in 3-day prediction, the highest-ranked feature in the high-temperature subgroup was min diastolic while in the low-temperature subgroup it was mean diastolic. This confirms that the physiological dynamics differ between these groups, supporting separate modeling approaches. We chose not to use deep neural networks despite their potential for higher performance because their operation is often opaque to clinicians. In contrast, our approach used interpretable models like SVM and LR. This decision was driven by the clinical need for transparent decision-making in end-of-life care contexts.
This study used a dataset from eICU-CRD 48 which contains records for over 160,000 patients that were admitted into ICUs. However, it is important to note that the analysis in this study was limited to a subset of the database's population. Specifically, this study focused on patients who had been in an ICU for at least 8 days. These patients may not have received complete palliative care, and their vital signs may have been confounded by life-resuscitation treatments. Additionally, the dataset is derived entirely from a U.S.-based ICU cohort, which may not represent the operational characteristics of care facilities in other countries. Variations in staffing, clinical protocols, and patient populations may limit the generalizability of our findings. In order to strengthen the generalizability of this study's findings, future research should be conducted in long-term care and hospice facilities. Care facilities likely have more variability in VSbT and in treatment outcome compared to ICUs. Care facilities potentially have more incomplete treatment cases and less aggressive interventions. These differences would affect the generalizability of this study's findings regarding the intended application environment. However, a limitation of this study is the absence of external validation on a separate dataset or real-world care facility population. Although our model demonstrates potential, its generalizability remains unconfirmed and warrants further testing in long-term care and hospice populations, where VSbT patterns differ substantially from ICU contexts. Future research should validate these models in actual long-term care and hospice facilities where VSbT patterns differ substantially from ICU environments. Additionally, this study encountered limitations with the data quality and number of records. The records found in the “nurseChart” table were often unevenly measured and sparse, which limited the number of usable records. This required us to select only samples that contained enough records for processing, resulting in a final dataset of 2277 patients. As a result, The smaller number of usable records might have affected the accuracy and reliability of this study's results because only samples with a sufficient number of records were included. Future studies should consider implementing data cleaning and preprocessing techniques to address these inconsistencies, potentially leading to more precise and dependable findings.
This study provides further evidence for the importance of considering VSbT effects in MRP. The improved performance of the split approach, which accounts for VSbT by analyzing subgroups based on clinically relevant thresholds, demonstrates that these interventions create distinct risk profiles. These findings align with the findings in other studies. For example, Wu et al. 37 demonstrated that explicitly modeling vasopressor intervention timing improved outcome predictions in ICU patients. Similarly, Ghassemi et al. 39 showed that switching state space models accounting for intervention events performed well. These studies, along with clinical findings that aggressive fever management can increase mortality in septic patients, support the approach of splitting datasets at clinically relevant thresholds which allow better capture of distinct physiological dynamics and improved prediction accuracy.
Conclusion
In this study, MRP based on VSbT effect was proposed. To clarify the VSbT effect, various thresholds were evaluated. The threshold evaluation results demonstrate that utilizing specific vital sign thresholds improves predictive performance across 3-day, 4-day, 5-day, and 7-day ahead predictions, with the highest G-mean achieved for each prediction timeframe varying based on the threshold used. Splitting the dataset can improve the performance of MRP. The proposed classifier approach achieved a G-mean of 64.62%, compared with a G-mean of 63.07% for the non-split approach for 3-day ahead predictions. The temperature event features contributed to the improvement of classification performance in 3-day and 4-day ahead predictions. The 3-day predictions achieved the highest performance followed by 5-day, 4-day, and 7-day predictions. This study offers clear evidence of the effect that VSbT has on predictions. However, the accuracy of VSbT should be tested in long-term care and hospice care settings before its adoption in palliative care settings.
Supplemental Material
sj-docx-1-dhj-10.1177_20552076251382025 - Supplemental material for Exploring the feasibility of vital signs-based mortality risk prediction in a care facility setting
Supplemental material, sj-docx-1-dhj-10.1177_20552076251382025 for Exploring the feasibility of vital signs-based mortality risk prediction in a care facility setting by Waranrach Viriyavit, Somrudee Deepaisarn, Virach Sornlertlamvanich, Patama Gomutbutra and Wenwei Yu in DIGITAL HEALTH
Supplemental Material
sj-docx-2-dhj-10.1177_20552076251382025 - Supplemental material for Exploring the feasibility of vital signs-based mortality risk prediction in a care facility setting
Supplemental material, sj-docx-2-dhj-10.1177_20552076251382025 for Exploring the feasibility of vital signs-based mortality risk prediction in a care facility setting by Waranrach Viriyavit, Somrudee Deepaisarn, Virach Sornlertlamvanich, Patama Gomutbutra and Wenwei Yu in DIGITAL HEALTH
Supplemental Material
sj-docx-3-dhj-10.1177_20552076251382025 - Supplemental material for Exploring the feasibility of vital signs-based mortality risk prediction in a care facility setting
Supplemental material, sj-docx-3-dhj-10.1177_20552076251382025 for Exploring the feasibility of vital signs-based mortality risk prediction in a care facility setting by Waranrach Viriyavit, Somrudee Deepaisarn, Virach Sornlertlamvanich, Patama Gomutbutra and Wenwei Yu in DIGITAL HEALTH
Footnotes
Acknowledgments
The authors acknowledge the use of the eICU database for providing the dataset used in this study.
ORCID iDs
Ethical approval
Ethical approval is not required for this publication.
Contributors
WV and WY conceived and conducted the experiments associated with this study. WV, WY, and PG analyzed the results. WY and VS provided resources for this study. WV and WY wrote the original draft. WY, SD, VS, and PG revised and finalized the manuscript. All authors contributed to the article and approved the submitted version.
Funding
The authors received no financial support for the research, authorship, and/or publication of this article.
Declaration of conflicting interests
The authors declared no potential conflicts of interest with respect to the research, authorship, and/or publication of this article.
Supplemental material
Supplemental material for this article is available online.
References
Supplementary Material
Please find the following supplemental material available below.
For Open Access articles published under a Creative Commons License, all supplemental material carries the same license as the article it is associated with.
For non-Open Access articles published, all supplemental material carries a non-exclusive license, and permission requests for re-use of supplemental material or any part of supplemental material shall be sent directly to the copyright owner as specified in the copyright notice associated with the article.