
Abstract
Objective
Chronic kidney disease (CKD) poses a major global health burden. Early CKD risk prediction enables timely interventions, but conventional models have limited accuracy. Machine learning (ML) enhances prediction, but interpretability is needed to support clinical usage with both in diagnostic and decision-making.
Methods
A cohort of 491 patients with clinical data was collected for this study. The dataset was randomly split into an 80% training set and a 20% testing set. To achieve the first objective, we developed four ML algorithms (logistic regression, random forests, neural networks, and eXtreme Gradient Boosting (XGBoost)) to classify patients into two classes—those who progressed to CKD stages 3–5 during follow-up (positive class) and those who did not (negative class). For the classification task, the area under the receiver operating characteristic curve (AUC-ROC) was used to evaluate model performance in discriminating between the two classes. For survival analysis, Cox proportional hazards regression (COX) and random survival forests (RSFs) were employed to predict CKD progression, and the concordance index (C-index) and integrated Brier score were used for model evaluation. Furthermore, variable importance, partial dependence plots, and restrict cubic splines were used to interpret the models’ results.
Results
XGBOOST demonstrated the best predictive performance for CKD progression in the classification task, with an AUC-ROC of 0.867 (95% confidence interval (CI): 0.728–0.100), outperforming the other ML algorithms. In survival analysis, RSF showed slightly better discrimination and calibration on the test set compared to COX, indicating better generalization to new data. Variable importance analysis identified estimated glomerular filtration rate, age, and creatinine as the most important predictors for CKD survival analysis. Further analysis revealed non-linear associations between age and CKD progression, suggesting higher risks in patients aged 52–55 and 65–66 years. The association between cholesterol levels and CKD progression was also non-linear, with lower risks observed when cholesterol levels were in the range of 5.8–6.4 mmol/L.
Conclusions
Our study demonstrated the effectiveness of interpretable ML models for predicting CKD progression. The comparison between COX and RSF highlighted the advantages of ML in survival analysis, particularly in handling non-linearity and high-dimensional data. By leveraging interpretable ML for unraveling risk factor relationships, contrasting predictive techniques, and exposing non-linear associations, this study significantly advances CKD risk prediction to enable enhanced clinical decision-making.
Keywords
Background
Chronic kidney disease (CKD) poses a significant global burden, with an estimated annual death toll of over 5 million by the year 2040. 1 This prevalence is mainly attributed to the fact that CKD often remains asymptomatic, making it challenging to detect and diagnose in a timely manner. 2 According to the World Health Organization (WHO), in 2019, kidney diseases account for 1.7 million years of life lived with disability, equivalent to 168 YLDs per 100,000 population, and its prevalence continues to surge, particularly among elderly individuals and those afflicted by coexisting conditions such as diabetes and hypertension. 3
The timely and accurate prediction of incident CKD risk holds profound clinical significance, as it empowers healthcare practitioners to implement effective preventive measures and ensure optimal patient outcomes. 4 Early identification of individuals at heightened risk of developing CKD enables targeted interventions, aimed at arresting disease progression, averting complications, and easing the burden on healthcare systems. 5 Moreover, proactive management of high-risk patients may lead to enhanced therapeutic efficacy and potential cost reductions associated with the management of advanced CKD cases. 6
Traditional CKD risk prediction models have traditionally relied on clinical factors such as age, gender, blood pressure (BP), and laboratory results, which, although informative, exhibit limitations in predictive accuracy and risk assessment comprehensiveness.7,8 These conventional models may inadvertently overlook critical risk contributors that could significantly impact disease progression and patient outcomes. 9 In response to these challenges, recent advancements in machine learning (ML) techniques have demonstrated immense promise across various medical domains, particularly in the field of disease risk prediction, including CKD and acute kidney injury.10–12 ML models possess the unique ability to discern intricate patterns and associations hidden within vast and diverse datasets, allowing for a more comprehensive understanding of CKD risk factors, and enhancing the precision of risk assessments. 11 By leveraging ML's computational power, we can potentially improve the predictive capabilities of CKD risk models, and with high accurate prediction, offering a more holistic and personalized approach to patient care and early intervention strategies.13,14
However, the predominant focus on predictive accuracy has led to complex black-box models lacking in interpretability, and the growing adoption of ML models has also raised concerns regarding their interpretability and transparency, particularly in healthcare settings. 15 This poses barriers to clinical adoption, as trust necessitates some level of explainability. To address this challenge, an emerging paradigm of interpretable ML strives to balance performance with transparency. 16 A myriad of techniques facilitates model interpretation, from visualizing decision rules and feature importance to approximating complex models with simpler surrogates. 17 When applied judiciously in clinical studies, interpretable ML can elucidate predictive patterns and relationships within patient data. 18 For instance, partial dependence plots (PDPs) can reveal non-linear associations between risk factors and outcomes. Such transparency uncovers actionable insights to guide clinical decision-making while avoiding reliance on inscrutable models. 19 Interpretable ML represents a nascent but active field with immense potential to bridge the gap between predictive analytics and clinical implementation. These interpretable models offer valuable insights into the underlying factors contributing to risk assessments, thereby empowering clinicians to make informed decisions based on actionable information. Interpretable ML models for CKD risk prediction remain an open challenge needing further research. Progress in this area can lead to clinically useful tools that improve CKD management.
This study makes several novel contributions through the in-depth investigation and evaluation of interpretable ML models for predicting CKD progression risk. We compare multiple algorithms for CKD classification, demonstrating eXtreme Gradient Boosting (XGBoost)'s superior performance. For predicting CKD progression, we evaluate and contrast Cox regression and random survival forests (RSFs), showcasing ML's advantages for survival analysis. By utilizing interpretable models, we gain insights into non-linear relationships between variables like age, cholesterol, and CKD risk. External validation of predictive models on new data is vital for further improving generalizability. Our research aims to advance CKD risk stratification through accurate and interpretable models, enabling tailored interventions and enhanced CKD management. The deployment of such models holds promise for optimizing healthcare resources and improving patient outcomes.
Methods
Study design
This hospital-based cross-sectional study aims to investigate the application of interpretable ML techniques for predicting the progression of CKD to stages 3–5 in a well-defined patient population. The study design was carefully selected to assess the feasibility and use interpretable ML models to assess CKD risk and compare their performance in survival analysis.
Data source and study population
Data for this study were obtained from the electronic medical records of 491 patients collected at Tawam Hospital, located in Al-Ain city, Abu Dhabi, United Arab Emirates, the full dataset covers patients from 1 January 2008 to 31 December 2008, with up to 10 years of follow-up based on the 2018 publication. 20 The hospital's electronic medical record system provided access to a rich and comprehensive dataset, which was made available for research purposes. The study population consisted of 491 consecutive patients who were either diagnosed with cardiovascular disease (CVD) or presented with a high CVD risk. CVD patients were included in this study due to the close association between CVD and CKD. Previous research indicates CVD is both a risk factor for and complication of CKD, underscoring the value of studying this patient population for enhanced understanding of CKD progression. Each patient's electronic medical record included a collection of 21 essential clinical variables, representing a wide range of laboratory test results, examination findings, and pertinent medical history. The dataset was de-identified to ensure patient confidentiality, and the study protocol received ethical approval from both the Tawam Hospital and the United Arab Emirates University Research and Ethics Board. 20
Predictors and outcome
The study cohort consisted of 491 consecutive patients with available medical records, each encompassing a chart of 13 pertinent clinical variables, comprising laboratory test results, examination findings, and historical medical data (Table 1). We conducted an extensive evaluation of ML models to assess their feasibility and accuracy in identifying CKD risk, employing a dataset comprising diverse predictor variables. The predictor variables comprised essential clinical and demographic factors, including “Sex,” “Age Baseline,” “History Diabetes,” “History CHD” (coronary heart disease), “History Vascular,” “History Smoking,” “History HTN” (hypertension), “History DLD” (dyslipidemia), “History Obesity,” “DLD meds” (medication for dyslipidemia), “DM meds” (medication for diabetes), “HTN meds” (medication for hypertension), “ACEIARB” (angiotensin-converting enzyme inhibitors-ACEI or angiotensin II receptor blockers-ARB), “Cholesterol Baseline,” “Creatinine Baseline,” “eGFR Baseline” (estimated glomerular filtration rate), “sBP Baseline” (systolic blood pressure), “dBP Baseline” (diastolic blood pressure), “BMI Baseline” (body mass index), and “Time To Event “ (time to the occurrence of the event).
Baseline information of study patients.

Note: CKD: chronic kidney disease; CHD: coronary heart disease; DM: diabetes mellitus; HTN: hypertension; ACEI: angiotensin-converting enzyme inhibitors; ARB: angiotensin II receptor blockers; BMI: body mass index; eGFR: estimated glomerular filtration rate; SBP: systolic blood pressure; DBP: diastolic blood pressure.
The primary outcome of interest, “EventCKD35,” pertains to the development of CKD within the follow-up period. The staging of CKD is predominantly based on the estimated glomerular filtration rate (eGFR), which quantifies the kidney's ability to effectively filter waste from the blood. The stages are classified as Stage 1 CKD, Stage 2 CKD, Stage 3 CKD, Stage 4 CKD, and Stage 5 CKD. 21 Stage 3–5 represents the severe stage of CKD, indicating kidney failure, and patients are likely to experience more severe symptoms and complication, necessitate kidney replacement therapy through dialysis or transplantation.
In our study, the primary objective is to predict the risk of progression of CKD to stages 3 to 5, and the survival risk to CKD progression based on the “EventCKD35” outcome. By leveraging a diverse set of predictor variables and employing advanced ML methodologies, our research endeavors to contribute novel insights into the accurate identification and risk stratification of CKD stages, which could profoundly impact clinical decision-making and patient management strategies in the context of CKD.
Model development
Before develop model to prediction, the dataset was checked for any duplicated or incomplete entries, which were removed. For missing values, median or mean imputation was used for continuous variables and mode imputation for categorical variables given the low missingness rate (∼1–3%). No explicit noise removal techniques were applied since the data originated from standard clinical measurements.
The objectives of this study are twofold: firstly, to discriminate the outcomes of CKD stages 3 to 5 (EventCKD35) based on clinical data, and secondly, to predict the risk of patients progressing to CKD stages 3 to 5, utilizing the available follow-up data.
To achieve first objective, we randomly allocated patients to either a development dataset or a test dataset using an 8 : 2 sample ratio, where the development dataset comprised both training and validation data. Prior to model training, all continuous variables were normalized post-splitting to prevent information leakage and ensure fair application across the training, validation, and test datasets. For the classification task, we considered four different ML algorithms: linear regression (LM), random forests (RF), neural networks (NNET), and XGBOOST. To reduce the impact of data partitioning variability, each iteration involved random sampling with different seeds from the observational data. After obtaining the final models, we thoroughly evaluated, compared, and reported their predictive performance on the test dataset. Employing 10-fold cross-validation, we computed average values from 10 different partitions to minimize sensitivity to random data splits and yield more robust performance estimates. For the ML classification models, all clinical variables, except time-related factors, were used as input, while the dependent variable was set to EventCKD35 (CKD stages 3 to 5).
Secondly, given the recorded follow-up time for patients progressing to CKD3–5, survival analysis models were also employed to predict the risk of progression. For the survival analysis task, we utilized two algorithms: Cox regression (Cox) and RSF. The Cox regression model is well-suited for survival analysis due to its ability to handle censored data efficiently and accommodate time-varying covariates. 22 Its flexible assumption of proportional hazards allows for a wide range of applications and robustness to multicollinearity, providing reliable predictions and personalized risk assessments. 23 However, the Cox regression model relies on the assumption of proportional hazards, which may not always hold true and could lead to biased results. Moreover, it does not directly estimate survival probabilities and lacks information about the shape of the survival curve, making it less suitable for predicting exact survival times. On the other hand, RSFs models offer advantages in handling survival data. As an extension of traditional RFs to address survival data, RSF excels at handling high-dimensional datasets and capturing complex interactions among predictors. 24 Unlike traditional parametric survival models, RSF does not impose strong assumptions on the underlying distribution of survival times, enhancing its flexibility and applicability to various data types. RSFs provide a powerful and versatile tool for researchers aiming to analyze survival data in a non-parametric and data-driven manner. 25
For survival analysis, we first conducted univariate Cox regression analysis on the entire dataset to assess the associations between each clinical variable and survival outcomes. Variables with a significant correlation (p < 0.05) with survival were considered potential predictive factors and were subsequently included in the multivariate Cox proportional hazards (Coxph) model. Next, to compare the predictive accuracy of the Cox regression model with RSF, we incorporated the variables significantly correlated with survival (p < 0.05) and randomly allocated patients to the development and test datasets using an 8:2 sample ratio. To evaluate the predictive performance of the models, we employed cross-validation techniques and assessed the model performance on the test dataset. Therefore, this study constituted a regression problem based on time-to-event (censored) data.
Model evaluation and interpretability
For the classification task, the model's performance on the testing set was assessed by calculating the area under the receiver operating characteristic curve (AUC-ROC) and its corresponding 95% confidence interval (CI). 26 The ROC curve is a graphical representation of the model's ability to discriminate between different classes by varying the classification threshold. It is constructed by plotting the true positive rate (sensitivity) against the false positive rate (1-specificity) for different threshold values. The AUC-ROC value ranges from 0 to 1, where a value of 0.5 indicates random performance, and a value of 1 represents perfect discrimination between the classes.
In the context of survival analysis models, we employed the C-index and integrated Brier score (IBS) to assess model predictive performance. 27 The C-index measures the proportion of correctly ordered pairs of predicted and actual survival times among all possible subject pairs. It ranges from 0 to 1, where 0.5 signifies random predictions, and 1 indicates perfect concordance between predicted and observed survival times. A C-index of 0.5 implies that the model performs no better than chance in predicting survival outcomes, while a value greater than 0.5 indicates some predictive ability, with a C-index approaching 1 representing strong predictive performance. On the other hand, the IBS combines calibration and discrimination aspects and quantifies the overall model calibration by comparing predicted survival probabilities with actual survival outcomes at various time points. Lower IBS values indicate better model calibration and higher prediction ability compared to models with higher IBS values.
Assessing variable importance is crucial in evaluating the significance of input features in ML models. The caret package for R utilizes distinct techniques for each algorithm to calculate variable importance. 28 For RF models, the mean decrease in accuracy method is employed, wherein each feature's contribution is measured by randomly permuting its values and observing the subsequent decrease in model accuracy.29,30 The average decrease across all trees in the forest determines the final importance score for each feature. Higher importance scores indicate more pivotal features considered by the ML model, providing valuable insights into feature significance, and aiding in model interpretability.
To interpret the impact of individual features on predicted outcomes, we employed the PDP technique in ML model interpretation.19,30 PDP provides a comprehensive understanding of the relationship between the target variable and a specific input feature while holding other features constant at predetermined values. By plotting the selected feature's values against the corresponding predictions, PDP illustrates the partial effect of the feature on the target variable, revealing insights into its influence and potential interactions with other features. PDPs serve as valuable tools for model transparency and explainability, enhancing model understanding and supporting decision-making in complex ML applications.
In time-to-event analysis, dealing with covariates exhibiting challenging functional forms, time-dependent effects, and interaction structures necessitates the implementation of restrict cubic splines (RCS).31,32 RCS captures non-linear associations between continuous predictors and binary outcomes by replacing continuous predictors with piecewise cubic functions, smoothly joined at specific knots. The “restrict” attribute limits the spline's linearity beyond boundary knots, preventing extreme extrapolations outside the observed data range. The number and positions of knots are often determined by quantiles of the predictor variable's distribution. RCS models were employed to evaluate potential non-linear associations between hazard ratios (HRs) and covariates, accommodating the complex relationship patterns in survival analysis.
Statistical analysis
Continuous variables underwent the Kolmogorov–Smirnov test to assess the normality of their distribution. Normally distributed data were compared using the t-test, while non-normally distributed data were compared using the Mann–Whitney U test. For binary classification tasks, we employed the caret package in R, employing various ML algorithms, including linear regression (glm), random forests (randomForest), neural networks (nnet), and XGBoost (XGBOOST). Survival data were visualized using Kaplan–Meier (KM) curves, with median survival estimates, and further analyzed using Cox proportional hazards regression (survival). Additionally, RFs survival analysis was conducted using the randomForestSRC package. The R Statistics software version 4.2.2 (R Foundation for Statistical Computing, Vienna, Austria) was used for statistical analyses.
Results
Baseline clinical characteristics
A total of 491 patients’ clinical data were collected for this study. Among them, 241 (49.1%) were female, and 250 (50.9%) were male, with an average age of 53.2 years. Out of these patients, 56 (11.4%) progressed to CKD stages 3 to 5. Common comorbidities included hypertension, diabetes, and coronary heart disease (CHD). Specifically, 215 (43.7%) patients had a history of CHD, and 75 (15.2%) had a smoking history. Detailed information is presented in Table 2. Notably, age showed a significant difference (p < 0.001), with patients who progressed to CKD stages 3 to 5 having a higher mean age (62.2 years) compared to those who did not (52.0 years). Other variables with notable differences included History Diabetes (p < 0.001), History CHD (p < 0.001), History Vascular (p = 0.036), History Smoking (p = 0.051), History HTN (p < 0.001), History DLD (p = 0.002), DLD meds (p < 0.001), DM meds (p < 0.001), ACEIARB (p < 0.001), Cholesterol (p = 0.002), Creatinine (p < 0.001), eGFR (p < 0.001), sBP (p = 0.017), and Time To Event months (p < 0.001).
Baseline characteristics of participants with and without follow-up chronic kidney disease (CKD) progression.

Notes: categorical variables are coded as No for 0 and Yes for 1. In addition, categorical variables are expressed in terms of frequencies and percentages (N(proportion)), and continuous variables are expressed in terms of means and standard deviations (Mean(sd)). CKD: chronic kidney disease; CHD: coronary heart disease; DM: diabetes mellitus; HTN: hypertension; ACEI: angiotensin-converting enzyme inhibitors; ARB: angiotensin II receptor blockers; BMI: body mass index; eGFR: estimated glomerular filtration rate; SBP: systolic blood pressure; DBP: diastolic blood pressure.
Machine learning models for CKD classification
We employed six ML models to predict CKD outcomes based on patients’ clinical characteristics and medical history. Notably, the XGBoost model demonstrated the best performance in predicting CKD progression, with an AUC of 0.867 (95% CI: 0.728–0.100) on the testing set. This outperformed the RF model, which achieved an AUC of 0.834 (95% CI: 0.676–0.983), as well as the LM and NNET models with AUCs of 0.787 (95% CI: 0.621–0.952) and 0.5 (95% CI: 0.318–0.682), respectively (Figure 1). These results indicate that the XGBoost model exhibits higher accuracy and reliability in predicting CKD progression.

Area under the receiver operating characteristic curve (AUC-ROC) with 95% CI in the training and testing sets for the different trained models in classification of CKD. LM: logistic regression, RF: random forests, NNET: neural networks, and XGBOOST: eXtreme Gradient Boosting. CKD: chronic kidney disease; CI: confidence interval.
Variable importance and interpretability in XGBOOST
Furthermore, by comparing the variable importance across the different models, we identified the most significant clinical features contributing to the prediction of CKD outcomes. Among these, three key clinical variables were identified as the most influential in CKD progression: eGFR, age, and creatinine (Figure 2). These findings offer valuable insights into the pivotal clinical factors influencing CKD progression and contribute to enhanced understanding and management of the disease.

Relative importance ranking of each input variable for prediction of CKD in the machine learning algorithms. (a) Logistic regression. (b) Random forest. (c) Neural network. (d) Extreme gradient boosting. CHD: coronary heart disease; DM: diabetes mellitus; HTN: hypertension; ACEI: angiotensin-converting enzyme inhibitors; ARB: angiotensin II receptor blockers; BMI: body mass index; eGFR: estimated glomerular filtration rate; SBP: systolic blood pressure; DBP: diastolic blood pressure; CKD: chronic kidney disease.
Subsequently, we utilized interpretable ML models to delve deeper into the relationships between the variables, namely eGFR, age, and creatinine, and their marginal effects on predicting CKD outcomes. The results revealed that age exhibited a non-linear relationship with CKD progression, with patients aged 52–55 and 65–66 years showing a higher risk of experiencing CKD progression among our study's population. As cholesterol levels increased, the risk of CKD progression decreased. However, when cholesterol levels fell within the range of 5.8–6.4 mmol/L, the likelihood of CKD progression was less than 5%. This implies that higher cholesterol levels may be associated with a lower risk of CKD progression. Nonetheless, it is crucial to note that when cholesterol levels are within a specific range, the risk of CKD progression might increase (Figure 3).
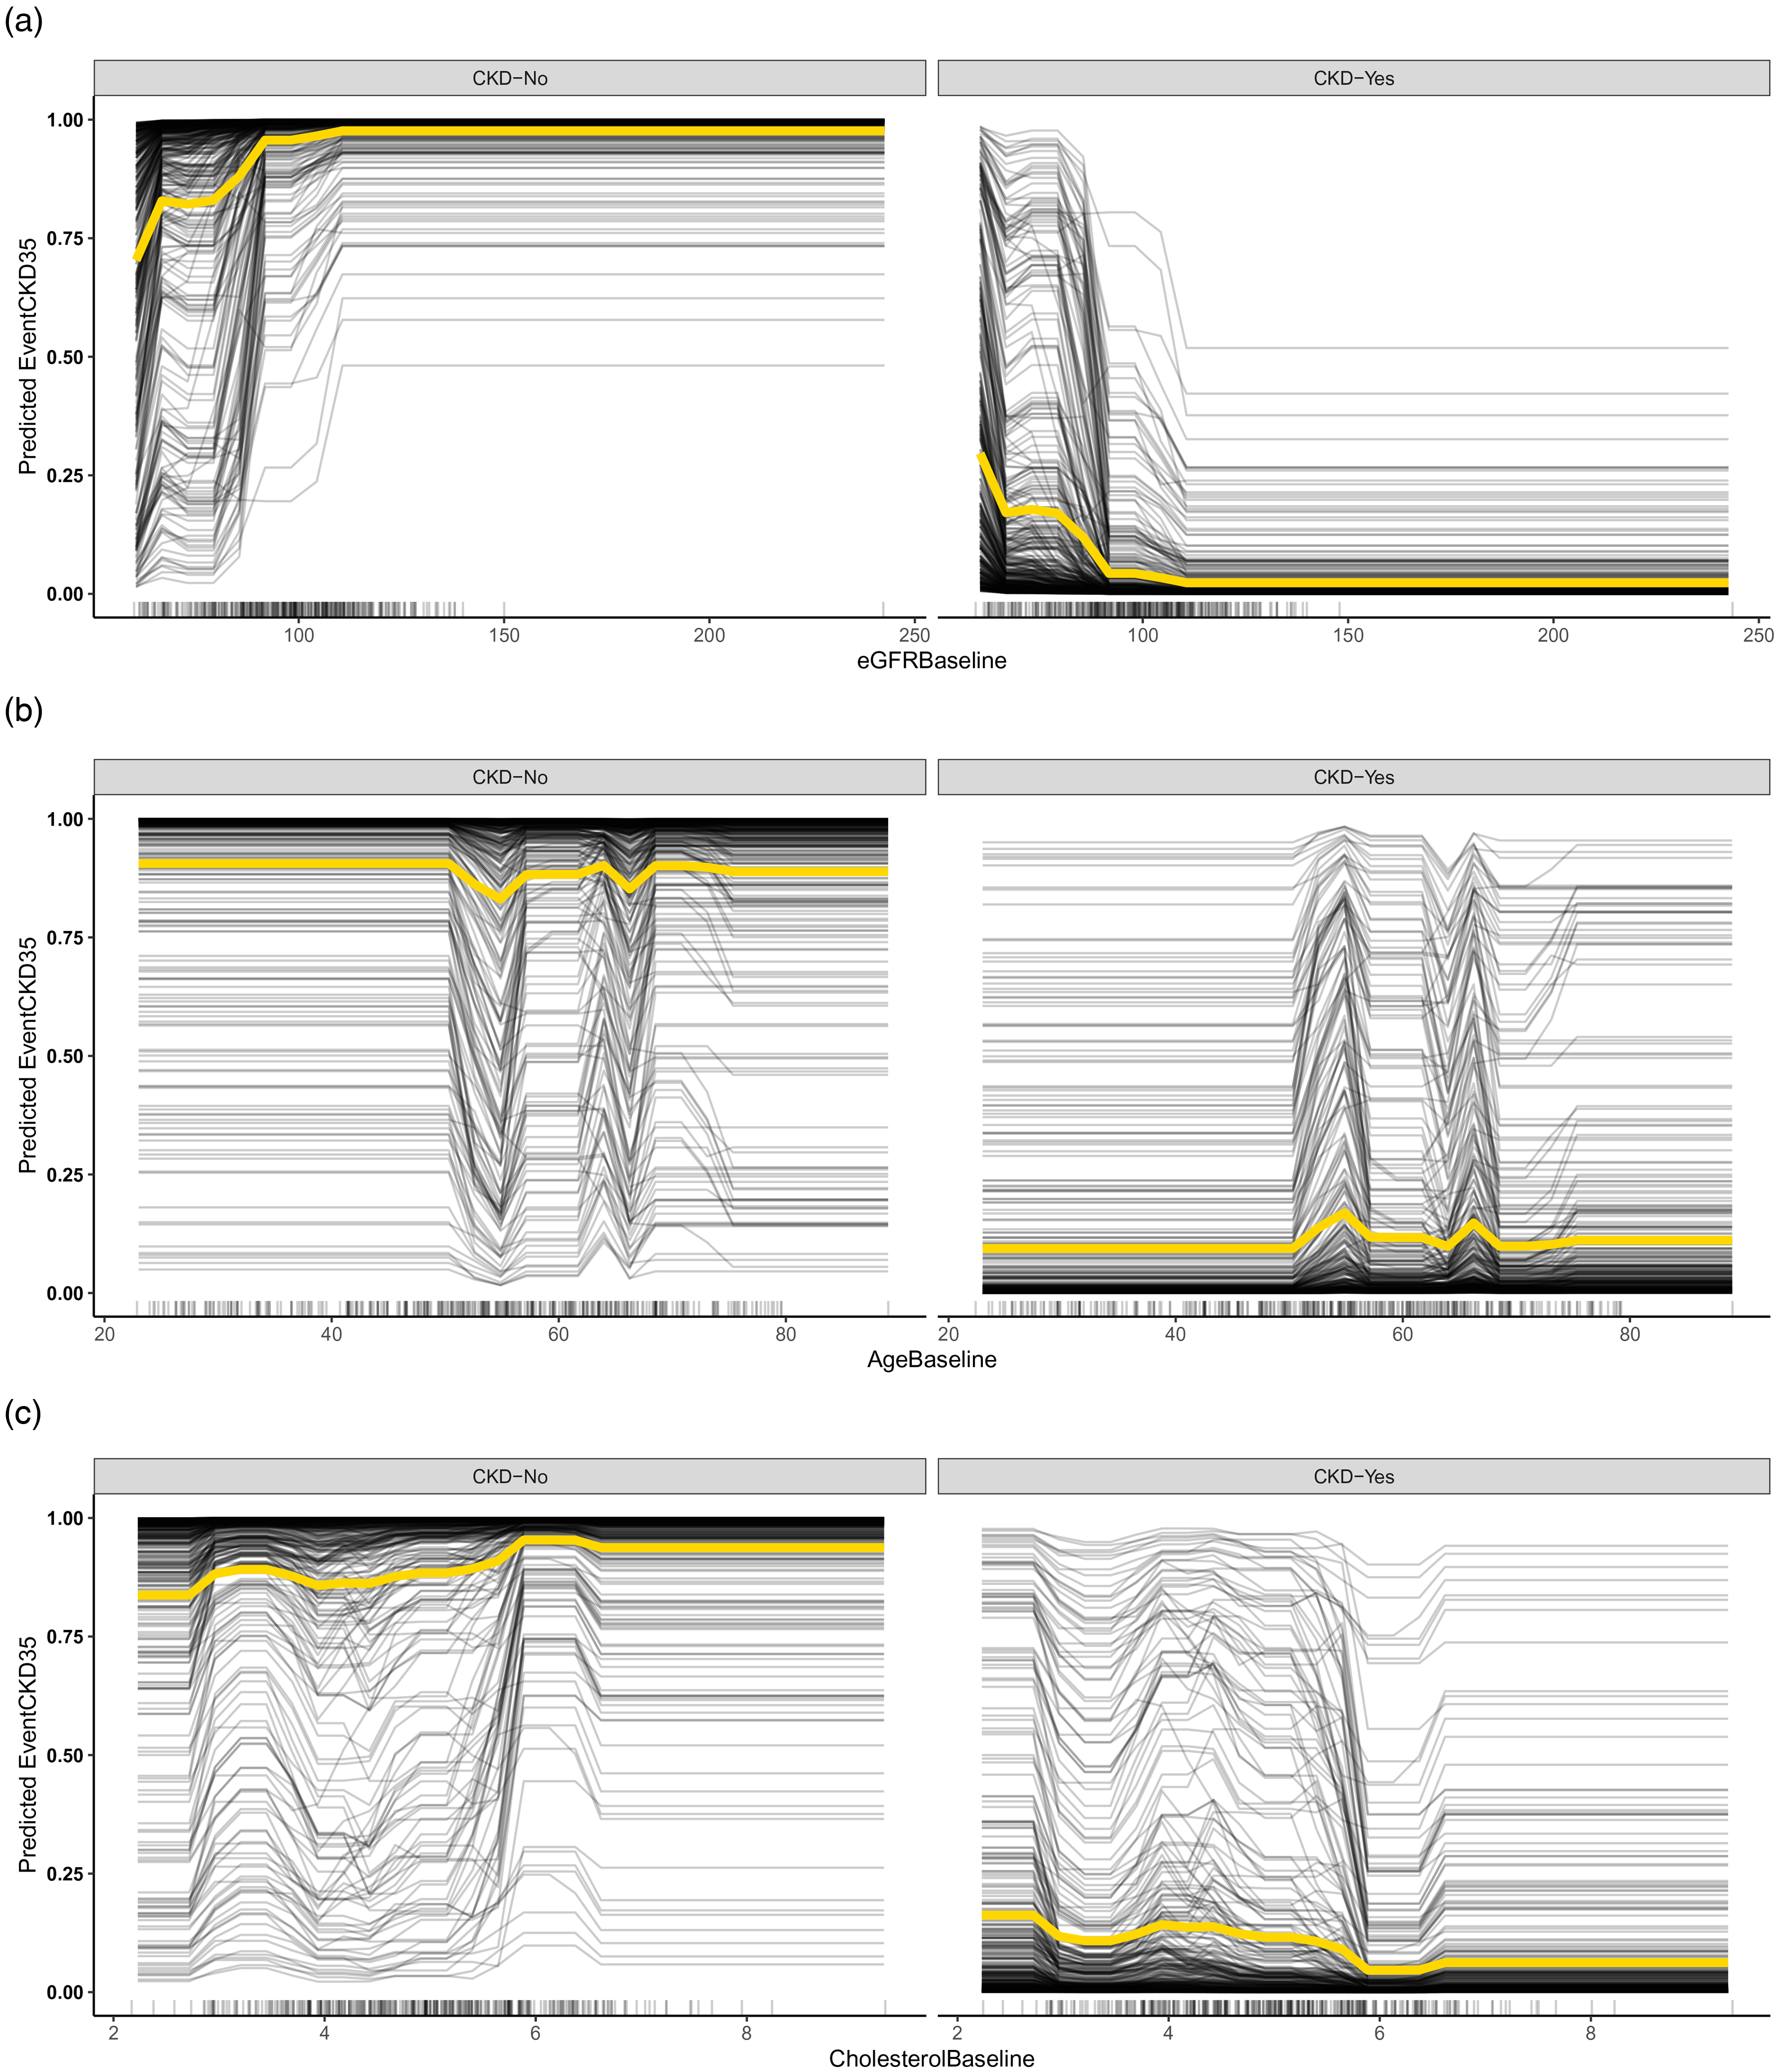
Dependence plots of eGFR, age, and creatinine, and their marginal effects on predicting CKD outcomes based on XGBOOST model, black line displays one line per instance that shows how the individual prediction changes with feature, and yellow line shows the main effect of the feature and ignores possible feature interactions. CKD: chronic kidney disease.
Machine learning models for CKD survival analysis
In our study, we conducted a univariate screening, and factors with p < 0.05 were included in our COX model for predicting CKD progression. Notably, the variables “History Obesity,” “dBP Baseline,” and “BMI Baseline” demonstrated no statistically significant association in the univariate COX regression analysis. Subsequently, we incorporated the remaining 16 factors into the COX model, and the Schoenfeld residual test (p > 0.05) confirmed that the model satisfied the proportional hazards assumption. Among the variables considered, “DLD meds” exhibited a HR of 3.06 (95% CI: 1.158–8.1), indicating that it was a significant risk factor for CKD progression. Similarly, “History Smoking” demonstrated a HR of 2.4 (95% CI: 1.125–5.1), indicating its significance as a risk factor in CKD progression (Table 3).
Univariable and multivariable hazards ratios (HRs) and 95% confidence intervals (95% CI) of predictors for developing CKD stages 3–5 in COX model.

Note: CKD: chronic kidney disease; CHD: coronary heart disease; DM: diabetes mellitus; HTN: hypertension; ACEI: angiotensin-converting enzyme inhibitors; ARB: angiotensin II receptor blockers; BMI: body mass index; eGFR: estimated glomerular filtration rate; SBP: systolic blood pressure; DBP: diastolic blood pressure; CI: confidence interval.
Model performance with COX and RSF
To facilitate a comparison with the RF model, we excluded the variables “History Obesity,” “dBP Baseline,” and “BMI Baseline” and split the dataset into 80% for training and 20% for testing. Upon conducting the model evaluation, the Cox model demonstrated a C-index of 0.891 on the training set and 0.844 on the testing set. Similarly, the RSF model achieved a C-index of 0.849 on the training set and 0.854 on the testing set. Both models displayed high C-index values on the training set, with RSF marginally outperforming Cox, and this trend persisted on the testing set, with RSF showing slightly better performance (Figure 4). To further assess the models’ calibration, we employed the Brier score as a metric. On the training set, the Cox model exhibited a lower Brier score, indicating better calibration compared to RSF. However, on the test set, RSF demonstrated a slightly lower Brier score, signifying better generalization in terms of calibration.

Overtime C-index and Brier scores for predicting disease-specific survival of CKD stages 3–5 with Cox regression and RSF in train and test dataset. (a) The overtime C-index by COX and RSF model in Trian set. (b) The overtime C-index by COX and RSF model in Test set. (c) The overtime of C-index in by COX model Trian and Test set. (d) The overtime of C-index in by RSF model Trian and Test set. CKD: chronic kidney disease; RSF: random survival forest.
Interpretability of variables
We utilized the RSFs model to identify important predictors for CKD progression. Based on the variable importance results obtained from the RSF model, we proceeded to investigate the relationship between CKD progression and three key factors: eGFR Baseline, Creatinine Baseline, and Age Baseline (Figure 5a). To explore potential non-linear associations, we employed the RCS curves. The application of RCS allowed us to flexibly estimate HRs across the range of baseline covariates, thereby assessing non-linear relationships in survival data. Specifically, we plotted the HR for CKD progression against baseline age, modeled using the RCS approach (Figure 5b, c, and d). Result shows the HR for CKD progression by baseline age, the overall p-value and non-linear p-value suggest the association is statistically significant, and there is evidence of non-linearity. Similarly, for baseline creatinine, we observed a statistically significant overall association with CKD progression. However, the evidence of non-linearity based on the non-linear p-value was relatively weak compared to the other factors. Regarding baseline eGFR, the overall association with CKD progression was statistically significant, yet the relatively high non-linear p-value suggested that the relationship was primarily linear.

Variable importance of prediction CKD progression by RSF model and the relationship between eGFR baseline, creatinine baseline, and age baseline with CKD progression by restricted cubic spline (RCS) curves. (a) Variable importance of prediction CKD progression by RSF model. (b) The hazard ratio by RCS curves of Age Baseline with CKD progression. (c) The hazard ratio by RCS curves of Creatinine Baseline with CKD progression. (d) The hazard ratio by RCS curves of eGFR Baseline with CKD progression. CKD: chronic kidney disease; RSF: random survival forest.
Discussion
The present study aimed to explore the use of interpretable ML models for predicting CKD risk based on a diverse set of clinical characteristics and demographic data. Our results provide valuable insights into the potential of ML techniques for enhancing the CKD classification and stratification and forecasting CKD progression. Our investigation revealed that the XGBOOST model exhibited the highest predictive accuracy in predicting CKD outcome. The superior performance of the XGBOOST model suggests its potential as a robust tool for predicting CKD progression and underscores its clinical relevance in supporting healthcare decision-making.
Accurate prediction of CKD progression can guide clinical decision-making and improve patient outcomes. ML techniques have shown promise in developing predictive models using electronic health record data. However, most ML models for CKD risk prediction are complex black-box models.33,34 While accuracy is important, interpretability is also critical for understanding model predictions and biases. Healthcare providers are unlikely to trust and implement black-box models. Then, one of the key strengths of our study lies in the interpretability of the ML models employed for CKD risk classification. By utilizing variable importance analysis, we identified three crucial variables that significantly contributed to the predictive performance of the models: eGFR, age, and creatinine. These findings underscore the critical role of these factors in determining CKD risk and highlight the importance of incorporating them into risk prediction models. Such insights can aid clinicians in identifying high-risk patients and implementing targeted interventions to manage CKD progression effectively. But one interest things we found in our study, that medicine taken with ACEIs and ARBs is related to CKD outcome, ACEIs and ARBs reduce intraglomerular pressure and proteinuria, which helps slow the progression of CKD. Also, the diabetes medications taken is related to CKD progress in survival analysis, tight control of diabetes with medications that lower blood glucose can significantly slow the progression of diabetic kidney disease. These include insulin, metformin, sulfonylureas, and other anti-diabetic drugs.
eGFR, an estimate of the kidney's glomerular filtration rate, emerged as the most important predictor in our models. This finding is consistent with previous research highlighting eGFR as a fundamental marker for kidney function and a key indicator of CKD risk.5,35 As eGFR decreases, the risk of CKD progression increases, underscoring the importance of regular eGFR monitoring in clinical practice. Age, another critical factor, demonstrated a non-linear association with CKD progression in our analysis. 36 Specifically, we observed higher risks of CKD progression in patients aged 52–55 years and 65–66 years, but the risk of CKD is still lower with 25% probability. These findings emphasize the age-related vulnerability to CKD development and highlight the need for age-specific risk assessment and preventive strategies. 37 Creatinine, a marker of kidney function, also exhibited significant predictive power in our models. Elevated levels of creatinine were associated with an increased risk of CKD progression.21,38 This aligns with the established role of creatinine as an essential clinical marker for kidney function and reinforces its importance in CKD risk assessment. 39 The interpretability of the variables provides a foundation for the development of risk prediction tools with improved clinical utility. Clinicians can leverage this knowledge to develop risk stratification algorithms that are easily understandable and applicable in real-world practice. 40 By incorporating eGFR, age, and creatinine into CKD risk prediction models, healthcare providers can accurately identify patients at higher risk of CKD progression, enabling early interventions and more effective disease management.
In our study, we evaluated the performance of two survival analysis models, Cox proportional hazards regression and RSFs, for predicting the progression of CKD. Both models have been widely used in survival analysis, each with its own strengths and limitations. The RSF model showed slightly higher performance compared to the COX model, with a C-index of 0.849 on the training set and 0.854 on the test set. These results suggest that RSF has a slightly better ability to generalize to new data and provides better calibration, making it a promising model for CKD progression prediction. COX is more suitable when the proportional hazards assumption holds, and the focus is on estimating HRs for individual predictors. 24 On the other hand, RSF is preferred when dealing with high-dimensional data and exploring complex interactions between predictors. 25 RSF stands out as a powerful tool for handling non-linearity, high-dimensional data, and complex interactions among predictors. The advantages of ML, exemplified by RSF in our study, hold great potential in advancing CKD research and facilitating personalized risk prediction in clinical practice.
Furthermore, the interpretability of the ML models through variable importance analysis and RCS curves provides clinicians with valuable insights into the underlying mechanisms of CKD progression. Based on the association between BP and the risk of CKD, their study has founded the non-linear relationship with BP and risk of CKD. 32 These insights can inform the development of targeted interventions and personalized treatment plans for patients at various stages of CKD.
Despite the promising results, our study has several limitations that should be considered. Firstly, the reliance on data from a single center constrains generalizability of the findings. External validation across diverse populations and healthcare settings is imperative to rigorously assess the robustness of the models. Therefore, external validation using data from diverse healthcare settings is essential to confirm the robustness of our models. Additionally, our dataset was limited to specific clinical and demographic variables, also the prediction of CKD 3–5 stages is based on eGFR. The CKD risk could be also defined by urinary albumin creatinine ratio, which our study is lacked with this data. Incorporating multi-modal data encompassing genetics, biomarkers, and lifestyle factors could further enhance predictive accuracy and contribute to a more comprehensive risk prediction model for CKD progression. Moreover, our study focused on predicting CKD progression based on baseline information and more advanced ML techniques such as deep neural networks warrant exploration as they may unlock substantial improvements in predictive accuracy.
This work motivates several promising directions to overcome the limitations and realize the full potential of ML for advancing clinical practice. Foremost is external validation of the models using real-world data from varied patient cohorts and care settings. Second, harnessing emerging technologies from wearables to electronic health records offers abundant opportunities to strengthen predictions through the integration of diverse longitudinal data. Evaluating model transportability across disease areas is imperative to determine wider clinical utility. The framework could also be extended to incorporate sensor data and applied to other disease contexts. Additionally, large language models like OpeanAI-GPT provide new opportunities to generate predictive features and interactions. 41 Finally, a critical next phase entails translating enhanced prognostic capabilities into personalized interventions and treatment plans tailored to individuals’ risk profiles and trajectories. Such steps toward precision medicine hold immense promise for optimizing patient outcomes.
Conclusion
Our study demonstrates the potential of interpretable ML models in predicting CKD classification and CKD progression along with identifying significant risk factors. The findings highlighted the advantages of ML in handling survival data, particularly in terms of non-linearity and high-dimensional predictors. Future research efforts should focus on external validation and the integration of diverse data sources to further improve CKD risk prediction and advance personalized healthcare strategies for CKD patients.
Author’s note
Shi-Yang Guan is also affiliated with Department of Epidemiology and Biostatistics, School of Public Health, Anhui Medical University, Hefei, China.
Footnotes
Acknowledgments
The authors thank Saif Al-Shamsi (United Arab Emirates University) for opening this additional information about the CKD dataset.
Author contributions
Conceptualization, WWM and SXZ; methodology, formal analysis, and data curation, JXZ, JZ and SYG; writing—original draft preparation, JXZ; writing—review and editing, JXZ and XL; supervision, WWM and SXZ. All authors have read and agreed to the published version of the manuscript.
Consent statement
The patient consent statement is not required as this study data is open sourced, and the original research have already conducted.
Declaration of conflicting interests
The authors declared no potential conflicts of interest with respect to the research, authorship, and/or publication of this article.
Funding
The author(s) disclosed receipt of the following financial support for the research, authorship, and/or publication of this article: The study was supported by the Three-year Action Plan for Promoting Clinical Skills and Innovation Ability of Municipal Hospitals (SHDC2022CRS039), Shanghai Natural Science Foundation (22ZR1462100, 23ZR1464000, 23ZR1463900), China National Science Foundation (82070740, 81870492), and National Key Research and Development Program (2016YFC1305402).
Ethical approval
Ethical approval was not required as this study data is open sourced, and the original research have already conducted.
Guarantor
Dr Shun-Xian Zhang, and Wei-Ming Wang should be considered guarantor of this work.