
Abstract
Objective
To develop an interpretable stacking ensemble model for predicting in-hospital mortality in intensive care unit (ICU) patients with CKD and sepsis and to deploy it as a web-based tool for bedside clinical use.
Methods
Data were extracted from the MIMIC-IV 3.0 database and split into training and test sets at a 7:3 ratio. Feature selection was performed by combining the least absolute shrinkage and selection operator (LASSO) regression with the Boruta algorithm. Eight machine learning (ML) models were trained and optimized via ten-fold cross-validation and grid search. The two models with the highest area under the curve (AUC) in the training set were combined using a stacking ensemble strategy. SHapley Additive exPlanations (SHAP) were applied to improve interpretability. Model performance was compared with the SOFA score.
Results
A total of 5344 ICU patients with CKD and sepsis were included, with an in-hospital mortality rate of 19.1%. After feature selection, 16 variables were retained. In the training set, XGBoost and LightGBM performed best. The stacking model achieved an AUC of 0.757 on the test set, outperforming SOFA (AUC = 0.668). SHAP analysis identified age, Acute Physiology Score III, Simplified Acute Physiology Score II, and respiratory rate as the top predictors. The model was also deployed as a publicly accessible web application.
Conclusion
The stacking ensemble model demonstrated good discriminatory performance and interpretability for predicting in-hospital mortality in ICU patients with CKD and sepsis. Its web-based deployment provides a convenient platform for early risk assessment, although external validation is needed to confirm its broader applicability.
Keywords
Introduction
Chronic kidney disease (CKD) is an irreversible, progressive disorder of kidney function that has become a significant global public health challenge.1,2 As the population ages and access to long-term renal replacement therapy (RRT) improves, the proportion of intensive care unit (ICU) patients with comorbid CKD continues to rise.3,4 This population commonly exhibits chronic low-grade inflammation, immune dysfunction, and metabolic disturbances, rendering them highly vulnerable to acute decompensation during stressors such as infection, which can rapidly progress to sepsis and poor clinical outcomes.5–7 Studies have shown that sepsis is the second leading cause of death among patients with CKD and end-stage renal disease, following cardiovascular disease.4,8 Conversely, among critically ill patients with sepsis or septic shock, the prevalence of CKD reaches as high as 46%, 9 and their 90-day mortality remains the highest among all chronic underlying conditions, even after adjustment for multiple confounders. 10 Despite advances in clinical management, outcomes for patients with CKD and sepsis remain poor, underscoring the need for early and accurate risk stratification to improve prognosis.
Currently, the assessment of mortality risk in patients with CKD and sepsis primarily relies on traditional scoring systems such as the Sequential Organ Failure Assessment (SOFA) 11 and the Simplified Acute Physiology Score II (SAPS II). 12 Although these tools reflect a certain degree of disease severity, they were not specifically designed for CKD. Furthermore, these scoring systems were largely developed based on earlier patient cohorts, and as clinical practice environments and patient characteristics have evolved, their calibration and discrimination performance have declined.13,14 Beyond scoring systems, some studies have identified prognostic variables through retrospective analyses. For instance, Chen et al. 15 demonstrated an association between red blood cell transfusion and reduced 28-day mortality in patients with CKD and sepsis. However, analyses focusing on single variables fail to capture the complex, nonlinear interactions among clinical factors, limiting their predictive accuracy and clinical applicability.
In recent years, machine learning (ML) techniques have increasingly been applied in risk prediction for critically ill patients to overcome the limitations of traditional scoring methods.13,16 Several studies have developed ML models to predict mortality risk in patients with sepsis. 16 Some models have further targeted short-term prognosis in patients with sepsis complicated by specific organ injuries, such as liver injury or acute kidney injury.17,18 However, risk prediction models tailored to patients with CKD and sepsis remain scarce, and most existing studies rely on single algorithms. Stacking, an ensemble learning strategy, enhances model robustness and generalizability by integrating multiple base models with complementary strengths and optimizing their outputs through a secondary learner. This approach is particularly suited for handling high-dimensional and complex clinical data.19,20 Accordingly, this study aimed to develop a stacking ensemble model to predict in-hospital mortality in ICU patients with CKD and sepsis, enabling timely identification of high-risk individuals and optimizing clinical management.
Methods
Data source
This retrospective study used data from the Medical Information Mart for Intensive Care IV (MIMIC-IV, version 3.0) database. 21 MIMIC-IV is maintained by Beth Israel Deaconess Medical Center, a large tertiary academic medical center in Boston, Massachusetts, USA, and contains detailed, de-identified clinical information for ICU admissions occurring between 2008 and 2022. All records are fully anonymized with no data that could directly or indirectly identify individual patients. The use of MIMIC-IV was approved by the institutional review boards of MIT and Beth Israel Deaconess Medical Center, with informed consent waived because the data are de-identified. One author (Jianjie Ju, ID: 13963218; Record ID: 66722132) completed the required training and was granted access to the database.
Study population and data extraction
CKD was identified through manual review of diagnostic records, with the corresponding ICD codes listed in Supplementary Table S1. Sepsis was defined according to the Sepsis-3.0 criteria, requiring a SOFA score ≥2 in the presence of confirmed or suspected infection. 22 Patients were included if they met the following criteria: (1) first hospital admission and first ICU admission recorded in the MIMIC-IV database; and (2) confirmed diagnoses of both CKD and sepsis during the ICU stay. Patients were excluded if they met any of the following conditions: (1) age <18 years, or (2) an ICU length of stay <24 hours. Because the study aimed to maximize the number of eligible patients to support robust ML model development, no formal a priori sample size calculation was performed. After applying all predefined inclusion and exclusion criteria, the final analytic cohort consisted of 5344 patients with CKD and sepsis available in the MIMIC-IV database. The complete patient selection process is illustrated in Figure 1.

Flowchart of data screening.
Data extraction and preprocessing were performed using Structured Query Language. Clinical variables were collected on the first ICU day, including demographics, vital signs, laboratory results, interventions, medications, and clinical scores, to comprehensively reflect the initial condition of the patients.
The primary outcome was in-hospital mortality, defined as death during the index hospitalization.
Data preprocessing and feature selection
To mitigate the impact of missing data on model development, variables with more than 20% missingness were excluded, and 55 features were retained for subsequent analysis. The remaining missing values (Supplementary Figure S1) were imputed using the missForest package to minimize bias and preserve sample size. 23 To evaluate whether the imputation process introduced distributional distortion, we compared the mean and standard deviation of key variables before and after imputation. The distributions remained highly consistent, with changes in most variables being less than 1%, indicating that missForest preserved the original data structure well and did not substantially alter variable characteristics (Supplementary Table S2). The data were then randomly split into training and test sets at a 7:3 ratio.
During feature selection, univariate analysis was first conducted on the training set to identify candidate variables associated with in-hospital mortality. To improve model parsimony, LASSO regression 24 and the Boruta algorithm 25 were subsequently applied. LASSO selects variables via L1 regularization, while Boruta assesses feature importance based on random forests to enhance model robustness. The final feature set was defined as the intersection of variables selected by both methods.
Model development and evaluation
Based on the tidymodels framework, 26 this study trained eight ML models: random forest (RF), decision tree, Light Gradient Boosting Machine (LightGBM), logistic regression (LR), support vector machine (SVM), extreme gradient boosting (XGBoost), K-nearest neighbors (KNN), and naive Bayes. Given that some models (e.g., LR, SVM, and KNN) are sensitive to the scale of input variables, continuous variables were standardized to ensure the stability of model training. Ten-fold cross-validation combined with grid search was used for hyperparameter optimization. The parameter set achieving the best performance was selected as the final configuration for each model. Model performance was evaluated based on receiver operating characteristic (ROC) curves and corresponding AUC values, while calibration curves and decision curve analysis (DCA) were plotted to assess clinical utility. The SOFA score was included as a baseline comparator for evaluating the ML models.
Model performance was evaluated using accuracy, negative predictive value (NPV), specificity, AUC, sensitivity, positive predictive value (PPV), and F1 score. All metrics, except AUC, were calculated based on the optimal threshold determined by the Youden index. Although this threshold may not correspond to the optimal cutoff for clinical application, it remains statistically informative. 27 AUC differences between models were assessed using the DeLong test.
Model stacking and deployment
Based on the AUC of each base model in the training set, the two top-performing models were identified, and a stacking ensemble was trained using the stacks package 28 to leverage their predictive strengths and improve overall model performance. A comprehensive performance evaluation was conducted on the test set, with calibration curves and DCA plotted to assess calibration and clinical utility.
To enhance interpretability, the final stacking ensemble model was further analyzed for feature importance. To visualize the marginal contribution of each variable to model predictions, a SHAP-based beeswarm plot was generated, while a waterfall plot was used to illustrate the model's decision-making process for an individual case. Finally, the model was deployed as a web-based tool, providing an interactive prediction interface to facilitate its application in clinical practice.
Statistical analysis
All data processing and analysis were performed using R (version 4.4.3) and SPSS (version 27.0). Categorical variables were presented as frequencies (%) and compared between groups using the chi-square test or Fisher's exact test. Continuous variables were assessed for normality using the Kolmogorov-Smirnov test. Variables with a normal distribution were expressed as mean ± standard deviation and compared using the independent samples t-test. In contrast, non-normally distributed variables were expressed as median (P25, P75) and compared using the Mann-Whitney U test. All statistical tests were two-sided, and a P value < .05 was considered statistically significant.
Results
Baseline characteristics
Among 9374 patients with CKD, 57.0% (5344/9374) had sepsis (Figure 1). The in-hospital mortality among ICU patients with CKD and sepsis was 19.1% (1019/5344). The cohort was randomly divided into a training set (n = 3741) and a test set (n = 1603) at a 7:3 ratio. No significant differences in baseline characteristics were observed between the two sets (Supplementary Table S3). The median age of the overall cohort was 75.10 years (interquartile range [IQR], 65.23–83.11), and 61.62% were male. Table 1 summarizes the demographic and clinical characteristics of survivors and non-survivors in the training cohort.
Baseline characteristics of survivors and non-survivors in the training set.

Note: M, median; Q 1 , first quartile; Q 3 , third quartile; Hb, hemoglobin; PLT, platelet; WBC, white blood cell; BUN, blood urea nitrogen; INR, international normalized ratio; PT, prothrombin time; APTT, activated partial thromboplastin time; MBP, mean blood pressure; SpO2, peripheral capillary oxygen saturation; SOFA, Sequential Organ Failure Assessment; APS III, Acute Physiology Score III; SAPS II, Simplified Acute Physiology Score II; OASIS, Oxford Acute Severity of Illness Score; GCS, Glasgow Coma Scale; SIRS, Systemic Inflammatory Response Syndrome; CHD, coronary heart disease; COPD, chronic obstructive pulmonary disease; RRT, renal replacement therapy; NSAIDs, non-steroidal anti-inflammatory drugs; ACEI, angiotensin-converting enzyme inhibitor; ARB, angiotensin II receptor blocker.
Feature selection
Based on 39 significant variables identified through univariate analysis, LASSO regression and the Boruta algorithm were applied to further reduce dimensionality and enhance model performance. LASSO, using L1 regularization, achieved variable selection at λ.1se, retaining 18 variables (Figure 2(a)–(b)). Boruta, based on a random forest framework, identified 26 features with stable predictive contributions (Figure 2(c)). Finally, 16 variables identified by the intersection of both methods were selected as model inputs, including age, urine output, anion gap (AG), BUN, SOFA score, chloride, Acute Physiology Score III (APS III), international normalized ratio (INR), Oxford Acute Severity of Illness Score (OASIS), activated partial thromboplastin time (APTT), respiratory rate, SAPS II, Systemic Inflammatory Response Syndrome (SIRS) score, liver disease, antibiotic use, and corticosteroid use (hydrocortisone or dexamethasone) (Figure 2(d)).
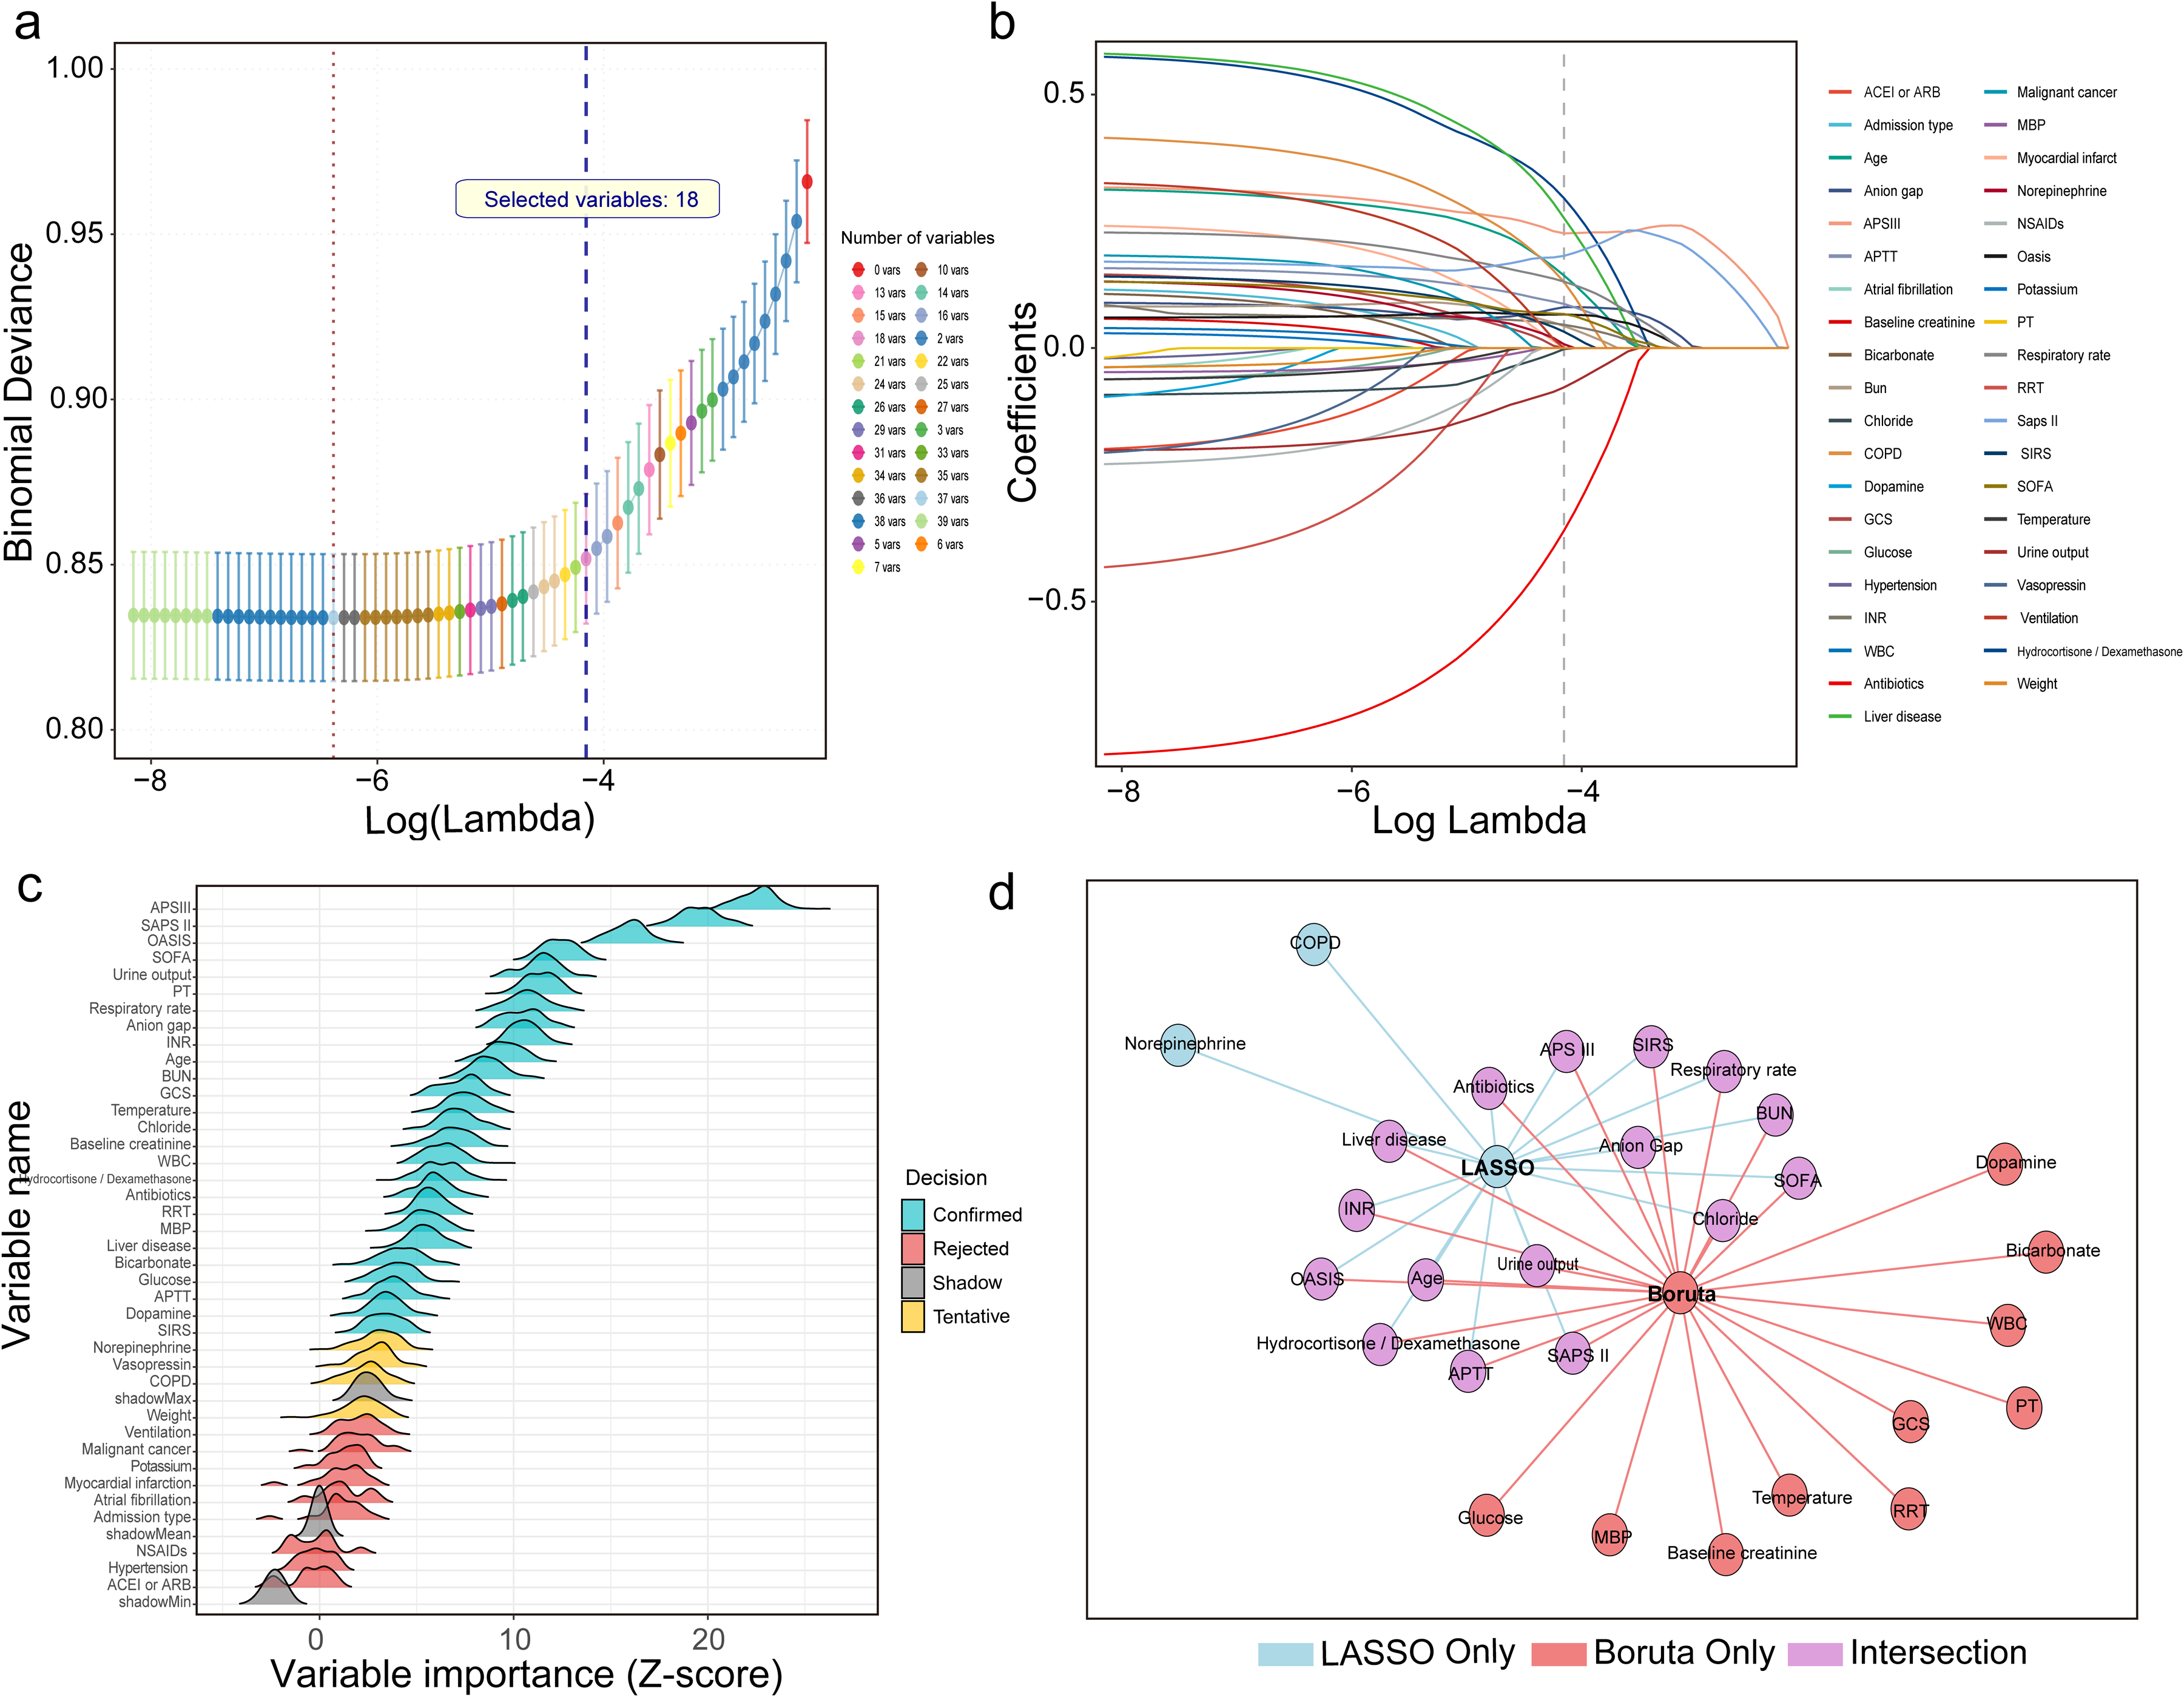
Feature selection workflow integrating LASSO and Boruta algorithms. (a) Ten-fold cross-validation in the LASSO model identified the optimal penalty parameter at λ.1se, resulting in the retention of 18 variables. (b) The coefficient path plot illustrates the convergence of variable coefficients with increasing regularization strength. (c) The Boruta algorithm confirmed 26 variables with stable predictive importance. (d) A total of 16 variables were retained after taking the intersection of the LASSO and Boruta selections, representing the final predictor set used in the model.
Model development and evaluation
Eight ML models were developed to predict in-hospital mortality. In the training set, LightGBM and XGBoost demonstrated the highest discrimination, with AUCs of 0.864 (95% CI, 0.850–0.878) and 0.841 (95% CI, 0.825–0.856), respectively, both clearly superior to the SOFA score (AUC, 0.654; 95% CI, 0.632–0.677) (Figure 3(a)). LightGBM also achieved the best overall balance of performance metrics, with an accuracy of 74.0%, sensitivity of 71.7%, specificity of 84.4%, and an F1 score of 0.818, followed by XGBoost (accuracy, 73.1%; F1 score, 0.811). Detailed performance metrics for all base models in the training set are reported in Supplementary Table S4. In the test set, the stacking model constructed from LightGBM and XGBoost maintained superior discrimination compared with the SOFA score, with an AUC of 0.757 (95% CI, 0.729–0.786) versus 0.668 (95% CI, 0.633–0.702) for SOFA (Figure 3(b)), and it also showed higher accuracy, sensitivity, specificity, and F1 score (Supplementary Table S5). DeLong tests indicated that, in the training set, LightGBM and XGBoost had significantly higher AUCs than most other base models, including SOFA (Supplementary Figure S2), and in the test set, the stacking model achieved a significantly higher AUC than SOFA (P < .001).

Performance of the prediction models in the training and test sets. This figure illustrates the discrimination, calibration, and clinical utility of the machine learning models and the SOFA score. (a) ROC curves in the training set comparing the eight ML models with the SOFA score. (b) ROC curves in the test set comparing the stacking ensemble model, constructed from LightGBM and XGBoost, with the SOFA score. (c) Calibration plots in the training set for the eight ML models and the SOFA score. (d) Calibration plots in the test set for the stacking ensemble model and the SOFA score. (e) DCA in the training set for the eight machine learning models and the SOFA score. (f) DCA in the test set for the stacking ensemble model and the SOFA score.
Calibration plots showed that, in the training set, all models except RF and naive Bayes had good agreement between predicted and observed risks (Figure 3(c)). In the test set, the stacking model remained well calibrated, whereas SOFA displayed noticeable deviation from the ideal reference line (Figure 3(d)). DCA demonstrated that, in the training set, LightGBM and XGBoost provided greater net clinical benefit across a wide range of threshold probabilities compared with SOFA (Figure 3(e)). In the test set, the stacking model yielded higher net benefit than SOFA over thresholds from 0.10 to 0.50, and within the overlapping region, it provided an incremental net benefit of approximately 0.05, corresponding to about five additional correct clinical decisions per 100 patients (Figure 3(f)).
To assess the robustness of the model across different sepsis severity levels, we performed an interaction analysis and subgroup evaluations. The interaction between predicted mortality probability and septic shock status was not statistically significant (P =0 .166). In subgroup analyses, the model yielded an AUC of 0.730 (95% CI, 0.690–0.769) in patients with non-shock sepsis and 0.705 (95% CI, 0.653–0.758) in those with septic shock, suggesting that the model's predictive performance was stable across clinically relevant severity subgroups.
Model explainability and web deployment
Age, APS III score, respiratory rate, and SAPS II score were consistently ranked among the top predictors of in-hospital mortality across the base models (Supplementary Figure S3). The SHAP beeswarm plot based on the stacking model further confirmed these key variables, showing that most features were positively associated with mortality risk, except for urine output, antibiotic use, and chloride (Figure 4(a) and (b)). The patient-level SHAP visualization (Figure 4(c)) demonstrated how the model integrates individual clinical variables to produce risk estimates, thereby enhancing interpretability and supporting clinical decision-making. Finally, the stacking model was deployed as an interactive, web-based tool (Figure 4(d)), allowing clinicians to input key variables at the bedside and to obtain real-time mortality risk predictions to aid in the early identification and risk stratification of ICU patients. The tool is publicly available online (https://mdyy1.shinyapps.io/linshuo/), and a user guide has been provided separately as supplementary material.

Interpretability and clinical deployment of the stacking model. (a) Feature importance ranking of the stacking ensemble model, showing that age, APS III score, SAPS II score, and respiratory rate were the four most influential predictors of in-hospital mortality. (b) SHAP beeswarm plot summarizing the direction and magnitude of each feature's contribution across all patients. (c) SHAP waterfall plot for a randomly selected patient, demonstrating how the model integrates individual-level features to generate a mortality risk prediction. (d) Interface of the web-based application designed for bedside use, allowing clinicians to input patient characteristics and obtain real-time mortality risk estimates.
Discussion
In this study, we developed a stacking ensemble model to predict in-hospital mortality in patients with CKD and sepsis, using a large-scale, real-world critical care database. Compared with the conventional SOFA score, the model demonstrated superior calibration and greater clinical utility. By integrating two advanced algorithms and applying feature selection through LASSO regression and the Boruta algorithm, the model effectively captured the complex clinical characteristics of this high-risk population, substantially improving predictive accuracy and robustness.
To date, ML techniques still face “black-box” challenges, which make their implementation in clinical practice questionable. 29 To mitigate this issue and better align with clinical needs, we introduced SHAP into the model, generating summary plots to illustrate overall feature importance and waterfall plots to explain individual prediction outcomes. It is important to note that these SHAP-derived associations reflect predictive relationships rather than causal effects; they indicate how individual features influence the model's risk estimates but should not be interpreted as evidence of causation. Furthermore, recognizing the fast-paced clinical environment and the complexity of healthcare information systems, we developed a simple web-based prototype that allows clinicians to input key variables and generate individualized mortality risk estimates, improving accessibility and supporting preliminary clinical evaluation.
Although established scoring systems such as SOFA, SAPS II, and APS III were included as predictors in our model, the stacking ensemble provides several advantages beyond the capabilities of these traditional tools. First, in our cohort, SOFA showed notably lower discrimination, indicating that traditional scores did not fully capture mortality risk in patients with CKD and sepsis. Second, traditional scores rely on linear assumptions and fixed coefficients, restricting their ability to capture nonlinear effects and higher-order interactions among clinical variables. In contrast, the stacking framework integrates complementary strengths of multiple ML algorithms, enabling the model to learn complex relationships that extend beyond what any individual score can represent. Finally, the improvement in AUC was accompanied not only by better calibration but also by a consistently higher net clinical benefit across a broad range of risk thresholds in the DCA. As articulated by Vickers et al., 30 these thresholds represent the predicted mortality probabilities at which clinicians judge the expected benefit of escalating management to outweigh its potential harms, reflecting the inherent trade-off between missing high-risk patients and performing unnecessary interventions. While these results indicate that the stacking model offers a measurable performance advantage over conventional severity scores, the clinical interpretation of the DCA should be approached with caution. DCA is best viewed as a comparative assessment of potential net benefit rather than evidence that the model would directly guide or modify bedside clinical decision-making. It is also important to note that although several recent ML models developed for sepsis-associated organ injuries, including sepsis-associated liver injury 17 and sepsis-associated acute kidney injury, 18 have reported AUC values approaching 0.80, the substantial differences in study populations and clinical phenotypes make direct comparison with our CKD–sepsis cohort inappropriate, even though all studies used mortality as the endpoint.
In this study, age, APS III score, SAPS II score, and respiratory rate emerged as the four strongest predictors of in-hospital mortality, with all showing a positive association with adverse outcomes. Age was the most influential factor, consistent with the well-described decline in physiologic reserve and immune competence in older adults.31–33 Sepsis further amplifies these age-related vulnerabilities, contributing to substantially higher mortality among elderly patients, with those over 80 years experiencing nearly twice the risk of death compared with individuals younger than 50. 34 The APS III and SAPS II scores, which carried substantial weight in the model, provide a comprehensive assessment of acute physiologic disturbances, pre-existing health status, and multi-organ function, thereby capturing systemic imbalance in this high-risk population during infectious stress. The SIRS score, which has been deprecated under Sepsis 3.0 due to poor specificity and limited ability to identify organ dysfunction, similarly demonstrated minimal prognostic value in our cohort.22,35
Urine output is a well-established indicator of perfusion status, and values below 0.5 mL/kg/h are strongly associated with increased ICU mortality. 36 Early urine output has also been recognized as an important predictor in sepsis mortality models. 37 BUN, reflecting glomerular filtration function, is similarly incorporated into several risk scoring systems and is strongly associated with adverse outcomes, with thresholds above 21 mg/dL shown to markedly increase sepsis mortality risk.12,37,38 Liver dysfunction is also common in sepsis, with an incidence of 34%–46%, and mortality rates can reach up to 68% in cases of progressive hepatic failure. 39 Coagulation abnormalities are common in sepsis. 40 Elevation of the INR reflects impaired coagulation and reduced hepatic synthetic function, both of which indicate more severe physiologic derangement in sepsis and are associated with higher mortality risk.40–42 The AG has also been validated as a marker associated with short-term mortality in sepsis,43,44 and in our study, low chloride at ICU admission similarly emerged as an early indicator of in-hospital mortality in patients with CKD and sepsis.
The survival benefit of early antibiotic administration in sepsis is well established, with delays linked to substantially increased mortality.45–47 In our cohort, early antibiotic use remained a strong protective factor in patients with CKD and sepsis, consistent with the critical need for rapid pathogen control in individuals with impaired renal and immune function. The use of glucocorticoids (hydrocortisone or dexamethasone), in contrast, emerged as an independent risk factor for mortality, likely reflecting greater illness severity. It should be emphasized that this study focused on predictive modeling of early in-hospital mortality risk and does not directly negate the potential benefits of glucocorticoid therapy. Rather, it underscores the need to carefully balance the risks of resistance and adverse effects against the evidence of infection, individual patient condition, and treatment response, to guide more precise pharmacologic interventions in clinical practice.
Limitations
However, this study has several limitations. First, because it was conducted using a pre-existing database, the final sample size was determined by the number of eligible cases rather than by an a priori sample size calculation, which may reduce the statistical power. Second, although we addressed missing data using the missForest algorithm and confirmed that post-imputation distributions of key variables closely mirrored those of the original dataset, the potential for residual bias remains, given that no imputation approach is entirely free of bias. Third, the model was developed using data from the MIMIC-IV database, which represents a single-center critical care population in the United States. Although MIMIC-IV includes patients of diverse racial and ethnic backgrounds, its geographic and institutional homogeneity may limit the model's generalizability, particularly in settings with different patient demographics, clinical practices, or ICU care standards. Furthermore, because healthcare systems, sepsis management protocols, and resource availability vary substantially across countries and regions, the model's performance outside the United States cannot be assumed. External validation using multi-center and international cohorts is therefore essential to establish broader applicability. Fourth, the model was constructed using only clinical variables collected within the first 24 hours of ICU admission, providing a static representation that does not capture the dynamic trajectory of sepsis. Given the importance of temporal patterns in sepsis prognostication, the absence of longitudinal data may limit predictive accuracy and reduce clinical utility. Finally, although the model has been deployed as a web-based tool, it has not yet undergone usability testing, electronic health record integration assessment, or prospective evaluation, all of which are necessary before clinical implementation.
Conclusion
We developed a stacking-based ML model that predicts in-hospital mortality risk in ICU patients with CKD and sepsis with good performance. A web-based prototype tool was created to facilitate bedside risk assessment. However, the model's clinical applicability and generalizability require further evaluation in external cohorts.
Supplemental Material
sj-docx-1-dhj-10.1177_20552076261415938 - Supplemental material for Development and deployment of an interpretable stacking ensemble model for predicting in-hospital mortality in ICU patients with chronic kidney disease and sepsis
Supplemental material, sj-docx-1-dhj-10.1177_20552076261415938 for Development and deployment of an interpretable stacking ensemble model for predicting in-hospital mortality in ICU patients with chronic kidney disease and sepsis by Jianjie Ju, Shuo Lin, Jingjing Chen and Zhouhua Wang in DIGITAL HEALTH
Supplemental Material
sj-pdf-2-dhj-10.1177_20552076261415938 - Supplemental material for Development and deployment of an interpretable stacking ensemble model for predicting in-hospital mortality in ICU patients with chronic kidney disease and sepsis
Supplemental material, sj-pdf-2-dhj-10.1177_20552076261415938 for Development and deployment of an interpretable stacking ensemble model for predicting in-hospital mortality in ICU patients with chronic kidney disease and sepsis by Jianjie Ju, Shuo Lin, Jingjing Chen and Zhouhua Wang in DIGITAL HEALTH
Supplemental Material
sj-pdf-3-dhj-10.1177_20552076261415938 - Supplemental material for Development and deployment of an interpretable stacking ensemble model for predicting in-hospital mortality in ICU patients with chronic kidney disease and sepsis
Supplemental material, sj-pdf-3-dhj-10.1177_20552076261415938 for Development and deployment of an interpretable stacking ensemble model for predicting in-hospital mortality in ICU patients with chronic kidney disease and sepsis by Jianjie Ju, Shuo Lin, Jingjing Chen and Zhouhua Wang in DIGITAL HEALTH
Footnotes
Abbreviation
Acknowledgements
The authors acknowledge all participants in the MIMC-IV research team for survey design and data collection.
Ethics statement
The MIMIC-IV database is a publicly available dataset containing de-identified patient information; therefore, no additional ethical approval was required for its use. Data extraction for this study was approved by the Institutional Review Board of the Massachusetts Institute of Technology, with access granted to author Jianjie Ju (ID: 13963218,).
Contributorship
Jianjie Ju contributed to the study's conceptualization, methodology, data curation, original drafting, and visualization. Shuo Lin contributed to data curation, visualization, and drafting of the manuscript. Jingjing Chen provided data curation and resource support. Zhouhua Wang supervised the study, led the conceptualization and methodology design, secured funding, and contributed substantially to original drafting, review, editing, and data curation.
Funding
The authors disclosed receipt of the following financial support for the research, authorship, and/or publication of this article: This study was supported by the Startup Fund for Scientific Research, Fujian Medical University (Grant No. 2019QH1217), and the Fujian Provincial Health Commission Scientific Research Plan Project (Grant No. 2021QNA076).
Declaration of conflicting interests
The authors declared no potential conflicts of interest with respect to the research, authorship, and/or publication of this article.
Data availability
All data will be available from the corresponding author upon reasonable request.
Supplemental material
Supplemental material for this article is available online.
Use of artificial intelligence tools
Artificial intelligence tools (Grammarly and ChatGPT) were used only for grammar and language refinement. All AI-assisted content was reviewed by the authors, and no AI tools were used for data analysis, modeling, or interpretation.
References
Supplementary Material
Please find the following supplemental material available below.
For Open Access articles published under a Creative Commons License, all supplemental material carries the same license as the article it is associated with.
For non-Open Access articles published, all supplemental material carries a non-exclusive license, and permission requests for re-use of supplemental material or any part of supplemental material shall be sent directly to the copyright owner as specified in the copyright notice associated with the article.