
Abstract
Objectives
To achieve a rapid assessment of health literacy (HL) levels among diabetic patients.
Methods
A questionnaire survey was conducted among diabetic patients from nine communities in Nantong City, Jiangsu Province, China, using convenient sampling. Based on the survey results, data from three communities were randomly selected as the test set, with the remaining data used as the training set. Feature selection was performed using recursive feature elimination. Predictive models were established and compared using logistic regression (LR), random forest (RF), and support vector machine (SVM). Calibration curves, decomposition plots, and partial dependence plots were drawn to evaluate and interpret the models.
Results
In November 2023, a total of 802 valid questionnaires were received. Eight variables were selected for modeling: educational level, exercise habits, average monthly household income, dietary control, age, medication for blood sugar control, duration of diabetes, and number of cohabitants. The recall for LR in the three communities was 0.778, 0.800, and 0.862 [area under the curve (AUC): 0.810, 0.792, and 0.775]. For RF, the recall values were 0.879, 0.877, and 0.923 (AUC: 0.781, 0.710, and 0.710). For SVM, the recall values were 0.859, 0.862, and 0.877 (AUC: 0.813, 0.759, and 0.770). Model evaluation showed that as the data volume increased, the calibration curves became more ideal.
Conclusions
As one of the few HL prediction models for diabetic patients in mainland China that is built based on multi-center survey data and evaluated through multi-center assessment, this model can quickly identify patients with insufficient HL using a small amount of objective personal information.
Introduction
Diabetes mellitus (DM) is a group of metabolic diseases characterized by chronic hyperglycemia. It is projected that by 2040, the number of diabetic patients aged 20–79 will rise to 642 million, significantly impacting society, finance, and healthcare systems. 1 Health literacy (HL) refers to the ability to identify, understand, and use information or services related to health, 2 including basic language and literacy skills, self-efficacy, and the ability to self-monitor and manage.3,4 The impact of HL on diabetic patients has been confirmed by numerous studies. Good HL can significantly enhance diabetic patients’ understanding and management of their disease, help them control their diet more effectively to reduce nutritional risks, thereby reducing the likelihood of depression, lowering negative perceptions of the disease, and alleviating the burden of treatment.5–7
Identifying and targeting diabetic patients with low HL for focused interventions can improve their quality of life, as well as reduce healthcare costs and enhance socio-economic benefits.8,9 When developing treatment or intervention plans for diabetic patients, it is essential to first consider their psychological state. 10 By assessing HL, it is possible to improve patients’ mental health and inspire their interest in health knowledge. Many patients have expressed that it would be beneficial if healthcare professionals could point out their deficiencies in HL. 11 However, identifying patients with low HL can be challenging. Currently, questionnaires are the main assessment tool, 12 but they have several limitations: (1) Time-consuming: Questionnaires often have numerous items, and the process of organizing surveys, deploying staff, collecting responses, and analyzing data can take a considerable time, sometimes extending to several months; (2) Low response rate: The response rate to questionnaires may be low. Although incentives can improve response rates, they incur additional costs; 13 (3) High cost: Due to insufficient internet skills among the elderly, paper-based questionnaires are indispensable, and their costs are high, primarily due to expenses related to printing, mailing, and data entry; 14 (4) Requirements for users: Self-assessment questionnaires require patients to have a certain level of reading comprehension ability. 15 Some patients with low educational levels may still need assistance from others to complete the questionnaires. 16 Therefore, this study attempts to develop a more convenient and rapid assessment tool.
Machine learning (ML), a core component of artificial intelligence, is a technique that enables computers to learn from data and continuously improve using methods from statistics and computer science. Its applications in the field of diabetes primarily include: (1) Predicting diabetes risk, such as the work by Tasin et al. 17 using traditional ML methods (decision trees, K-nearest neighbor, logistic regression (LR), random forest (RF), and support vector machine (SVM), and extreme gradient boosting) and ensemble techniques (Bagging, AdaBoost) to develop an automatic diabetes prediction system. Similarly, Martínez et al. 18 used logistic models to predict the risk of gestational diabetes. (2) Predicting diabetes complications: For instance, Shi et al. 19 used RF to build a weighted risk model to predict diabetic foot occurrence, while Shen et al. 20 applied ensemble learning methods to construct a risk prediction model for diabetic retinopathy. However, applications of ML in predicting HL levels related to diseases are still limited. Li et al. 21 used variables like gender, use of antihypertensive drugs, education level, and medical insurance to build a HL prediction model for hypertensive patients using decision trees and LR. Zhou et al. 22 used LR, RF, and SVM methods to predict HL related to infectious diseases based on factors like residence, education level, occupation, medical-related work experience, and family monthly income. Both studies used sociodemographic characteristics and other personal basic information as variables, employing traditional ML methods to build prediction models. Currently, no research has been found on HL prediction models for diabetes patients based on ML. This study compares multiple algorithms to build a predictive model for the HL level of diabetic patients, aiming to quickly assess their HL level based on personal information such as age, income, education, and lifestyle.
Methods
This study is a descriptive applied research based on community survey data, using ML methods to construct a predictive model of HL levels in diabetic patients. The study includes five steps: questionnaire survey, data preprocessing, feature selection, model construction, comparative analysis, and interpretation and evaluation.
Source of questionnaire
Based on a review of literature related to HL in the diabetic population,23,24 as well as the project team's previous Python-based visual analysis of HL measurement scales for diabetic patients domestically and abroad, a preliminary diabetes HL evaluation index system was established. Then, the index system was evaluated and refined through two rounds of Delphi expert consultation. The authority coefficient of the expert consultation reached 0.89, and the coordination coefficients for the two rounds of expert consultation were 0.362 and 0.358, respectively, indicating a high level of authority and recognition of the indicator content by the experts. Based on this index system, the project team designed the “Diabetes Health Literacy Survey Questionnaire” (Supplementary Material 1).
The questionnaire consists of three parts: the first part involves informed consent from the patients; the second part covers personal objective information, including gender, age, duration of illness, and education level, totaling 16 features. This content was developed based on a systematic literature review of diabetes HL and was derived from three aspects: sociodemographic characteristics, basic personal information, and lifestyle. The third part is the main section of the HL survey, which is divided into four parts: health awareness, health knowledge, health behavior, and health skills, comprising 39 questions in total, with both single-choice and multiple-choice types. The Cronbach's alpha coefficient of the questionnaire is 0.904, and the Cronbach's alpha coefficients for the individual dimensions range from 0.848 to 0.875, indicating good internal consistency. The high authority and coordination coefficients of the expert consultation ensure the validity of the questionnaire.
Study participants
From August to November 2023, a multicenter survey was conducted using convenient sampling in nine communities (Hekou, Jicheng, Lidu, Renhe, Shubei, Tianhe, Wuli, Yuai, Changlu) in Chenqiao Street, Chongchuan District, Nantong City. Before the formal survey, the Nantong Center for Disease Control and Prevention was entrusted with recruiting surveyors and providing them with pre-job training. Information on the survey subjects was derived from 1100 diabetic patients within the community health management platform. Following the principles of voluntarism and informed consent, a door-to-door survey approach was employed. With confirmation by the surveyors in person, patients willingly participated in the research, completing the questionnaires in a one-on-one interview format, with each interview lasting approximately 20 min. Most patients consider their participation as indicating agreement to the research, and this study has taken every possible measure to safeguard patients’ rights and privacy. For individuals with reading difficulties, surveyors assisted them in completing the questionnaires in a Q&A format. The inclusion criteria for participants were individuals who met the World Health Organization (WHO) criteria for the diagnosis of diabetes, were capable of independently communicating with the surveyors, had no cognitive impairments, and were willing to participate in the survey. Individuals with insufficient cognitive abilities to communicate effectively were excluded. Aside from those who were not at home during the survey, a total of 900 diabetic patients voluntarily participated and completed the survey.
According to the basic principles of questionnaire design and the psychometric properties of scales, there is a positive relationship between the number of items in the scale and the required sample size, where each item requires five to ten samples. 25 The questionnaire designed for this study consists of 39 items, so the required sample size should range between 195 and 390. For model building, each feature requires at least 20 samples. 26 Since the personal information section of the questionnaire contains 16 features, a minimum sample size of 320 is required. Therefore, the sample size in this study meets the basic requirements.
Definition of values
To facilitate statistical analysis of the survey data, specific scores were assigned to the options for the 39 questions, with a maximum of 5 points per question, resulting in a total score of 195 points. Single-choice questions used the Likert 5-point scale, with scores assigned based on the progression of options: 1 point, 2 points, 3 points, 4 points, and 5 points. For example, for the statement “Health is more important than money,” the options were: Strongly disagree (1 point), Disagree (2 points), Neutral (3 points), Agree (4 points), and Strongly agree (5 points). Multiple-choice questions were scored based on the number of correct options selected, with a maximum score of 5 points. For example, for the question “What is the significance of dietary control for diabetes management?” the options were: (i) Correcting metabolic disorders caused by diet; (ii) Maintaining ideal body weight; (iii) Achieving or approaching normal levels of blood glucose and lipids; (iv) Reducing the incidence of complications; (v) Not sure. The scoring rules were: selecting all of (i), (ii), (iii), and (iv) earned 5 points; selecting some but not all of (i), (ii), (iii), and (iv) earned 3 points; and selecting (v) earned 1 point.
According to the monitoring regulations of the Chinese National Health Commission based on “Chinese Citizens’ HL - Basic Knowledge and Skills,” a questionnaire score of 80% or more of the total score is considered to indicate basic HL. 27 Considering that HL questionnaires for specific diseases involve more specialized knowledge and higher requirements for patients, the passing score was set at 130 points (2/3 of the total score) in this study, with scores below 130 points indicating a lack of HL.
Model construction
Software tools: The extraction and collection of questionnaire data were conducted using Excel, and the Rstudio software was used for statistical analysis.
Data preprocessing: For the personal information section, 81 samples with missing information were deleted. For the HL assessment section, 25 samples had missing values. Of these, 17 samples missed more than two questions and were therefore deleted. For the remaining 8 samples, where one or two questions were missed, we imputed the missing values based on the average score from neighboring questions. In the end, we had 802 valid samples.
Training and Test Sets: Three communities were randomly selected from the nine communities: RH, LD, and WL, comprising a total of 337 samples, and these were used as the test set for external testing. The remaining data, comprising 465 samples, were used as the training set.
Feature Selection: Features with near-zero variance were removed from all features. The remaining features were then subjected to Recursive Feature Elimination (RFE) using the `rfè function from the R language `caret` package. This process involves repeatedly building models and removing features that contribute the least to the model's predictive performance to find the optimal subset of features. In the process of feature selection, backward elimination was initially chosen by us. Backward elimination simplifies the model by gradually removing the least impactful features, aiding in the identification of crucial features for model performance. However, it may be prone to local optima and overlook potential correlations among features. In contrast, RFE can more effectively find the globally optimal feature set through an automated iterative process, albeit requiring more computational resources. Given the moderate sample size and sufficient computational resources in this study, we opted to use RFE for feature selection instead.
Model Construction: Prediction models were established using ML algorithms such as LR, RF, and SVM. The training set was further split into an 8:2 ratio for internal validation. The performance of the models was then compared and validated using Receiver Operating Characteristic (ROC) curves.
Model Evaluation: Calibration curves, decomposition plots, and partial dependence plots were drawn to evaluate and interpret the prediction models.
Results
Basic information of study subjects
A total of 900 questionnaires were collected, and after preprocessing, 802 valid samples were obtained. The study participants were divided into two groups based on their HL scores: those with scores below 130 points (520 cases, representing 65%) were categorized as having insufficient HL. Statistical analysis showed that HL scores of diabetes patients were significantly different in terms of age, education level, income, exercise habits, and dietary control (P < 0.001). The basic characteristics of the survey participants are shown in Table 1.
Basic information of study subjects.

DW: divorced /widowed; ILL: illiterate; PS: primary school; JHS: junior high school; SEC: high school/vocational school/ technical secondary school; UG: College/undergraduate.
Selection of predictive variables
In the `rfè function, cross-validation was selected as the resampling method, RF as the evaluation model, and ROC as the evaluation metric. The `rfè function ultimately recommended 8 variables: educational level, exercise habits, average monthly household income, dietary control, age, inject hypoglycemic drugs, duration of DM, and number of cohabitants (Figure 1). Figure 1(a) shows the impact of the number of variables on model performance, and cross-validation identified 8 as the optimal number of variables. Figure 1(b) shows the importance ranking of variables given by `rfè.

Results of random forest RFE feature selection. (a) The impact of the number of variables on model performance. (b) The importance ranking of variables. diet: dietary control; DD: duration of DM; injection: inject hypoglycemic drugs; number: number of cohabitants.
Construction and validation of prediction models
Construction of the three models
Based on the variable selection and test results mentioned above, the 8 recommended variables provided by RFE were included as model variables, with HL level as the dependent variable (assigned as: HL score ≥130 = 0, HL score <130 = 1). LR, RF, and SVM models were fitted to the data. Cross-validation and grid search methods were used to determine the hyperparameters of the applied models.
Construction of the LR model
For the LR model, we tested both GLM (Generalized Linear Models) and glmnet. Glmnet allows penalization of Lasso or Elastic Net using the regularization parameter lambda, with alpha being the elasticnet mixing parameter. Through cross-validation and grid search, it was found that when lambda = 0.1 and alpha = 0 (ridge penalty), the model performed best. However, there was no significant difference in performance between the GLM model and the tuned glmnet model. Therefore, the GLM method without regularization was used to construct the LR model. The Variance Inflation Factor (VIF) was used to measure multicollinearity among the predictor variables. The highest VIF value obtained was only 1.31, indicating that there were no significant multicollinearity issues among the variables. The comprehensive performance of the LR model in the three communities is shown in Figure 2(a). The recall rates for the RH, LD, and WL communities were 0.778, 0.800, and 0.862, respectively. The area under the curve (AUC) values were 0.810, 0.792, and 0.775 respectively. The Accuracy values were 0.725, 0.747, and 0.753 respectively. Precision evaluates the accuracy of the model in predicting positive classes by measuring how many of the samples predicted as positive are actually positive.

Performance heatmaps and ROC results of the three models in different communities. (a) Performance of LR in the three communities. (b) ROC curve of LR. (c) Performance of RF in the three communities. (d) ROC curve of RF. (e) Performance of SVM in the three communities. (f) ROC curve of SVM.
The Precision values were 0.802, 0.825, and 0.800 respectively. The F1 Score is a metric that combines Precision and Recall, representing their harmonic mean. It evaluates the performance of a classification model by considering both Precision and Recall.
Construction of the RF model
Through cross-validation, the number of trees in the RF model stabilized at 300, so ntree was set to 300. For the mtry parameter, we tested values ranging from 1 to 4 and found that the accuracy was highest when mtry was set to 1. The recall rates for the RH, LD, and WL communities were 0.879, 0.877, and 0.923, respectively. AUC values were 0.781, 0.710, and 0.710, respectively. Accuracy was 0.691, 0.716, and 0.710, while precision was 0.719, 0.750, and 0.732, respectively. The F1 scores were 0.791, 0.809, and 0.816. The prediction results of the RF model in the three communities are shown in Figure 2(c), and the ROC curve is shown in Figure 2(d).
Construction of the SVM model
The `svm` function from the R package `e1071` was used to construct the model. Both radial basis function (RBF kernel) and linear kernel functions were tested. Through cross-validation, it was found that the optimal parameter combination for the radial kernel resulted in the highest average accuracy, with gamma set to 0.01 and cost set to 10. The gamma parameter can be considered the inverse of the range of influence of the support vectors, while the cost represents the penalty factor.
The recall rates for the RH, LD, and WL communities were 0.859, 0.862, and 0.877, respectively. AUC values were 0.813, 0.759, and 0.770, respectively. Accuracy was 0.745, 0.758, and 0.710, while precision was 0.780, 0.800, and 0.750, respectively. The F1 scores were 0.817, 0.830, and 0.809. The prediction results of the SVM model in the three communities are shown in Figure 2(e), and the ROC curve is shown in Figure 2(f).
Comparative analysis of the three models
The recall and AUC metrics of the three models across the three test community datasets are summarized in Figure 3. Recall measures the proportion of actual positive samples (patients with insufficient HL) correctly identified by the model. As shown in Figure 3(a), the recall of the RF model was generally better than that of the LR and SVM models, with LR performing significantly worse than the other two. In contrast, Figure 3(b) shows that the AUC performances of the models were the opposite of the recall results, with LR showing better AUC performance than both RF and SVM, and RF performing worse than the other two models. This may be due to the RF model's relatively loose threshold for classifying positive cases, which allows it to identify more positive cases but also increases the misclassification of negative cases, thereby affecting the AUC value. Given the superior AUC performance of the LR model, this study used LR for model interpretation and evaluation.

Comparison of the performance of three models in three communities. The blue, pink, and green lines represent RF, SVM, and LR, respectively. (a) Comparison of recall values. (b) Comparison of AUC values.
Model evaluation and interpretation
Model evaluation
Calibration curves are primarily used to evaluate the reliability of classification models. The `val.prob.ci.2` function from the `CalibrationCurves` package can generate flexible calibration curves, as shown in Figure 4. This curve reflects the relationship between predicted probabilities and actual frequencies. When plotting calibration curves, confidence intervals are typically drawn at each probability level to reflect the uncertainty of observed frequencies. With an increase in data volume, models often make predictions more confidently, leading to a narrowing of the confidence intervals of the calibration curve. This indicates an increase in the model's certainty in predictions, resulting in a more stable calibration curve. If the sample size is too small, calibration curves may exhibit bias. 28 This was also confirmed by this study: when the three communities were used as independent test sets, the calibration bias was significant (Figure 4(a)–(c)); when the three communities were combined into a single test set, the calibration curve showed some improvement (Figure 4(d)); when all communities were combined into a single test set, the calibration curve significantly improved (Figure 4(e)). Figure 4(e) shows that the calibration curve is slightly higher within the 95% confidence interval, indicating that the model tends to predict that more testers lack a certain level of diabetes HL. This tendency is acceptable in real-life scenarios, as it helps to identify more individuals with insufficient HL.

Calibration curves for different community groups used as test sets. Red represents the ideal curve, black represents the flexible calibration curve, and the gray area represents the confidence interval. If the model's predicted probabilities align with the actual frequencies, the calibration curve will closely follow the 45-degree diagonal line. (a)-(c) Calibration curves with each of the three communities used as individual test sets. (d) Calibration curve with the three communities combined as a test set. (e) Calibration curve with all communities combined as a test set.
Model interpretation
The break-down plot (BDP) can show how the contribution of each variable changes the average prediction of the model to produce the actual prediction for a specific sample (Figure 5). Here, an observation sample was selected: an individual who is illiterate, exercises regularly, has an average monthly household income of less than 3000 Chinese Yuan, lives with five people, is 62 years old, and has diabetes for 10 years.

Variable contribution breakdown plot. (a) The distribution of model predictions for the dataset observations. The first row shows the distribution and mean value of the model's predictions for all data, with the red dot representing the mean value. The second to eighth rows show the average prediction values after fixing each variable value to the selected sample's characteristics. The last row shows the prediction for the sample. The fine gray lines indicate the changes in individual predictions when the specific variable's value is replaced with the sample's value. (b) The contribution of each variable to the prediction for the specific sample. Changes in average predicted values caused by fixing specific variable values are shown in green (positive) and red (negative). (c) Average contribution values of variables. The red and green bars represent negative and positive average values, respectively. The purple box plot summarizes the distribution of attributions for each explanatory variable under different orderings.
In Figure 5(a), in the third row, the exercise variable is fixed at 1 (exercises). It can be seen that the line between the second and third rows slopes downward to the left, indicating that exercising reduces the probability of insufficient HL. Figure 5(b) shows the contribution of each variable to the prediction for this sample. The overall average prediction for the entire dataset is 0.626. The last row shows the predicted value for the specified sample (0.463), which is lower than the overall average. The educational level of 1 (illiterate) significantly increases the predicted value. Exercising (1) and age (62) decrease the predicted value, while the impact of other explanatory variables is not very significant. Furthermore, the order of variables can impact predictions. To eliminate the effect of variable ordering, we calculated the average attribution using the SHAP method (Figure 5(c)). SHAP values, derived from Shapley values in cooperative game theory, quantify the contribution of each feature to the model's predictions. 29 These values represent the average contribution of a feature across all possible feature order combinations, offering a fair and unbiased measure of feature importance.
The partial dependence plot (PDP) can show the relationship between one or two features and the model's predictions and can build an overall partial dependence profile for all observations in the dataset. Since there is no certainty that the relationship between variables and outcomes is linear, the partial dependence plots of the other two models were also considered as references (Figure 6). The two nonlinear models (RF and SVM) indicate the following: (1) For the age variable, the effect of age on the outcome is minimal after 75 years; (2) In terms of educational level, while each level of advancement significantly impacts the outcomes, the probability change resulting from the progression from illiteracy to the primary school stage is relatively small; (3) For the number of cohabitants, the impact on the outcome becomes insignificant when the number exceeds six. Additionally, all three models indicate that exercise habits have a significant impact on the outcome, while income does not have a noticeable effect.
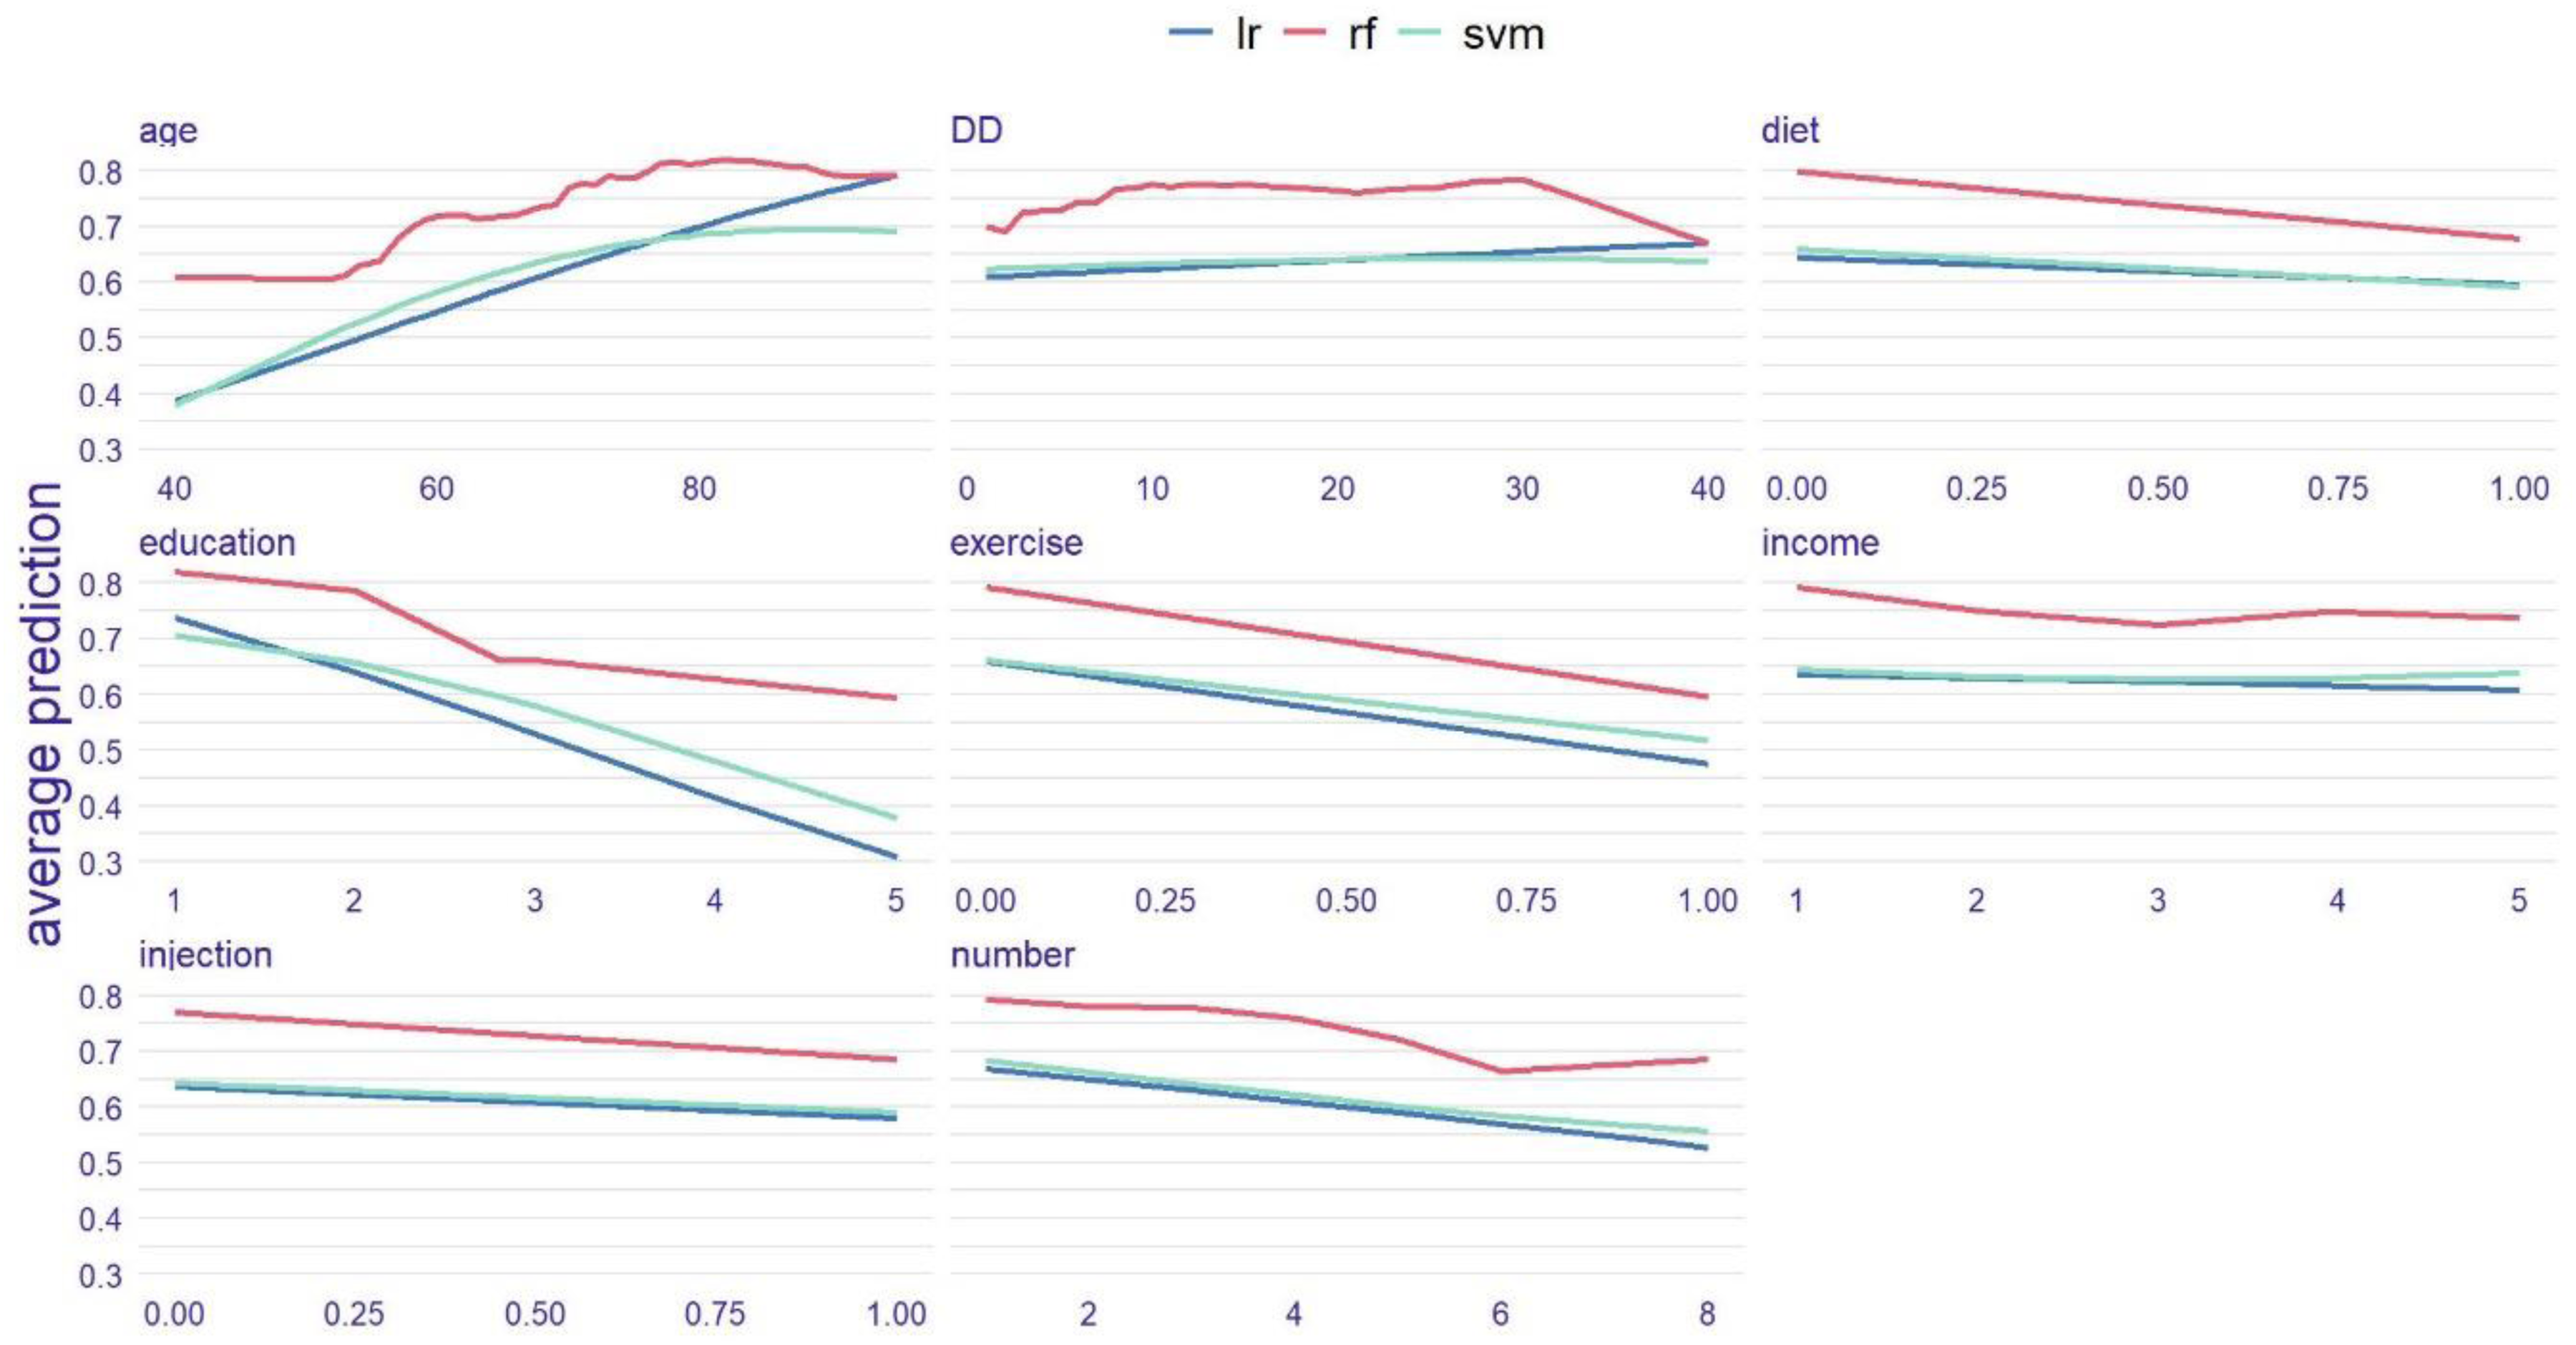
Comparison of partial dependence plots for the three models. Each subplot illustrates the change in predicted probabilities when the current feature varies while holding other features constant. For instance, in the first subplot, as age increases, the risk of inadequate health literacy shows an upward trend. The red, green, and blue lines represent RF, SVM, and LR, respectively.
Discussion
A multicenter approach was used in this study, based on HL level survey data from diabetic patients in nine communities of Chenqiao Street, Chongchuan District, Nantong City. Important personal characteristics were selected using RFE, and prediction models for diabetic patients’ HL were constructed using LR, RF, and SVM. This study enables the rapid prediction of a patient's HL level using objective personal information such as age, income, educational background, and lifestyle, without requiring the patient to answer complex questionnaire items. This not only improves the precision and efficiency of disease management but also provides reference points for personalized health interventions for patients.
Currently, the assessment of HL levels in specific populations mainly relies on questionnaires. Based on survey data, a few researchers have built predictive models for disease-related HL, mainly using traditional ML methods. Among these, LR is widely used and has shown good results. Li et al. 21 built a predictive model to assess HL levels in hypertensive patients using decision trees and LR, with the AUC performances of the two models being comparable (0.813 vs 0.847). Zhou et al. 22 optimized LR, RF, and SVM models using Synthetic Minority Over-Sampling Technique (SMOTE) and showed good accuracy in assessing whether residents and corporate employees had infectious disease HL, with LR achieving the highest accuracy (0.938). In this study, we used LR, RF, and SVM to build a predictive model for HL in diabetic patients. After comprehensive analysis and comparison of the models, LR had the best average AUC (0.79), which also confirmed the effectiveness of LR in this field. We believe that, compared to multimodal complex clinical medical data, survey data is relatively simple, and traditional ML methods can be effective.
In this study, LR and SVM performed similarly in the RH and WL communities, indicating that the datasets in these high-dimensional spaces have nearly linearly separable characteristics. Thus, SVM's nonlinear advantages did not manifest in this context. Compared to LR and SVM, RF exhibits higher recall but lower AUC. This suggests that RF tends to favor positive classes when making predictions, prioritizing recall at the cost of precision, which in turn affects the AUC. The PDP also shows that RF's predicted probabilities are skewed towards higher values. This may be due to the mtry parameter being set to 1, causing each decision tree to select only one randomly chosen feature for node splitting. As a result, the trees are highly similar in feature selection, leading to similar behavior across the forest during predictions. Additionally, the class imbalance in the dataset may further contribute to the higher predicted probabilities of RF.
Relevant studies indicate that HL is associated with various factors, including age, gender, region, education level, monthly income, number of cohabitants, and self-management behaviors, with age and education level being the primary influencing factors,30–33 consistent with the results of this study. Levic et al. 34 suggested that fewer children increased the likelihood of low HL, which is also reflected in our study's PDP for the number of cohabitants. While it is generally believed that average monthly household income may be related to diabetes HL, the importance ranking by RFE suggests this relationship, but PDP indicates that this relationship is very weak, which may be attributed to interactions being considered between features by the RFE method, while interactions are overlooked by PDP, assisting in understanding how individual features affect model predictions by holding other features constant. This oversight leads to differences between model feature selection and their impacts. The results also show that regular exercise significantly affects the HL of diabetic patients, ranking as the third most important factor after age and education level, which has been less mentioned in previous studies.
This study is innovative in using limited information to predict HL levels, marking the first predictive model of HL for diabetic patients based on objective personal information in mainland China. The information required for this predictive function is minimal, saving time and attention, imposing no limitations on cognitive or comprehension abilities, and not causing patients to feel ashamed. The cost of prediction is low, making it convenient to use in regions with lower economic and cultural levels. However, there are some limitations to this study: (1) Although the questionnaire has high reliability and validity, it was not pilot-tested; (2) Convenient sampling was used to select communities. Convenient sampling includes both temporal and spatial convenience. Temporal convenience has introduced an age bias in the survey sample, as household surveys were conducted during working hours, resulting in a concentration of older individuals, while younger individuals were largely in the workforce. This bias may cause the model to perform well on the elderly population but limit its generalizability to middle-aged and younger groups. Spatial convenience sampling has also limited the geographical diversity of the sample, which may reduce the universality of the findings across broader regions. To ensure more representative results in future research, we will adjust the survey timing to include a greater proportion of younger individuals. Additionally, we plan to expand the geographical scope of the sample and explore strategies suitable for different regions or countries, employing more advanced sampling methods such as stratified sampling; (3) Only three classical traditional machine learning methods were utilized in this study. In the future, more methods will be attempted, such as employing artificial neural networks and other deep learning techniques to enhance model performance. Through local model interpretation, the relationship between features and outcomes will be further explored. Additionally, heterogeneity among different age groups or educational levels was acknowledged, and segmentation modeling will also be attempted.
Conclusion
ML models can effectively identify diabetic patients with insufficient HL, facilitating the implementation of targeted interventions to improve their self-management levels. In the future, an HL risk assessment tool for diabetic patients can be developed based on this model. By constructing a user-friendly interactive interface, this tool can be integrated with embedded devices or incorporated into hospital registration or medical record systems, enabling rapid and convenient assessment of diabetic patients’ HL levels. This would enhance patients’ awareness of self-health management, improve the precision of clinical interventions, and provide a basis for the formulation of effective health education policies and measures.
Supplemental Material
sj-doc-1-dhj-10.1177_20552076241311735 - Supplemental material for Construction of a health literacy prediction model for diabetic patients: A multicenter study
Supplemental material, sj-doc-1-dhj-10.1177_20552076241311735 for Construction of a health literacy prediction model for diabetic patients: A multicenter study by Zepeng Wang, Junyi Shi, Fangyuan Jiang, Kui Jiang and Yalan Chen in DIGITAL HEALTH
Footnotes
Acknowledgements
The authors of the study express their sincere gratitude of Nantong Center for Disease Control and Prevention. We would like to thank all participants who assisted the authors to run this study.
Contributorship
Authors ZW, KJ and YC designed the study. JS and FJ participated in the conception of the study. ZW and JS managed and conducted the statistical analyses, machine learning and interpreted the data. ZW and FJ prepared Figures 1–![]() . ZW wrote the first draft, KJ and YC revised it to make the final manuscript. All authors have approved the final manuscript.
. ZW wrote the first draft, KJ and YC revised it to make the final manuscript. All authors have approved the final manuscript.
Declaration of conflicting interests
The authors declared no potential conflicts of interest with respect to the research, authorship, and/or publication of this article.
Ethics approval
This study, including the patient consent process, has been approved by the Medical Ethics Committee at Nantong University (Ethical Approval-2021030) and conforms to the ethical guidelines of the Declaration of Helsinki. Concerning privacy and confidentiality, all data were anonymized to safeguard participant information. Participants did not receive additional compensation for their involvement in this study. This policy was clearly communicated to participants during the informed consent process, ensuring that the study was conducted with transparency and fairness.
Funding
This study was supported by the National Natural Science Foundation of China (NSFC) 82102186; and the Postgraduate Research & Practice Innovation Program of Jiangsu Province KYCX23_3414.
Informed consent
The recruitment of participants is entirely based on the principles of voluntary participation and informed consent. Participants have fully volunteered to take part in the research, having confirmed their willingness in person with the researchers. The first part of the survey questionnaire includes information regarding the patients’ written informed consent. Most patients understand that their participation in the study implies consent. This study aims to maximize the protection of participants’ rights and privacy.
Guarantor
ZP, KJ and YC.
Supplemental material
Supplemental material for this article is available online.
References
Supplementary Material
Please find the following supplemental material available below.
For Open Access articles published under a Creative Commons License, all supplemental material carries the same license as the article it is associated with.
For non-Open Access articles published, all supplemental material carries a non-exclusive license, and permission requests for re-use of supplemental material or any part of supplemental material shall be sent directly to the copyright owner as specified in the copyright notice associated with the article.