
Abstract
Objective
With the increasing prevalence of Parkinson's disease (PD) and the development of PD-based acoustic recording databases, this study aims to evaluate the feasibility of using an ensemble-based machine learning (ML) approach to detect PD across diverse acoustic datasets.
Methods
We utilized three publicly available PD speech datasets—MIU (Sakar), UEX (Carrón), and UCI (Little)—to build ML models incorporating a hybrid preprocessing framework. This framework includes a scaling phase (using RobustScaler), a sampling phase (employing random oversampling (ROS), synthetic minority oversampling technique (SMOTE), and random undersampling (RUS)), and an ML classifier selection phase (featuring eXtreme gradient boosting (XGBoost) and adaptive boosting (AdaBoost)). Performance was evaluated using accuracy, precision, recall, and F1-score metrics. Additionally, we conducted SHAP (SHapley Additive exPlanations) analysis to identify the most significant PD-related acoustic features.
Results
The optimal combination of preprocessing and classification techniques varied across datasets. However, the highest classification performance was generally achieved using RobustScaler for scaling, a combination of ROS, SMOTE, and RUS for sampling, and XGBoost or AdaBoost for classification. The best-performing model on the MIU dataset achieved accuracy of 97.37%, precision of 96.07%, and F1-score of 96.57%. The UEX and UCI datasets achieved perfect classification with 100% accuracy, precision, and recall. SHAP analysis revealed that Mel-frequency cepstral coefficients were consistently among the most influential PD-related acoustic features.
Conclusions
Our findings confirm the feasibility of an ensemble-based approach for PD detection using acoustic recordings, highlighting the importance of dataset-specific preprocessing strategies. This study ranks impactful PD-related acoustic features, offering guidance for future voice-based PD screening tools.
Keywords
Introduction
Parkinson's disease (PD) is a prevalent neurodegenerative disorder affecting over 10 million individuals worldwide. 1 With the aging global population, the number of PD cases is expected to exceed 17 million by 2040. 2 This increasing prevalence places a significant burden on healthcare systems, with the economic cost of PD in the United States alone surpassing $52 billion annually in 2017—a significant increase from 14.4 billion in 2010, and is projected to grow past 79 billion in 2037. 3,4 Early and accurate diagnosis is critical for improving patient outcomes, yet misdiagnosis rates remain high; reaching up to 26% in the United Kingdom. 5 Due to symptom overlap with other neurological disorders such as essential tremor and multiple system atrophy,6,7 PD is often confused with conditions like stroke or superficial siderosis.8,9 Currently, postmortem neuropathological examination remains the gold standard for definitive diagnosis, 10 highlighting the urgent need for accurate premortem diagnostic tools that enable timely interventions.
Recent advances in biomarker discovery,11–13 respiratory dysfunction analysis, 14 and high-field MRI imaging15,16 have contributed to improving PD diagnostics. However, many of these methods require expensive equipment and specialized expertise, limiting their widespread application. Moreover, they are typically employed only after clear motor symptoms have developed, 17 missing the window for early intervention.18,19 In recent studies have shown that voice-based assessments can effectively screen for cognitive and neurological disorders, supporting the use of speech as a scalable digital biomarker.20,21 This further highlights the potential of speech analysis for early detection of PD as a low-cost, noninvasive diagnostic tool.
Despite numerous studies applying machine learning (ML) to Parkinson's-related speech data, key challenges remain: limited dataset generalizability, inconsistent preprocessing pipelines, and high class imbalance often result in overfitted or biased models. Prior work typically focuses on a single dataset or uses narrow classifier types without interpretability.22–24 Our study addresses this gap by proposing a generalized hybrid pipeline that combines robust scaling, multiple resampling techniques, and ensemble classifiers, validated across three heterogeneous datasets, with SHAP-based interpretation to ensure transparency.
Speech as a diagnostic biomarker for PD
Speech impairment is among the earliest detectable symptoms of PD, affecting up to 90% of patients during disease progression, with 78% of those in Hoehn and Yahr Stage 1–2—early stages—showing speech deficits.25–28
These changes, including monotonic speech, reduced volume, and articulatory imprecision, arise from neuromuscular control deficits in the basal ganglia. 29 Unlike MRI-based diagnostics, speech analysis offers a noninvasive, cost-effective, and easily deployable method that can facilitate remote monitoring and large-scale screening.30,31 To extract meaningful information from speech recordings, researchers analyze acoustic features such as:
Several ML models have been applied to classify PD from speech data with promising results.35–38 However, significant challenges remain:
Heterogeneity of datasets—Existing datasets differ in recording conditions, extracted features, feature extraction methods, and participant demographics, making cross-study comparisons difficult.
39
Class imbalance—PD datasets often contain disproportionately fewer healthy controls, leading to biased ML models.40,41 Lack of standardized feature selection—No consensus exists on the optimal speech biomarkers for PD diagnosis, resulting in inconsistent methodologies across studies.
42
Objective of this study
To address these challenges, we propose a hybrid preprocessing and ensemble classification approach for PD speech analysis. Our method integrates:
Multiple data scaling techniques (RobustScaler, MinMaxScaler, Z-score standardization) to reduce dataset heterogeneity Sampling strategies (synthetic minority oversampling technique (SMOTE), random oversampling (ROS), and random undersampling (RUS)) to resolve class imbalance Ensemble learning models (eXtreme gradient boosting (XGBoost), adaptive boosting (AdaBoost), and Random Forest) to enhance classification performance across diverse datasets
We evaluate our framework using three publicly available PD speech datasets (MIU, UEX, and UCI), comparing the impact of scaling, resampling, and classification techniques on diagnostic accuracy. Furthermore, we employ SHAP analysis to identify key acoustic features influencing model predictions, contributing to future research on standardized PD speech biomarkers.
By establishing a generalizable ML pipeline, this study aims to create a simple and robust framework for addressing the complexities of diverse datasets—such as variations in extracted features, sample sizes, demographic compositions, and recording conditions—while maintaining consistent diagnostic performance.
Given the high rates of misdiagnosis and the scarcity of neurologists in many regions, there is an urgent need for scalable, noninvasive, and interpretable screening tools for early PD detection. Voice-based assessments, which can be performed remotely and require minimal equipment, offer a promising solution. This study aims to develop and validate a flexible ML pipeline for voice-based PD screening, providing clinical value in resource-limited settings and telemedicine applications.
Method
Flowchart
Our research utilized speech signal databases from PD patients collected from three distinct medical institutions. Our ensemble method can be split into two stages: preprocessing and classification; in which the database is made more succinct in the preprocessing phase and an ML model is built in the classification phase. In the preprocessing stages, we employ data scaling techniques—Robust Scaler, Max Abs Scaler, Min-Max Scaler, and Standardization—to homogenize the data and sampling techniques—ROS, SMOTE, Border Line SMOTE, adaptive synthetic sampling (ADASYN), RUS, cluster undersampling (CUS), cluster centroid undersampling (CCS), NearMiss (NM) 1, 2, and 3—to address the data imbalance. Next, in the classification stage, the preprocessed data is fed into supervised ML algorithms: AdaBoost, XGBoost, gradient boosted decision trees (GBDT), K nearest neighbors (KNN), random subspace ensemble (RaSE), and Random Forest algorithms to build a model. As part of our approach, the two phases of the preprocessing stage and the machine building phase of the classification stage are serially mixed and matched into multiple learning models; and an extensive comparison of the performance these pathways are conducted. The flowchart below (Figure 1) summarizes our proposed method.

Flowchart of our proposed method.
Overview of selected PD voice datasets
In this study, we utilize three publicly available datasets compiled by Sakar, 22 Carrón, 23 and Little, 24 which contain acoustic features related to PD They were selected for their public availability and extensive documentation, providing a reliable framework for reproducibility and comparative analyses. Each dataset consists of voice recordings collected under different protocols, with variations in participant demographics, recording conditions, and extracted acoustic features. Table 1 provides a consolidated comparison of these datasets.
Comparative summary of PD voice datasets.
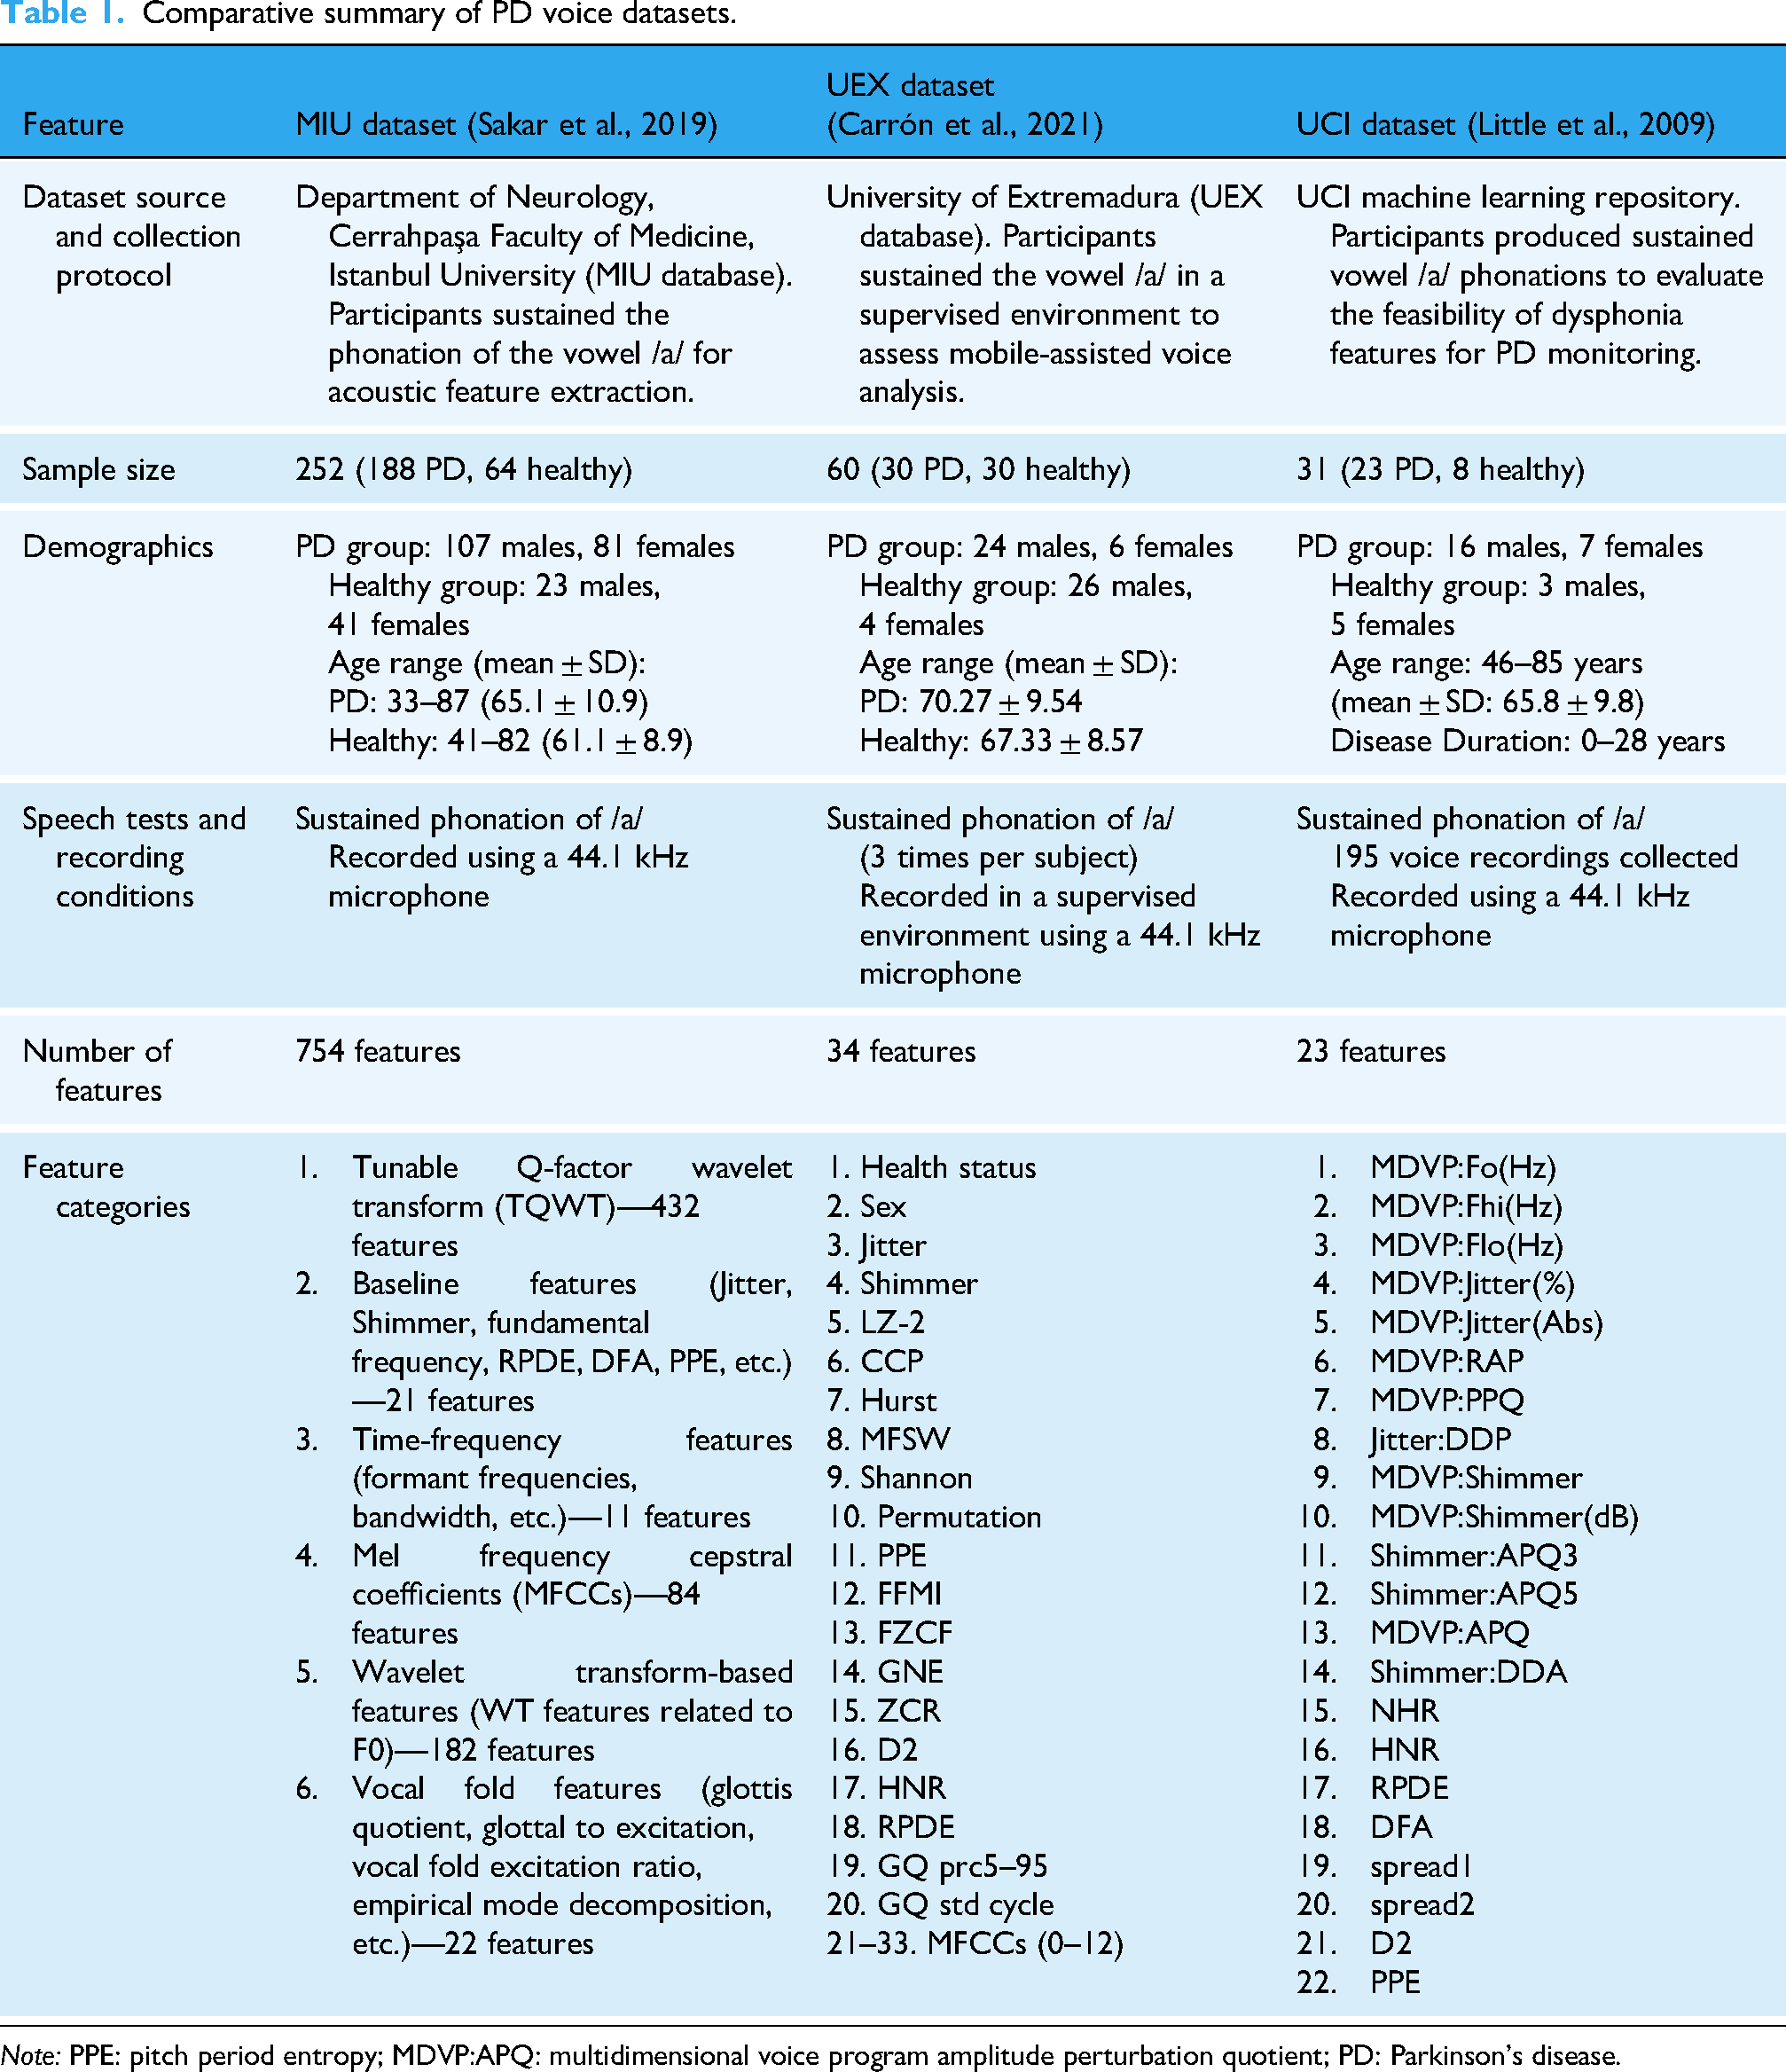
Note: PPE: pitch period entropy; MDVP:APQ: multidimensional voice program amplitude perturbation quotient; PD: Parkinson’s disease.
Dataset origins and collection protocols: The three datasets were collected with a focus on sustained vowel phonation of /a/, which is commonly used in PD speech analysis. While all datasets used microphones with a sampling rate of 44.1 kHz, the UEX dataset specified a supervised recording environment, whereas the MIU and UCI datasets did not provide explicit supervision details.
Participant demographics: The MIU dataset is the largest, containing 252 subjects, while the UCI dataset is the smallest, with only 31 participants. The UEX dataset has a balanced distribution of 30 PD and 30 healthy participants, while the other two datasets have a higher proportion of PD cases. Age distributions also vary, with the MIU dataset covering a broader age range (33–87 years) compared to the UEX (51–87 years) and UCI (46–85 years) datasets. The UCI dataset uniquely reports disease duration, ranging from 0 to 28 years.
Speech analysis and acoustic features: Across the datasets, there are a diverse set of acoustic features; with the MIU being the most extensive (754) and UCI dataset having the smallest scope. These features include baseline measures like jitter, shimmer, and fundamental frequency, which reflect pitch and amplitude instability. Time-frequency features and MFCCs capture spectral and articulatory characteristics affected by PD-related motor dysfunction. More advanced representations, such as wavelet- and TQWT-based features, enable the detection of subtle nonstationary patterns in speech. Complexity and entropy-based measures (e.g. Lempel–Ziv complexity, PPE, DFA, Shannon entropy) provide insight into the irregularity and reduced dynamism typical of PD speech. Collectively, these features offer a multidimensional view of voice pathology, though they are distributed unevenly across datasets, as noted in the introduction.
Each dataset offers unique advantages for PD classification. The MIU dataset provides the most comprehensive feature set, making it ideal for deep feature analysis. The UEX dataset balances PD and control cases while incorporating entropy-based and complexity-related features. The UCI dataset, despite its smaller size, has been widely used in PD speech research due to its simplicity and effectiveness in assessing dysphonia-related features. These variations highlight the importance of selecting appropriate datasets based on research objectives, model complexity, and feature requirements.
Scaling techniques
There is substantial variability in the training parameters, the acoustic features, of the PD datasets, thus it is necessary to standardize the data. In this study, we selected four different methods—based on their ability to reduce dataset heterogeneity and handle outliers effectively—to overcome the challenge
43
:
Robust Scaler, which scales the feature using the median and interquartile range. Max Abs Scaler, which calculates the absolute value maximum normalization. Min-Max Scaler, which scales features into a specified range (i.e. 0 and 1). Standardization (Z-score normalization or Z-score standardization) which scales features to have a mean of 0 and a standard deviation of 1.
Sampling techniques
To balance the datasets, we employ a series of upsampling and downsampling techniques, each used exclusively: if one upsampling technique is applied, other upsampling techniques and downsampling techniques are not used. In upsampling, by synthesizing samples, we are able to amplify the minority class to match the majority class. To do this, we utilize four different methods:
SMOTE, which syntheses samples based on the minority class's k-nearest neighbors; and is applied repeatedly until balance is achieved. ROS, which randomly chooses a sample from the minority class and clones the sample until classes in the dataset is balanced. Borderline SMOTE, which oversamples the samples that are closest to the borderline classifier in both classes. ADASYN, which oversamples based on the learning difficulty of the minority sample; the harder the sample is to learn, the more prioritized. Random subspace undersampling (RAS), which subset features are randomly selected from the majority class to form a feature subspace. RUS, which samples are randomly selected from the majority class. CUS, which a clustering algorithm (e.g. k-means) is used to select sample clusters from the majority class. CCS, which a clustering algorithm (e.g. k-means) is used to select sample clusters form the majority class and a centroid (mean or median) of each cluster is calculated. NM under-sampling variants (NM1, NM2, NM3), which selects samples in the majority class that are most similar to samples in the minority class. Once samples are selected, they are removed; and this process is iteratively applied until balance is attained in the dataset.
In downsampling, by removing the resemble data, the majority class can be reduced to fit the minority class. To do this, we utilize a selection of five different methods:
These techniques were selected based on their effectiveness in handling biomedical class imbalance problems in prior literature,44–47 ensuring our pipeline remains generalizable and robust across datasets of varying PD/control ratios.
ML algorithms
In our study, a diverse array of supervised ML classifiers was employed. These classifiers encompassed a range of algorithms aimed at predicting outcomes based on input features. The classifiers utilized in our analysis included the following: “AdaBoost,” “XGBoost,” “GBDT,” “KNN,” “RaSE,” and “Random Forest.” Adaptive boosting (“AdaBoost”) combines multiple weak classifiers in which recurrent misclassifications are weighted more heavily to create a strong classifier. “GBDT,” iteratively builds a stronger classifier by combining a series of weak learners in a sequential manner. “XGBoost”, is an improved version of GBDT with added regularization, tree pruning, missing value handling and tuning. “KNN” is a supervised learning classifier that makes classifications based on its similarity with known data “RaSE” combines many weak classifiers, where each classifier is trained in a randomly selected subspace. “Random Forest” is an ensemble method that constructs multiple decision trees and combines their predictions.
By employing a diverse set of classifiers, this study explores multiple approaches to predictive modeling, evaluating the strengths and limitations of each. While more advanced ML and deep learning methods exist, our goal is to develop a simple, efficient approach that requires minimal tuning—facilitating real-time use and broader accessibility. Moreover, this simplicity enables rapid updates as new data becomes available, allowing the model to improve continuously without substantial delay. This flexibility is particularly important in PD research, where voice datasets are often heterogeneous, and patient characteristics can vary substantially. A comprehensive analysis of these models provides deeper insight into which techniques are most effective in PD detection with acoustic features. We prioritized ensemble methods such as XGBoost and AdaBoost due to their robustness on tabular and heterogeneous biomedical data.48,49 These algorithms have demonstrated high accuracy and interpretability in PD voice classification, making them suitable for our pipeline. Additionally, models like GBDT, KNN, and RaSE were included for comparative analysis.
Performance evaluation
The performance of models was evaluated based on four widely used classification metrics: accuracy, precision, recall (sensitivity), and F1-score. These metrics are defined as follows:
Accuracy measures the proportion of all correct predictions among total predictions. Precision indicates how many of the samples predicted as positive (PD) are truly positive. Recall (or sensitivity) measures the ability of the model to detect actual PD cases. F1-score is the harmonic mean of precision and recall, providing a balanced assessment in imbalanced datasets.


These metrics were chosen to provide both statistical rigor and clinical relevance. In real-world medical applications, recall is particularly critical, as missing a PD diagnosis (false negative) could delay treatment and worsen patient outcomes. Precision is equally important to avoid false alarms and prevent unnecessary psychological burden or clinical referrals. F1-score balances both concerns and is especially useful when class distributions are unequal, as in many PD datasets. Finally, accuracy alone may be misleading in imbalanced data, and is therefore considered alongside the other metrics. This comprehensive evaluation framework allows for a more realistic assessment of how the model would perform in clinical screening or triage scenarios.
Results
Performance metrics for different scaling and sampling techniques
MIU database
This study investigates the application of ML techniques for PD classification using the MIU dataset. The focus lies on evaluating the impact of scaling and sampling methods on model performance, alongside an analysis of optimized threshold adjustments. The results are supported by visualizations such as confusion matrices and ROC curves (Figures 2 and 3) as well as detailed performance metrics (Tables 2 and 3).

Parkinson's disease prediction on the MIU test dataset (a) confusion matrix (b) area under the ROC curve and optimal threshold.

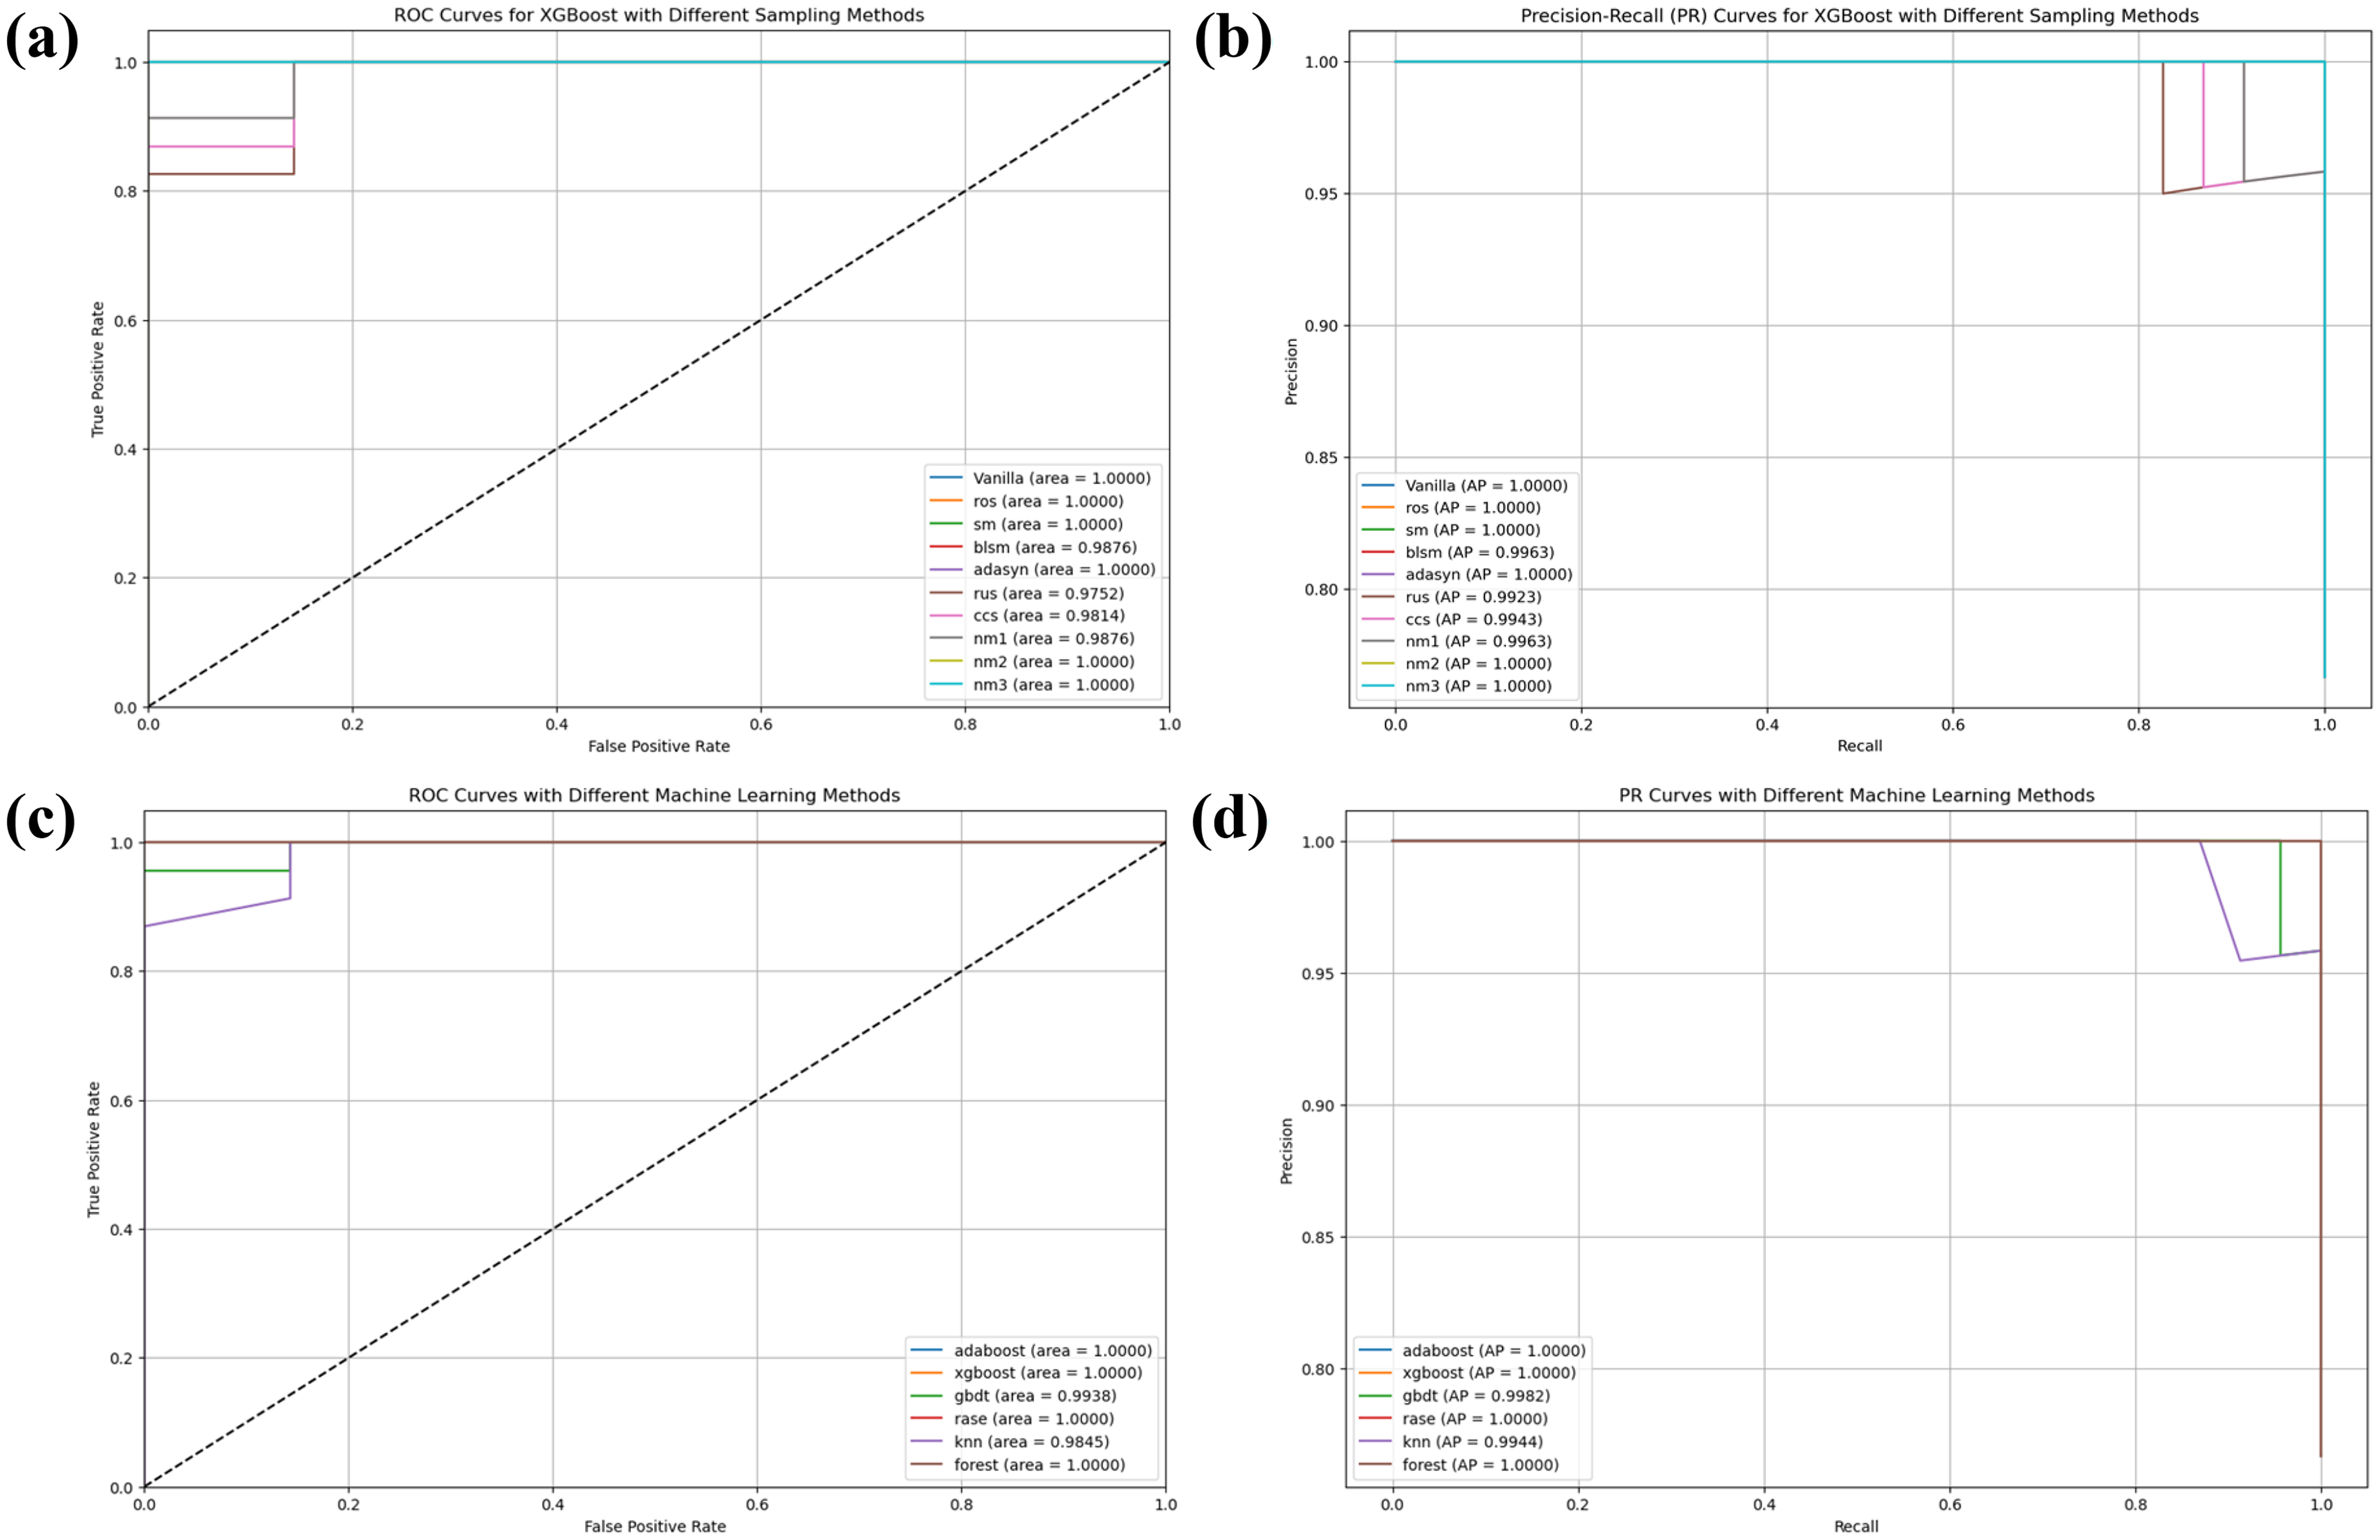
Performance evaluation using ROC and PR curves for Parkinson's disease prediction on the MIU test dataset (a) and (b): ROC and PR curves for XGBoost with different sampling methods (c) and (d): ROC and PR curves comparing different machine learning models.
Performance metrics for scaling and sampling techniques on MIU database.
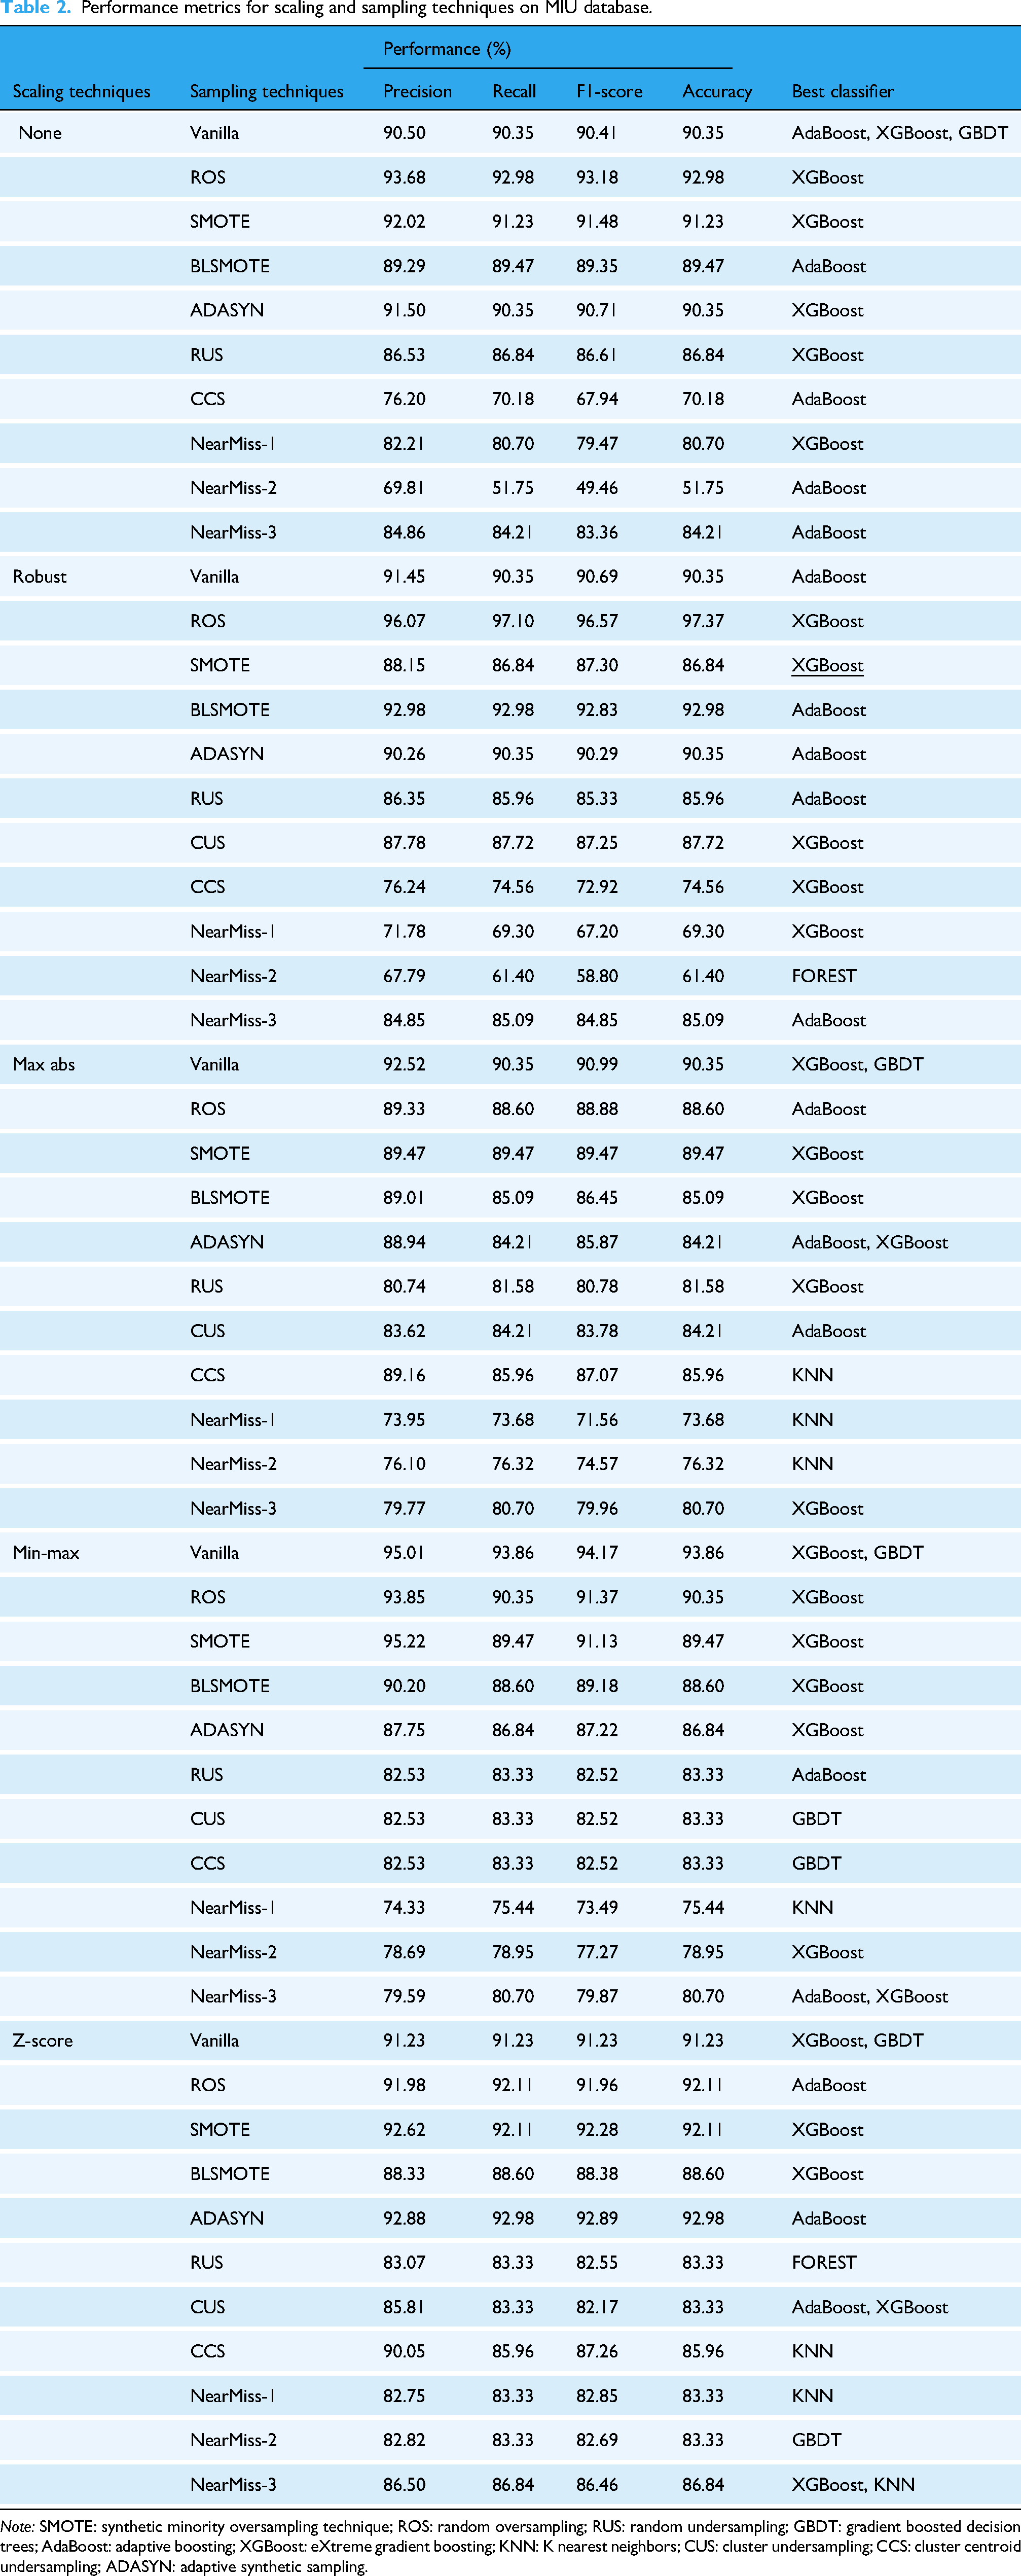
Note: SMOTE: synthetic minority oversampling technique; ROS: random oversampling; RUS: random undersampling; GBDT: gradient boosted decision trees; AdaBoost: adaptive boosting; XGBoost: eXtreme gradient boosting; KNN: K nearest neighbors; CUS: cluster undersampling; CCS: cluster centroid undersampling; ADASYN: adaptive synthetic sampling.
Classification report for the MIU test dataset using an adjusted threshold (0.79).

The experimental results reveal that robust scaling combined with ROS achieved the highest accuracy of 97.37% when paired with the XGBoost classifier. This configuration also yielded a precision of 96.07%, recall of 97.10%, and an F1-score of 96.57%, as shown in Table 3. Comparatively, Z-score scaling with ADASYN sampling demonstrated lower performance, achieving an accuracy of 92.98%. min–max scaling without any sampling (Vanilla) performed moderately well, with XGBoost and GBDT achieving a precision of 95.01%.
The confusion matrix for the MIU test dataset (Figure 2(a)) illustrates that the model correctly classified 28 true negatives and 83 true positives, with only one false positive and two false negatives. This corresponds to a sensitivity of 97.65% and a specificity of 96.55%. The high classification accuracy is further corroborated by the ROC curve (Figure 2(b)), where the model achieved an area under the curve (AUC) of 0.99432 at an optimal threshold value of 0.79.
When comparing sampling techniques, SMOTE paired with XGBoost delivered superior results, achieving an AUC of 0.9980, followed by ROS at 0.9943 and Vanilla at 0.9899 (Figure 3(a)). Precision-Recall curves further validate these findings, with SMOTE attaining an Average Precision (AP) of 0.9993 (Figure 3(b)), outperforming ROS (AP = 0.9980) and Vanilla (AP = 0.9966). Conversely, under-sampling methods such as Near-Miss variant 2 (NM2) performed poorly, with an AUC of only 0.8114 and AP = 0.9262.
A comparative analysis across ML models highlights XGBoost's superior performance, achieving an AUC of 0.9943 compared to GBDT (AUC = 0.9448) and Random Forest (AUC = 0.9323). KNN, however, struggled to capture complex patterns in the data, with an AUC of just 0.6582 (Figure 3(c)).
In conclusion, this study underscores the effectiveness of ensemble-based methods like XGBoost for PD classification tasks when paired with appropriate scaling and oversampling techniques such as ROS or SMOTE. These approaches not only address class imbalance but also enhance diagnostic accuracy, as evidenced by robust metrics and visual analyses.
UEX database
This study examines the application of ML techniques for classification using the UEX database. The research focuses on evaluating various scaling and sampling methods and their impact on model performance, along with threshold optimization for classification accuracy. The findings are supported by visualizations including an ROC curve and confusion matrix (as shown in the uploaded images) as well as comprehensive performance metrics presented in Tables 4 and 5.
Performance metrics for scaling and sampling techniques on UEX database.

Note: SMOTE: synthetic minority oversampling technique; ROS: random oversampling; RUS: random undersampling; GBDT: gradient boosted decision trees; AdaBoost: adaptive boosting; XGBoost: eXtreme gradient boosting; RaSE: random subspace ensemble; KNN: K nearest neighbors; CUS: cluster undersampling; CCS: cluster centroid undersampling; ADASYN: adaptive synthetic sampling.
Classification report for the UEX test dataset using an adjusted threshold (0.52).

The experimental results from Table 4 demonstrate that multiple scaling-sampling combinations achieved perfect classification performance (100% precision, recall, F1-score, and accuracy). Notable among these are robust scaling with Vanilla and ROS sampling techniques, which attained perfect scores when paired with AdaBoost and RaSE classifiers. Similarly, no scaling (none) combined with SMOTE, RUS, and NM techniques achieved 100% performance with XGBoost. Min-max scaling with BLSMOTE and RUS also reached perfect classification metrics when used with the RaSE classifier. Conversely, Z-score scaling consistently underperformed across all sampling techniques, with accuracy values predominantly between 66.67% and 77.78%.
The classification report in Table 5 confirms that implementing an adjusted threshold of 0.52 for the UEX test dataset resulted in flawless classification performance. This optimized threshold yielded perfect precision, recall, F1-score, and accuracy values of 1.0000 across both viable and nonviable classes.
The confusion matrix for the test dataset (Figure 4) demonstrates that the model correctly classified four true negatives (non-Parkinson's cases) and five true positives (Parkinson's cases), with no false positives or false negatives. This corresponds to a sensitivity of 100% and a specificity of 100%, indicating perfect classification performance. The ROC curve (Figure 4(b)) further supports this result, showing an AUC of 1.000, signifying ideal model discrimination ability. The optimal threshold value for classification is identified as 0.52, marked by the red dot on the curve.

Parkinson's disease prediction on the UEX test dataset (a) confusion matrix (b) area under the ROC curve and optimal threshold.
Figure 5 showcases a comprehensive performance evaluation for PD prediction on the UEX test dataset using both ROC and PR curves. The analysis reveals several important findings about sampling techniques and model selection.

Performance evaluation using ROC and PR curves for Parkinson's disease prediction on the UEX test dataset (a) and (b): ROC and PR curves for XGBoost with different sampling methods (c) and (d): ROC and PR curves comparing different machine learning models.
When comparing sampling techniques, multiple methods achieved optimal performance when paired with AdaBoost, with Vanilla, ROS, NM1, and RUS all attaining perfect AUC scores of 1.0000 (Figure 5(a)). Precision-Recall curves further validate these findings, with these methods achieving AP of 1.0000 (Figure 5(b)). Some sampling techniques demonstrated slightly reduced performance, such as SMOTE (SM) with an AUC of 0.9500 and Borderline SMOTE (BLSM) with an AUC of 0.8500. Similarly, CCS showed an AUC of 0.8500, and NM2 achieved an AUC of 0.9000 with corresponding AP = 0.9267.
A comparative analysis across ML models highlights the exceptional performance of several algorithms on this dataset. AdaBoost, XGBoost, GBDT, RaSE, and KNN all achieved perfect classification with AUC scores of 1.0000 (Figure 5(c)). These findings are reinforced by the PR curves, with all these models attaining AP scores of 1.0000 (Figure 5(d)). Random Forest showed slightly lower performance with an AUC of 0.9000 and AP of 0.9250, though still demonstrating strong predictive capability.
In conclusion, this study underscores the effectiveness of ensemble-based methods like AdaBoost and XGBoost for PD classification when paired with appropriate sampling techniques. Several sampling approaches, including Vanilla, ROS, NM1, and RUS, achieved perfect classification metrics, indicating their effectiveness in addressing the inherent challenges in medical diagnostic data. The consistent performance across multiple evaluation metrics demonstrates the robustness of these approaches for developing reliable diagnostic tools for PD.
UCI database
This study examines the application of ML techniques for PD classification using the UCI dataset. The research focuses on evaluating various scaling and sampling methods and their impact on model performance, along with threshold optimization for classification accuracy. The findings are supported by visualizations including a confusion matrix and ROC curve (as shown in the uploaded images) as well as comprehensive performance metrics presented in Tables 6 and 7.
Performance metrics for scaling and sampling techniques on UCI dataset.

Note: SMOTE: synthetic minority oversampling technique; ROS: random oversampling; RUS: random undersampling; GBDT: gradient boosted decision trees; AdaBoost: adaptive boosting; XGBoost: eXtreme gradient boosting; RaSE: random subspace ensemble; KNN: K nearest neighbors; CUS: cluster undersampling; CCS: cluster centroid undersampling; ADASYN: adaptive synthetic sampling.
Classification report for the UCI test dataset using an adjusted threshold (0.91).

The experimental results from Table 6 demonstrate that several scaling-sampling combinations achieved perfect classification performance (100% precision, recall, F1-score, and accuracy). Notable among these are Max Abs scaling with Vanilla sampling, which attained perfect scores when paired with XGBoost and GBDT classifiers. Max Abs scaling also achieved 100% performance when combined with ROS and CUS sampling techniques using XGBoost. Robust scaling demonstrated strong results as well, with CUS sampling reaching 96.67% accuracy when used with AdaBoost. Conversely, CCS with Robust scaling produced the lowest performance among all combinations, achieving only 76.67% accuracy across AdaBoost, GBDT, and KNN classifiers.
The classification report in Table 7 confirms that implementing an adjusted threshold of 0.91 for the UCI test dataset resulted in flawless classification performance. This optimized threshold yielded perfect precision, recall, F1-score, and accuracy values of 1.0000 across both classes (nonviable and viable).
The confusion matrix for the test dataset (Figure 6(a)) demonstrates that the model correctly classified seven true negatives (non-Parkinson's cases) and 23 true positives (Parkinson's cases), with no false positives or false negatives. This corresponds to a sensitivity of 100% and a specificity of 100%, indicating perfect classification performance. The ROC curve (Figure 6(b)) further supports this result, showing an AUC of 1.0000, signifying ideal model discrimination ability. The optimal threshold value for classification is identified as 0.91, marked by the red dot on the curve.

Parkinson's disease prediction on the UCI test dataset (a) confusion matrix (b) area under the ROC curve and optimal threshold.
Figure 7 showcases a comprehensive performance evaluation for PD prediction on the UCI test dataset using both ROC and PR curves. The analysis reveals several important findings about sampling techniques and model selection.
Performance evaluation using ROC and PR curves for Parkinson's disease prediction on the UCI test dataset (a) and (b): ROC and PR curves for XGBoost with different sampling methods (c) and (d): ROC and PR curves comparing different machine learning models.
When comparing sampling techniques with XGBoost, several methods achieved optimal performance, with Vanilla, ROS, SMOTE (SM), ADASYN, NM2, and NM3 all attaining perfect AUC scores of 1.0000 (Figure 7(a)). Precision-Recall curves further validate these findings, with these methods achieving AP of 1.0000 (Figure 7(b)). Some sampling techniques demonstrated slightly reduced performance, such as BLSM with an AUC of 0.9876 and AP of 0.9963, and RUS with an AUC of 0.9752 and AP of 0.9923. Similarly, CCS showed an AUC of 0.9814 and AP of 0.9943, while NM1 achieved an AUC of 0.9876 with AP of 0.9963.
A comparative analysis across ML models highlights the exceptional performance of several algorithms on this dataset. AdaBoost, XGBoost, RaSE, and Random Forest all achieved perfect classification with AUC scores of 1.0000 (Figure 7(c)). These findings are reinforced by the PR curves, with all these models attaining AP scores of 1.0000 (Figure 7(d)). GBDT showed slightly lower performance with an AUC of 0.9938 and AP of 0.9982, while KNN demonstrated the lowest performance among the tested models with an AUC of 0.9845 and AP of 0.9944, though still exhibiting strong predictive capability.
In conclusion, this study underscores the effectiveness of ensemble-based methods like AdaBoost, XGBoost, and Random Forest for PD classification when paired with appropriate sampling techniques. Several sampling approaches, including Vanilla, ROS, SM, ADASYN, NM2, and NM3, achieved perfect classification metrics when used with XGBoost, indicating their effectiveness in addressing the inherent challenges in medical diagnostic data. The consistent performance across multiple evaluation metrics demonstrates the robustness of these approaches for developing reliable diagnostic tools for PD.
Analysis of differential features of datasets on model output
A SHAP analysis50,51 was done and the impact differential features on model output are exhibited in Figures 8–10. The (a)s of Figures 8–10 show the top 20 features in terms of magnitude of impact of each feature on model output (represented by SHAP values); and is presented in a descending order where the features with most impact are at the top and features with least impact are at the bottom. The (b)s of Figures 8–10 correspond to Figure (a): features with most impact descends from the top, and shows the impact of feature value (high or low) on model output. If there are a lot of red (high) points on the right of the zero for a feature, it means that the higher the value of the feature, the more likely the patient has PD. Conversely, if there are a lot of blue (low) points on the left of the zero for a feature, it means that the lower the value of the feature, the less likely the patient has PD. Moreover, the righter or left the points are, the more strongly it is positively or negatively correlated to PD.

Summary of SHAP analysis of the MIU database. (a) Bar plot demonstrating the magnitude of impact of features on model output (b) distribution illustrating the impact of feature values on model output of differential features.

Summary of SHAP analysis of the UEX dataset. (a) Bar plot demonstrating the magnitude of impact of features on model output (b) distribution illustrating the impact of feature values on model output of differential features.
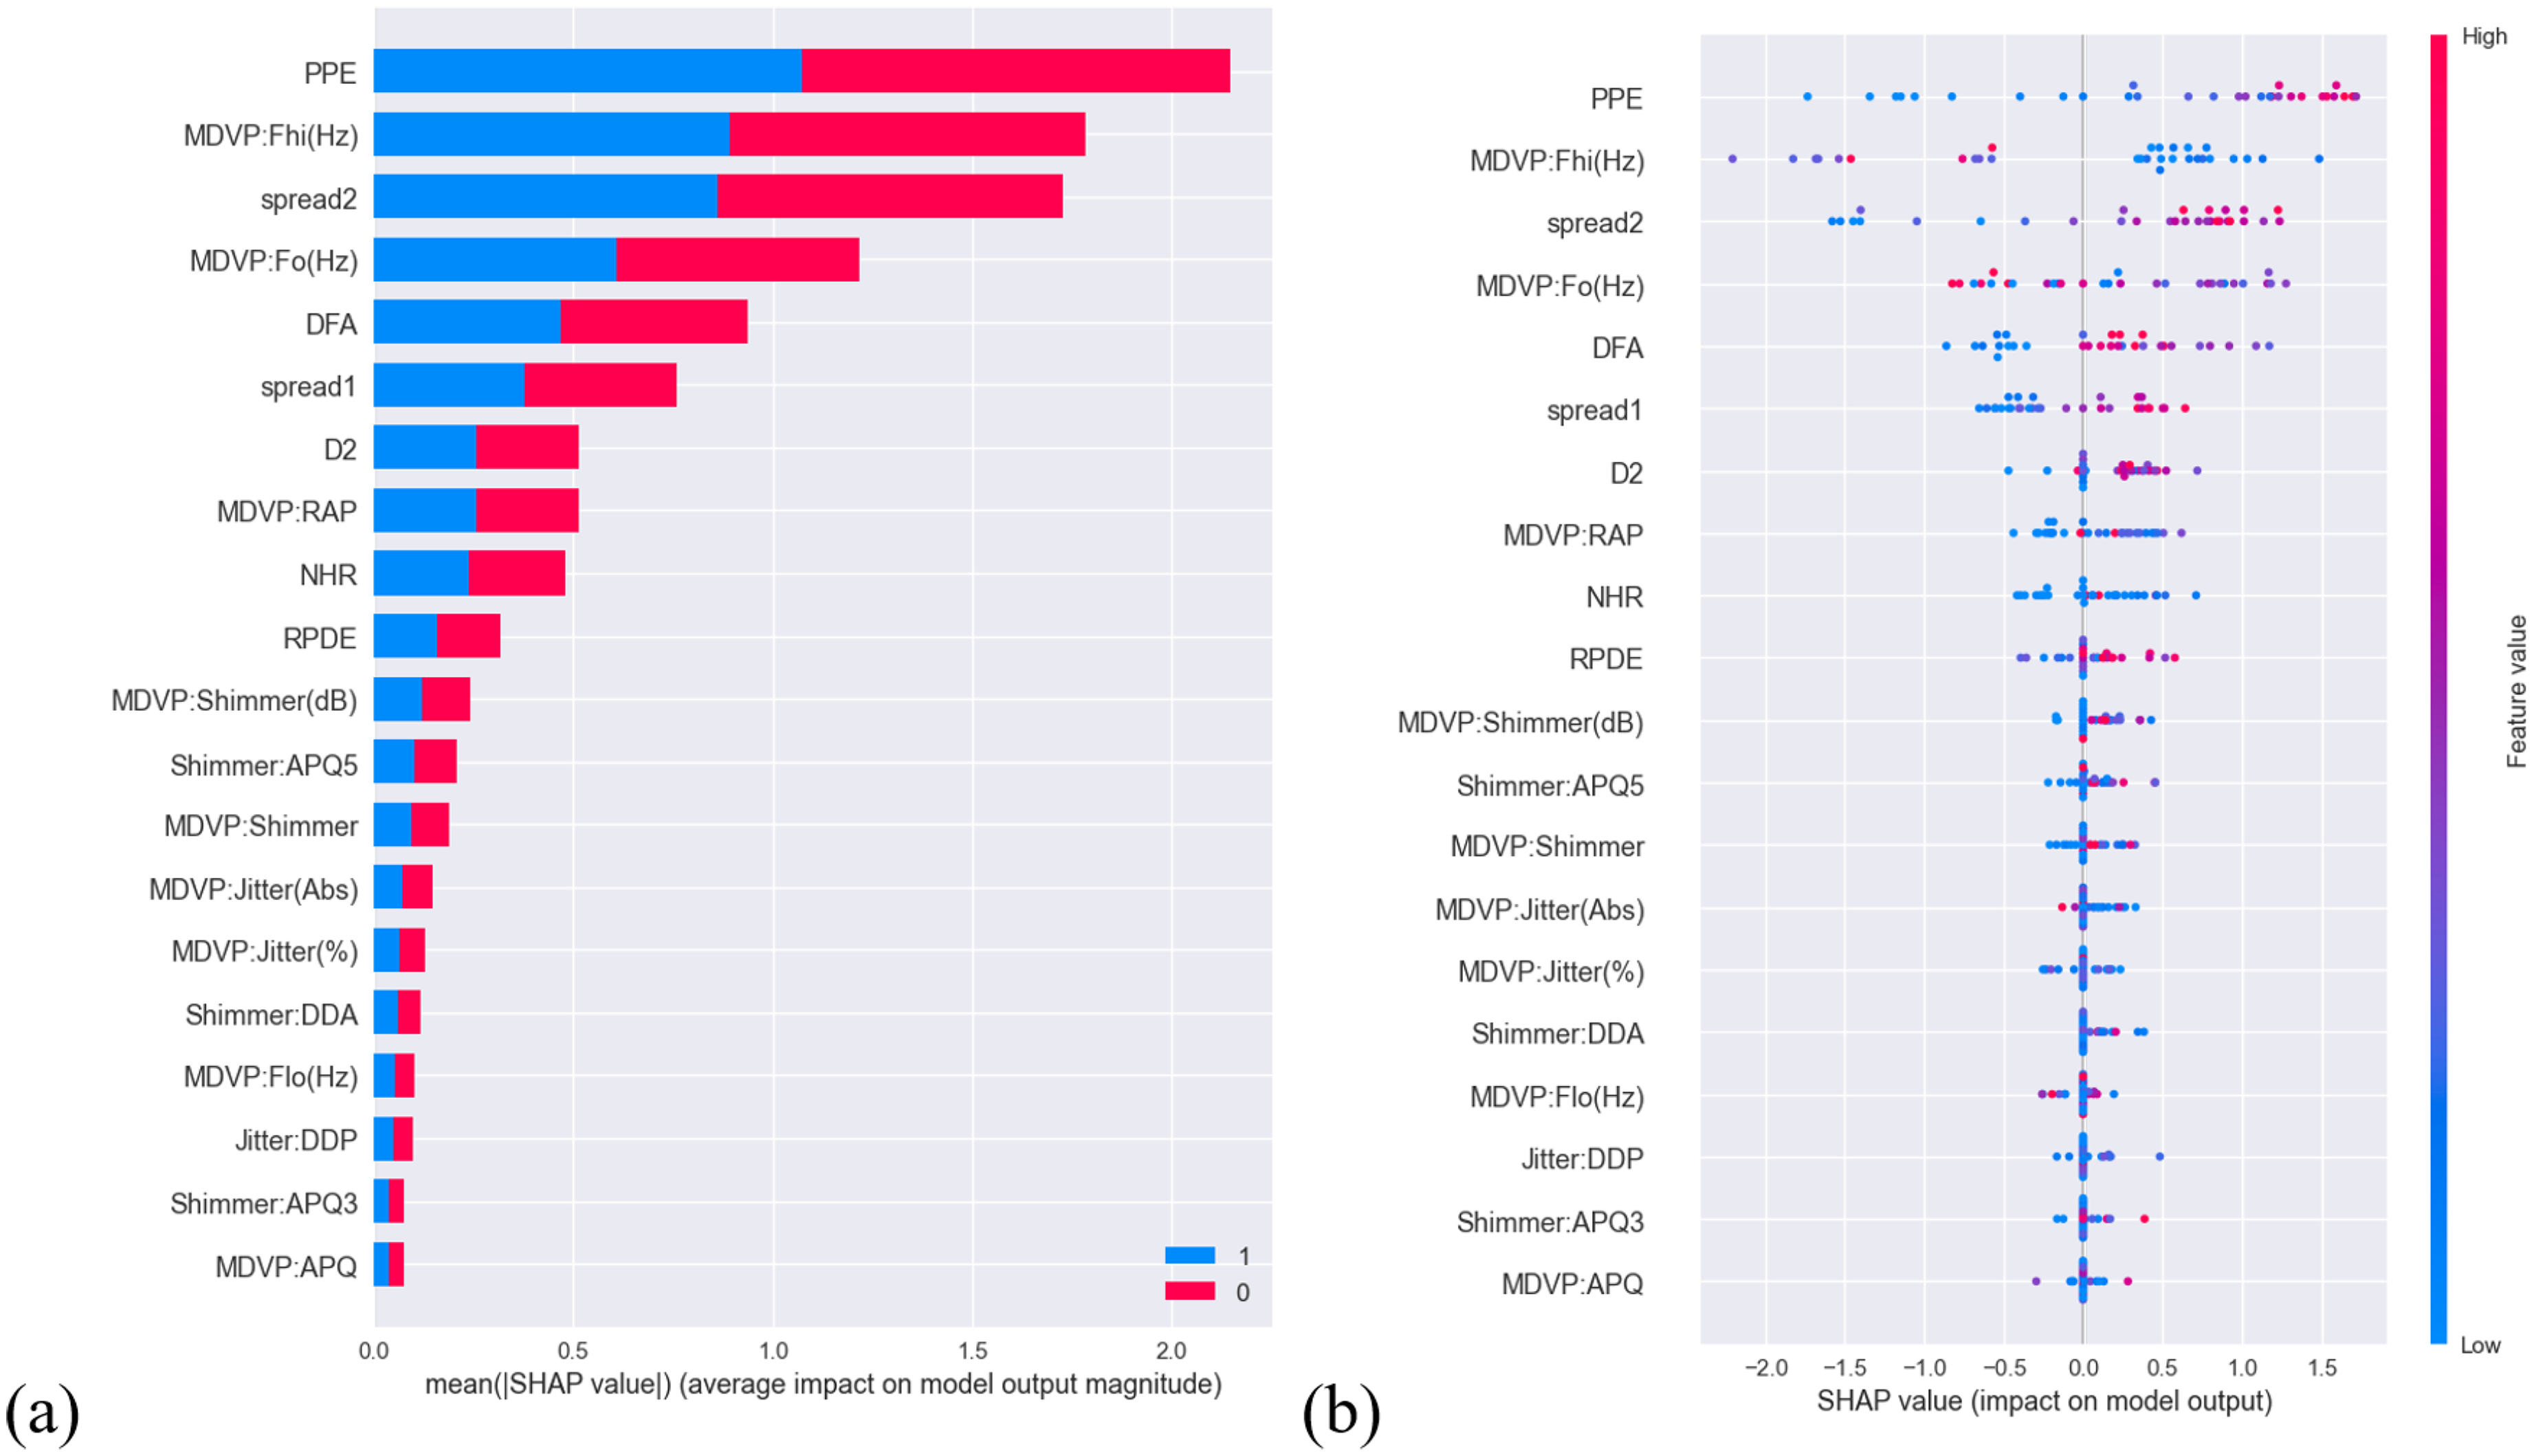
Summary of SHAP analysis of the UCI dataset. (a) Bar plot demonstrating the magnitude of impact of features on model output (b) distribution illustrating the impact of feature values on model output of differential features.
In Figure 8(a), the plot shows the features: std_delta_delta_log_energy (the standard deviation of the change in the delta delta log energy across multiple frames of a speech signal), to tqwt_minValue_dec_11 (minimum value of a voice signal after applying TQWT at level 11)—the first six, played a relatively substantial role on model output. The features: tqwt_kurtosisValue_dec_26 (kurtosis of the voice signal at TQWT decomposition level 26) to std_8th_delta_delta (standard deviation of the eighth delta-delta feature)—the last six, had marked lower impact on model output; everything in between had a moderate impact. In Figure 8(b) whether a feature value has a positive or negative impact on model output is relatively distinct, as in each feature the blues and reds are distinctly polarized to one end with minimal mixing of the two (blue and red) or anything color in between.
In Figure 9(a), the plot shows that features: cepstral peak prominence (CPP) and LZ-2 (Lempel—Ziv complexity)—the first two, had a considerable influence on model output. The last 10 features: MFCC8 to fundamental motor moment inconsistency had notably diminished impact on model output; everything in between had a moderate to low impact. In Figure 9(b) points for each feature are sparsed and there is mixing between the two colors: red and blue, thereby it is difficult to draw a clear line to see whether the value of each feature is positively or negatively correlated with PD. However, it does seem to some extent it seems like CPP is negatively correlated with PD and LZ-2 is positively correlated with PD.
In Figure 10(a), the plot shows that features: PPE, multidimensional voice program (MDVP):Fhi(Hz) (maximum vocal fundamental frequency) and spread2 (frequency variation)—the first three, contributed significantly on model output. The last 10 features: MDVP:Shimmer(dB) (MDVP local shimmer in dB) to MDVP:amplitude perturbation quotient (APQ) played a far lesser role on model output; everything in between had a moderate to low impact. In Figure 10(b), other than the first seven features, it is difficult to draw conclusion on whether feature values for each feature are positively or negatively correlated to PD.
Discussion
This study establishes the effectiveness of ensemble ML approaches combined with hybrid preprocessing techniques for PD detection using heterogeneous speech datasets. By integrating RobustScaler for feature normalization, dynamic resampling strategies (ROS/SMOTE/RUS), and optimized classifiers (XGBoost, AdaBoost), the framework achieved up to 97.37% accuracy on the MIU dataset and perfect classification (100%) on both the UEX and UCI datasets. SHAP analysis identified MFCCs as consistently influential biomarkers; moreover, our study suggests that the proposed approach may offer improved performance compared to existing methods, based on comparative evaluations. Critical limitations include dataset size constraints and reliance on sustained vowel phonation, highlighting the need for longitudinal multi-modal validation in future research. Among all classifiers tested, XGBoost consistently delivered the best performance, particularly when used with SMOTE or ROS, due to its ability to capture complex feature interactions in high-dimensional spaces. Conversely, AdaBoost performed optimally on smaller, balanced datasets like UEX, likely benefiting from its sequential emphasis on misclassified instances. These findings demonstrate the importance of aligning model complexity with dataset characteristics (see Table 8).
Dataset characteristics and model response.
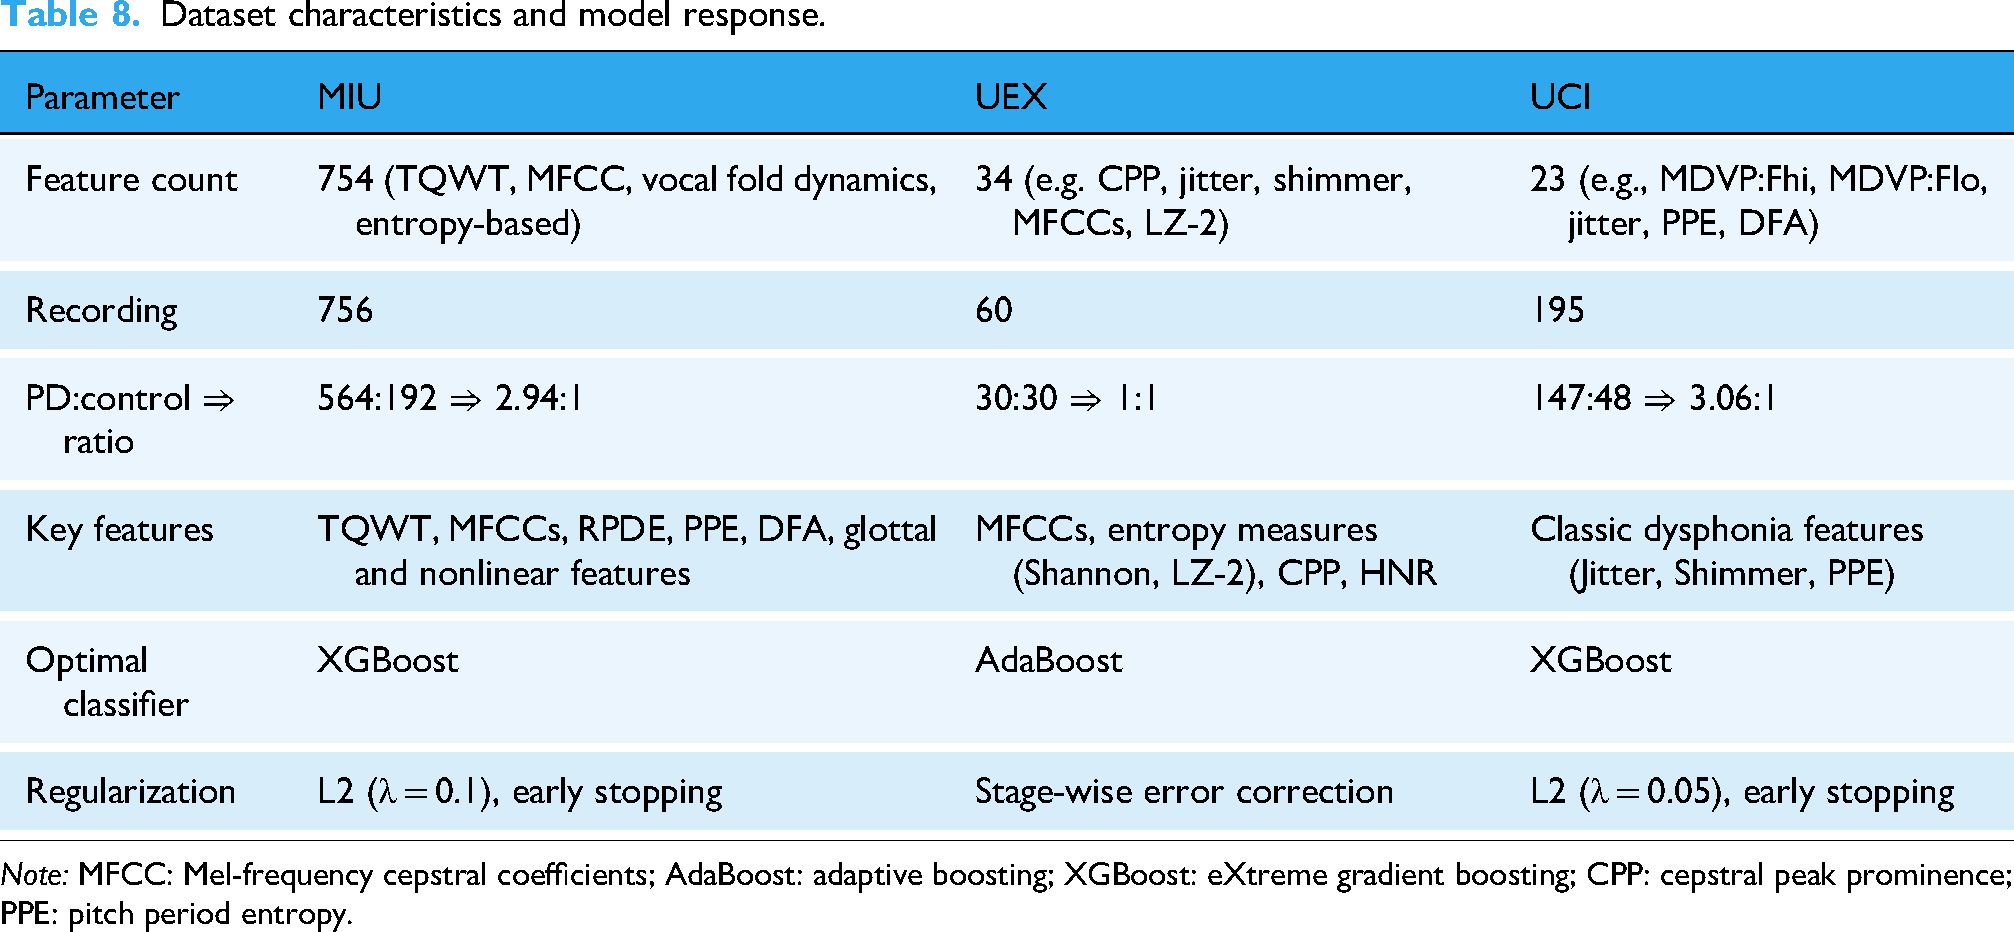
Note: MFCC: Mel-frequency cepstral coefficients; AdaBoost: adaptive boosting; XGBoost: eXtreme gradient boosting; CPP: cepstral peak prominence; PPE: pitch period entropy.
Comparative analysis across heterogeneous datasets
The varying performance across the three datasets can be attributed to differences in sample distribution, feature dimensionality, and feature types. The MIU dataset, with its high-dimensional feature space (754 features), includes complex representations such as TQWT-based decompositions, MFCCs, and nonlinear dynamics (e.g. RPDE, PPE, DFA). These complex, high-variance features introduced nonlinear decision boundaries, requiring a robust model like XGBoost with L2 regularization (λ = 0.1) and early stopping (patience = 10) to control overfitting and maintain generalization.
In contrast, the UEX dataset offered a balanced PD:control ratio (1:1) and moderate feature complexity (34 features), including entropy-based metrics (e.g. Shannon entropy, LZC), CPP, and MFCCs. This configuration proved ideal for AdaBoost, which effectively leveraged its stage-wise additive correction to minimize classification errors. However, AdaBoost's sensitivity to noisy labels and its reliance on weak classifiers performing better than random guessing (ɛ < 0.5) highlight the importance of careful feature preprocessing and base estimator selection to ensure robust performance.
The UCI dataset, while smaller and limited to 23 traditional dysphonia features (e.g. MDVP jitter, shimmer, and PPE), demonstrated sufficient class separation despite strong class imbalance (147 PD vs 48 controls, ratio 3.06:1). XGBoost performed well on this dataset with minimal L2 regularization (λ = 0.05), likely due to the high discriminative power of the features and consistent patterns in the majority class. However, class imbalance typically reduces minority class recall and biases the model toward the majority class; techniques such as SMOTE or class weighting could further enhance performance by addressing this imbalance.
These observations highlight the significant influence of dataset characteristics—such as feature complexity, class imbalance, preprocessing strategies, and feature interactions—on model selection and regularization choices. For instance, the time-series nature of MFCCs may interact differently with the axis-aligned splits of tree-based models compared to entropy-based features like Shannon entropy or LZC. A nuanced understanding of these interactions is essential for optimizing classification performance, as summarized in Table 8.
Comparison with existing literatures
The proposed dynamic multiscale resampling framework demonstrates significant advancements in handling imbalanced biomedical datasets, as evidenced by comparative evaluations across three benchmark repositories (MIU, UEX, and UCI). The comparison is detailed in Table 9, highlighting the performance metrics of precision, recall, F1-score, and accuracy.
The dynamic multiscale resampling machine learning compares with the mainstream baseline and state-of-the-art models on three datasets.
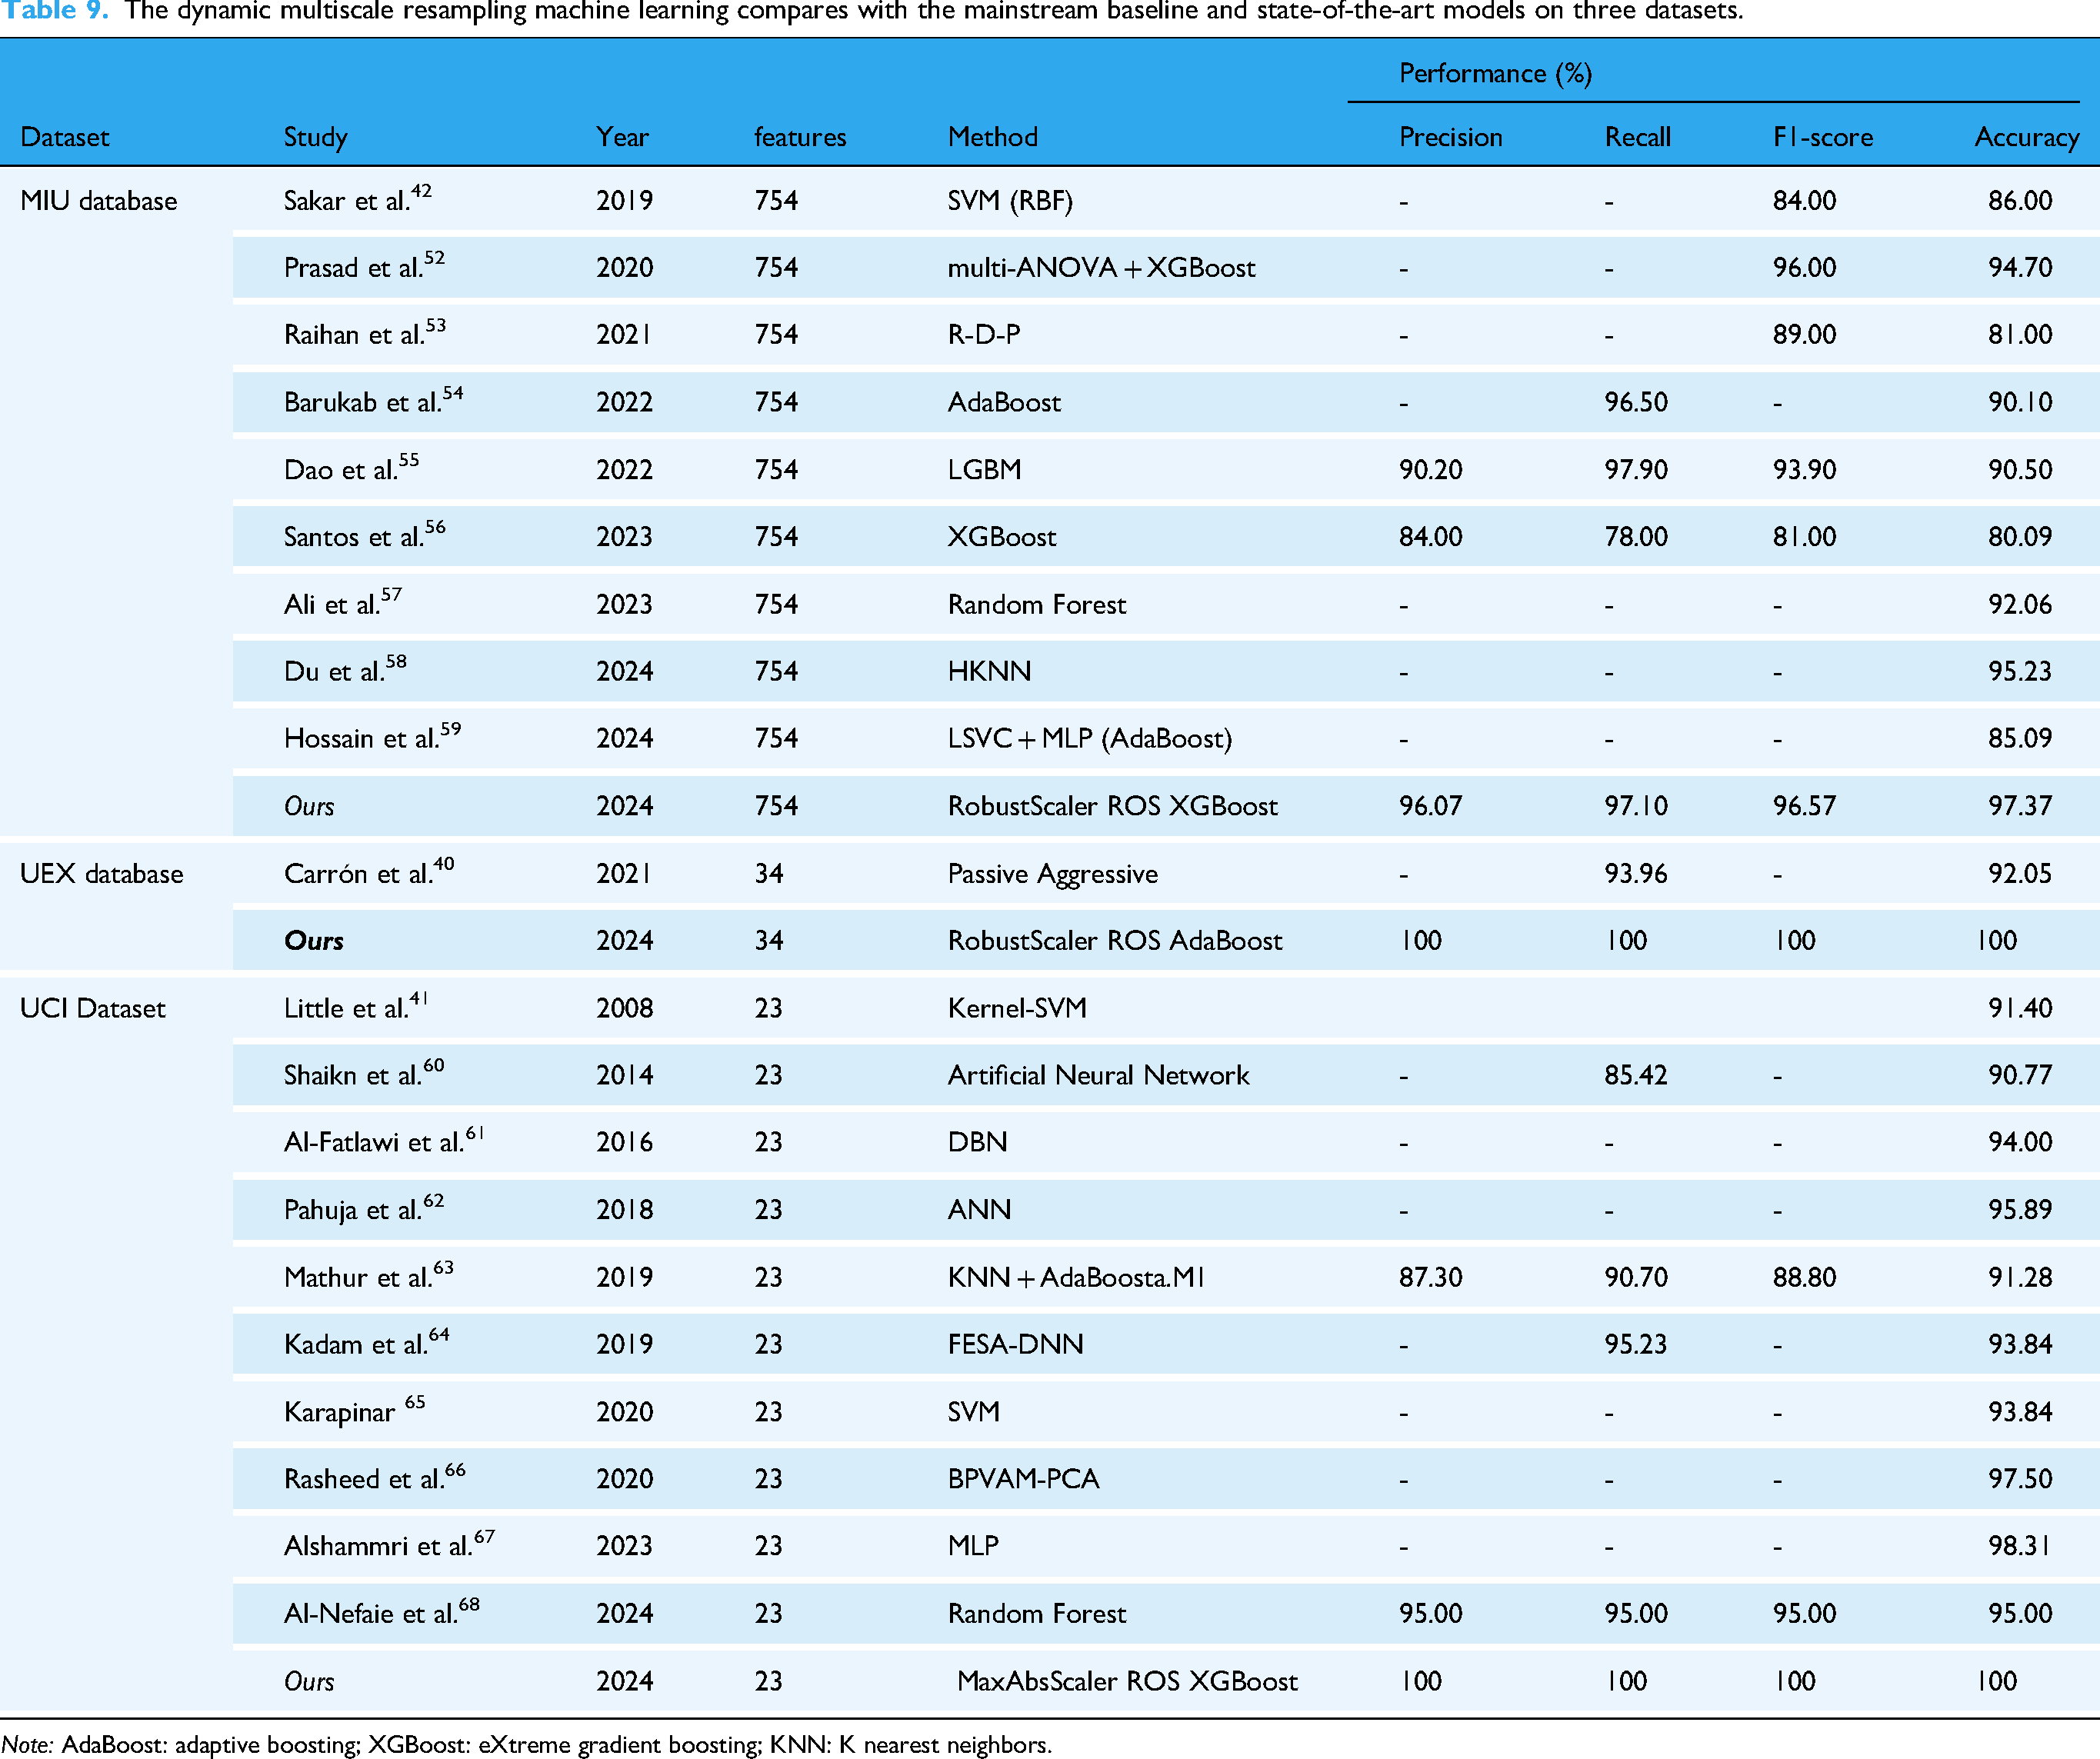
Note: AdaBoost: adaptive boosting; XGBoost: eXtreme gradient boosting; KNN: K nearest neighbors.
The MIU dataset (Sakar et al.) presents a 754-feature space for neurodegenerative disease monitoring. Our RobustScaler-ROS-XGBoost pipeline achieved 97.37% accuracy (96.57% F1-score), outperforming: SVM-RBF implementations (86.00% accuracy),
42
hybrid ANOVA-XGBoost models (94.70% accuracy),
52
recent LightGBM adaptations (90.50% accuracy).
55
Notably, Santos et al.'s XGBoost variant achieved only 80.09% accuracy,
56
while Ali et al.'s Random Forest reached 92.06%
57
—both constrained by inadequate imbalance mitigation. The 5.3% accuracy improvement over Prasad et al.'s
52
prior XGBoost implementation highlights our dynamic resampling's efficacy in preserving minority class patterns.
For UEX's 35-feature dataset (Carrón et al.), our AdaBoost-based model achieved 100% precision-recall-accuracy, a 7.95% accuracy gain over Carrón's Passive Aggressive classifier. The results suggest ROS effectively amplifies subtle biomarker signatures in small-sample contexts.
The proposed MaxAbsScaler-ROS-XGBoost configuration achieved perfect metrics (100%) on Little et al.'s 23-feature UCI dataset, surpassing: ANN architectures (90.77% accuracy), 60 Deep Belief Networks (94.00% accuracy), 61 State-of-the-art Random Forest (95.00% accuracy). 68 Despite Alshammri et al.'s MLP reaching 98.31% accuracy, 67 the absence of precision/recall data prevents full clinical validation—a gap addressed by our complete metric reporting. The 4.69% accuracy improvement over Rasheed et al.'s BPVAM-PCA demonstrates how scale-aware preprocessing enhances conventional dimensionality reduction. 66
Differential acoustic features on machine learning outcomes
As shown in Figures 8–10, positive parallels could barely be drawn on the impact of the same parameters for each dataset. However, MFCC subtypes in MIU and UEX dataset—albeit marginally—are in the top 10 of 20 in terms of impact magnitude on model output. MFCC captures the vocal tract's characteristics, and since PD affects the surrounding muscles—leading to imprecise articulation, hypophonia, and monotony—MFCC is likely able to pick up on this. This aligns with prior research emphasizing MFCCs as robust indicators for distinguishing PD from healthy controls due to their ability to capture spectral energy distribution changes associated with vocal impairments in PD. 69 While “Jitter”—a measure of pitch irregularity—is ranked on the list, it is near the bottom in both the UCI and UEX datasets. This finding is consistent with studies suggesting that while Jitter is a valuable feature in PD detection, 70 it's diagnostic utility may be limited due to its considerable variability across individuals 71 and natural pitch fluctuations in healthy controls. Notably, PPE is ranked first in the UCI dataset but near bottom in the UEX dataset, which shows that the same parameter may not have same impact across datasets; potentially due to differences in data collection protocols, population demographics, or disease severity among datasets.70,71 Interestingly, within the top 20 features of Figures 2–4, there is still a distinct gap between the relevant and less relevant features; which suggests there is an even greater disparity compared to features not ranked on the list. This further substantiates the notion that certain acoustic features are central in the diagnosis of PD in certain datasets, and some are not.
Our findings highlight two critical points: first, that acoustic feature relevance is highly dataset-dependent; and second, that certain features—such as MFCCs—show promise as robust markers for PD diagnosis. However, it is too early to generalize these conclusions without further validation across larger and more diverse datasets. Future research should focus on standardizing data collection methods and exploring feature interactions to better understand their clinical relevance. By narrowing down potential acoustic biomarkers through this analysis, our study provides a foundation for future investigations aimed at optimizing feature selection for PD diagnosis. Researchers are encouraged to build upon these findings by validating key features across independent datasets and integrating them into multimodal diagnostic frameworks.
Research limitations
The generalizability of our findings is constrained by several demographic and methodological factors. First, the analyzed datasets (MIU, UEX, and UCI) exhibit limited geographic and linguistic diversity, predominantly comprising European/North American cohorts with sustained vowel /a/ recordings. This narrow scope may not fully capture PD-related vocal variations across different language groups or regional accents, particularly in tonal languages where pitch variations play distinct linguistic roles. Second, inherent gender differences in baseline vocal parameters—such as fundamental frequency ranges (female: 165–255 Hz vs male: 85–155 Hz) and harmonic structures—were not systematically stratified, potentially confounding feature interpretation. For instance, higher fundamental frequencies in females could amplify jitter measurements independent of PD pathology, introducing classification bias in mixed-gender cohorts.
Moreover, critical clinical covariates remain unaddressed due to dataset limitations. The UCI dataset's reported disease duration (0–28 years) lacks standardized Hoehn-Yahr staging, while medication status (e.g. levodopa on/off states) is absent across all datasets. This omission is particularly consequential given that dopaminergic medications are known to transiently improve vocal intensity and pitch variation, potentially masking disease-specific acoustic signatures.
Conclusion
The contribution of this study is the substantiation of utilizing an ensemble-based approach to build a robust PD diagnostic ML model; moreover, the study provides inside into future applications based on dataset characteristics such as: imbalance and the presence of outliers. We provide a concise solution to constructing a ML model from a previously unapproached PD acoustic recording database, which would otherwise demand gruesome hours of training time, countless configuration adjustments and extensive optimization efforts.
Our results are limited to our study of acoustic features of PD. Thus, we were not able to account for factors like stage of PD or if they were on medications in our study, which may affect outcomes, as once PD reaches a certain stage, some acoustic features could be more pronounced than others. In the future, studies could perhaps collect voice recordings based on age and or stage of PD with or without medication and construct a more comprehensive dataset of PD.
In addition, our study also provides an impact-based index of PD-related parameters which distills the multitude of parameters of each database into a list of key and relevant features that were salient in ML model performance. Although only MFCC was the consistent relevant feature among two of the three databases, our results still establish a foundational reference to guide future researchers in selecting parameters to prioritize in the collection and analysis of acoustic features.
Footnotes
Acknowledgments
We thank all individuals who participated in this study.
Author contributions
PNC, LCS, and CWT performed the experiments and wrote the manuscript. KFL and PNC provided the concept and experimental design of the study and reviewed the paper prior to submission. All authors discussed the results, analyzed the data, and commented on the manuscript. All authors have read and approved the submitted version.
Funding
The authors disclosed receipt of the following financial support for the research, authorship, and/or publication of this article: The design and costs of collection, analysis and interpretation of data, and writing are funded by the Ministry of National Defense-Medical Affairs Bureau (Grant No. MND-MAB-D-113143).
Declaration of conflicting interests
The authors declared no potential conflicts of interest with respect to the research, authorship, and/or publication of this article.