
Abstract
Objective
This study evaluates machine learning algorithms’ effectiveness in classifying Parkinson’s disease and Huntington’s disease based on biomarker data obtained non-invasively from patients and healthy controls.
Methods
Datasets containing biomarker data (x, y, and z values of accelerometers) from sensors were collected from Parkinson’s disease, Huntington’s disease patients, and healthy controls. An automatic selection model method was implemented for disease classification, using a unique Mexican database of human gait biomarkers, which we consider the only one of its kind. Random forest, random subspace method, and K-star algorithms were employed, with parameters optimized through an automated model selection.
Results
The study achieved a 0.893 precision rate for Parkinson’s disease and Huntington’s disease using the random subspace method. The findings underscore the potential of machine learning techniques in medical diagnosis, particularly in neurological disorders.
Conclusion
The automatic selection model method demonstrated efficacy in classifying Parkinson’s disease and Huntington’s disease based on non-invasive biomarker data. This research contributes to advancing non-invasive diagnostic approaches in neurological disorders, highlighting the significance of machine learning in healthcare.
Introduction
The nervous system comprises the central nervous system (CNS) and the peripheral nervous system. 1 These systems oversee numerous functions in the human body, and various conditions can disturb their homeostasis. Notably, neurodegenerative disorders, as discussed in previous research, are characterized by progressive deterioration that impacts fundamental abilities such as movement and cognition.2,3 Both Parkinson’s disease (PD) and Huntington’s disease (HD) are part of this group and greatly affect the patient’s quality of life. However, due to their similar early symptoms, distinguishing between them can be challenging. In addition, for their diagnosis techniques that are highly expensive and sometimes invasive for the patient are used, 4 so it is important to find alternatives for their classification.
PD is a neurological disorder marked by autonomic and motor disturbances. 5 It is estimated that 0.3% of the population in industrialized countries is affected by this condition, with men being twice as likely as women to develop the disease. Additionally, the risk of developing PD increases with age.6,7
This condition arises from the degeneration of dopaminergic neurons in brain areas such as the substantia nigra, resulting in decreased levels of this neurotransmitter in the striatum, 8 as well as possible degeneration of catecholaminergic and serotonergic neurons, causing altered movement patterns. 9
On the other hand, HD is also a neurological disorder of the CNS, whose clinical manifestations are chorea, involuntary movements such as bradykinesia, loss of postural reflexes, ataxia, and gait, with symptoms appearing between 15 and 20 years of age.11,10 It is known that 10–13 persons are prevalent per 100,000 in America, being more significant in women than men. The symptoms are more aggressive in women due to differences in the sequences of genes that code for the protein huntingtin, which causes the disease.12,13
Likewise, it is known that the disease is due to alterations in the gene sequence in chromosome 4, impacting brain structures like the striatum, and leading to atrophy of the cerebral cortex and cerebellum, which manifests as movement disorders. 14
Currently, there are studies that due to the similarity of the symptoms try to differentiate these diseases through biomarkers or the use of techniques such as machine learning (ML), using algorithms to databases provided by different types of studies. 15 Therefore, our contributions are (1) implementing a method based on an automatic selection model to identify (classify) neurodegenerative diseases such as PD and HD, and (2) utilizing the database with human gait biomarkers obtained from the National Institute of Neurology and Neurosurgery (NINN), which we believe is the only database on this topic. The article will first describe the previous works that support the research, continuing with the materials and methods used, that is, the sensor network, the dataset, the ML model, and the metrics, then the results, a detailed discussion of the results, and the conclusions with future work planned to enhance the study.
Previous works
Currently, there exists a diverse array of research that has enabled the classification of neurodegenerative conditions such as PD, HD, ataxia, amyotrophic lateral sclerosis, and spinal muscular atrophy employing various biological as well as motor markers;16,17 in this regard, those that use gait as a differentiator of PD and HD will be described.
Gait and ML as tools to differentiate neurodegenerative diseases: PD and HD
It is known that in PD, there are alterations in both movement and posture; balance, hip position, and gait, the latter has functioned as an indication of the progress of the disease, 18 through the measurement of kinematic and spatiotemporal parameters, by the use of 3D software, however, some bias may occur because they are observational studies.19,20 On the other hand, there are also studies where using sensors in lower extremities (soles of the feet), databases of patients with idiopathic hyposmia, PD, and healthy subjects have been obtained, resulting in high accuracy values of 97% through the random forest algorithm. 21 Likewise, using inertial measurement units in PD patients and healthy patients in the lower extremities and back capturing acceleration and rotational motion, high classification efficiency values have been achieved using support vector machine (SVM) algorithm. 3 And by using wireless inertial sensors that measure head, pitch, roll, and stride rotations and analysis with ML techniques such as SVM we can correctly classify subjects with PD and healthy subjects with values above 90%. 22 In addition, one of the most important in our opinion has been the use of smartphones (due to their low cost) and their sensors (gyroscope) to know the severity of PD through developed applications and disease severity score learning (DSSL) algorithms with efficiency values higher than 90%. 23
Regarding HD, it is also known that one of the main characteristics is gait impairment, serving as an element for its classification.25,24,26 In this way, there are studies where it has been possible to differentiate the disease and its progression using algorithms. 27 For instance, a 2016 study utilized inertial sensors to assess elderly individuals post-stroke and HD patients, achieving SVM algorithm classification accuracy of 90.5%, relative to healthy subjects. 28 Similarly, using the Unified Huntington’s Disease Rating Scale, using biometric sensors on the trunk and extremities (triaxial accelerometer and gyroscope) or foot pressure sensors, the linear discriminant analysis (LDA) and VGG16 algorithms have been reported as the most optimal for measuring disease severity, obtaining percentages of 96% and 89%, respectively, comparing healthy subjects and those with HD.29,30
Analysis and opportunity gap
All these studies have been very important and relevant since ML is really strengthening the patient’s diagnosis in contribution to the medical staff. Gait is a fundamental parameter in the evaluation of neurodegenerative diseases,32,31,33,28,24 as it provides important information about the patient’s motor function and overall neurological health. Sensors that monitor gait through inertial signals, such as those obtained from accelerometers and gyroscopes, can be of great help in the accurate evaluation and early detection of such conditions.31,3,28,21,25 At present, there are very few studies that employ these techniques using gait as a differentiator and fewer in Latin American countries. Therefore, the present work represents great advances in medicine in Mexico. Table 1 shows some examples of analyses using ML in some neurodegenerative diseases and the countries in which the study has been carried out.
Neurodegenerative diseases where ML has been used.

Neurodegenerative diseases where ML has been used.
ML: machine learning; SVM: support vector machine; DSSL: disease severity score learning; LDA: linear discriminant analysis; RBF: radial basis function.
Materials and methods
The development of the project went from obtaining the dataset by NINN using body sensors, and processing the data in Weka software (as well as searching for algorithms), to algorithm selection and acquisition of selection values (see Figure 1).
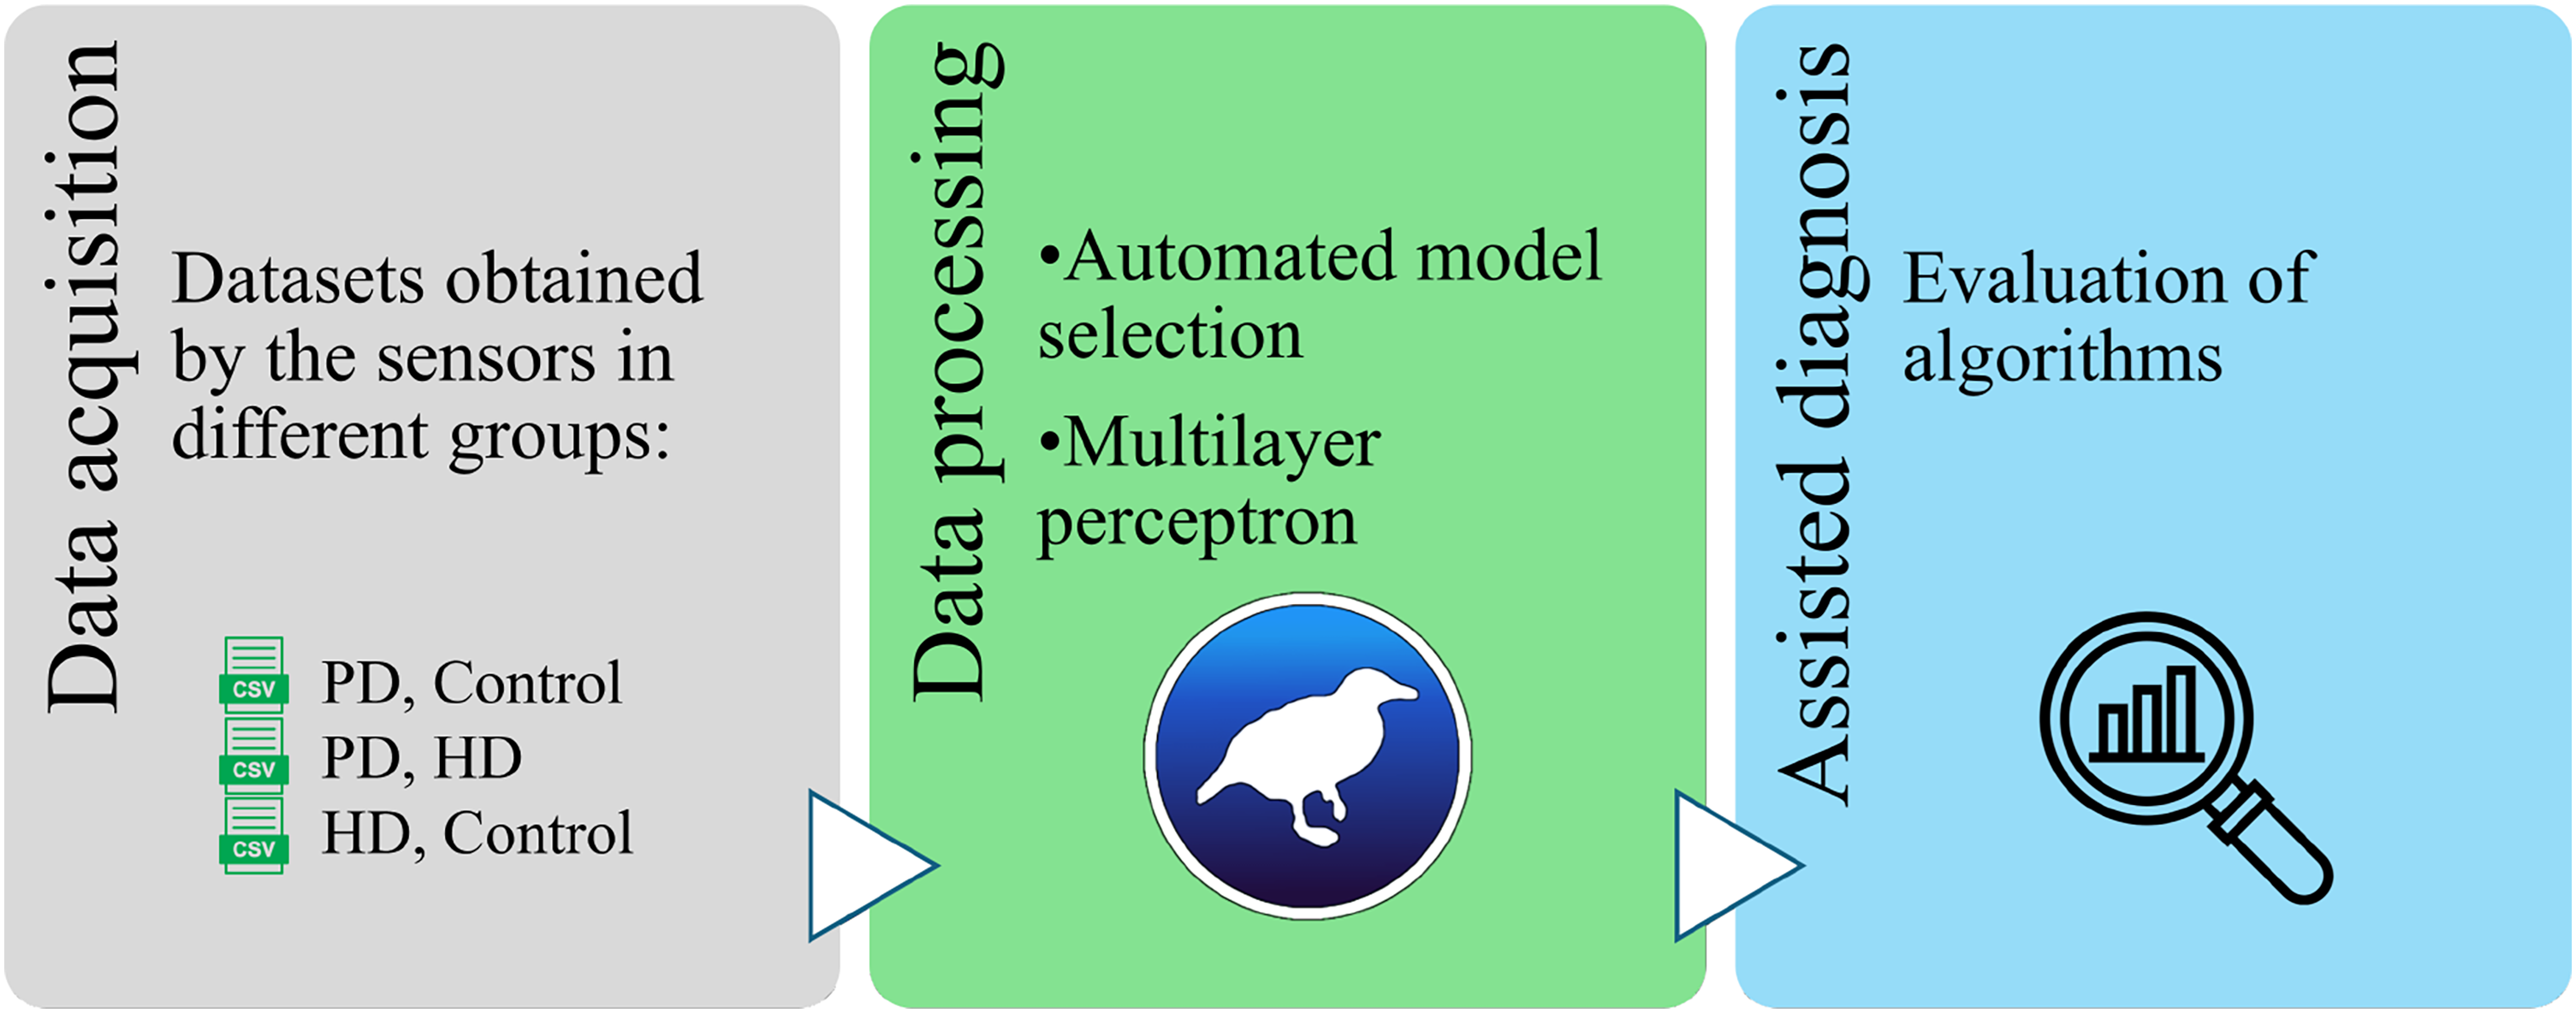
Pipeline of PD and HD categorization by using machine learning. PD: Parkinson’s disease; HD: Huntington’s disease.
Body sensor network
The network of three-axis ADXL-335 accelerometer sensors used to obtain the measurements and connected to an Arduino MEGA-2560 were placed on the extremities of both knees, ankles, and thorax, analyzing the Cartesian x, y, and z axes. From this network of sensors in Figure 2, which are accessible to be acquired by the patient, the dataset was obtained from Fuentes-Ramos et al. 16
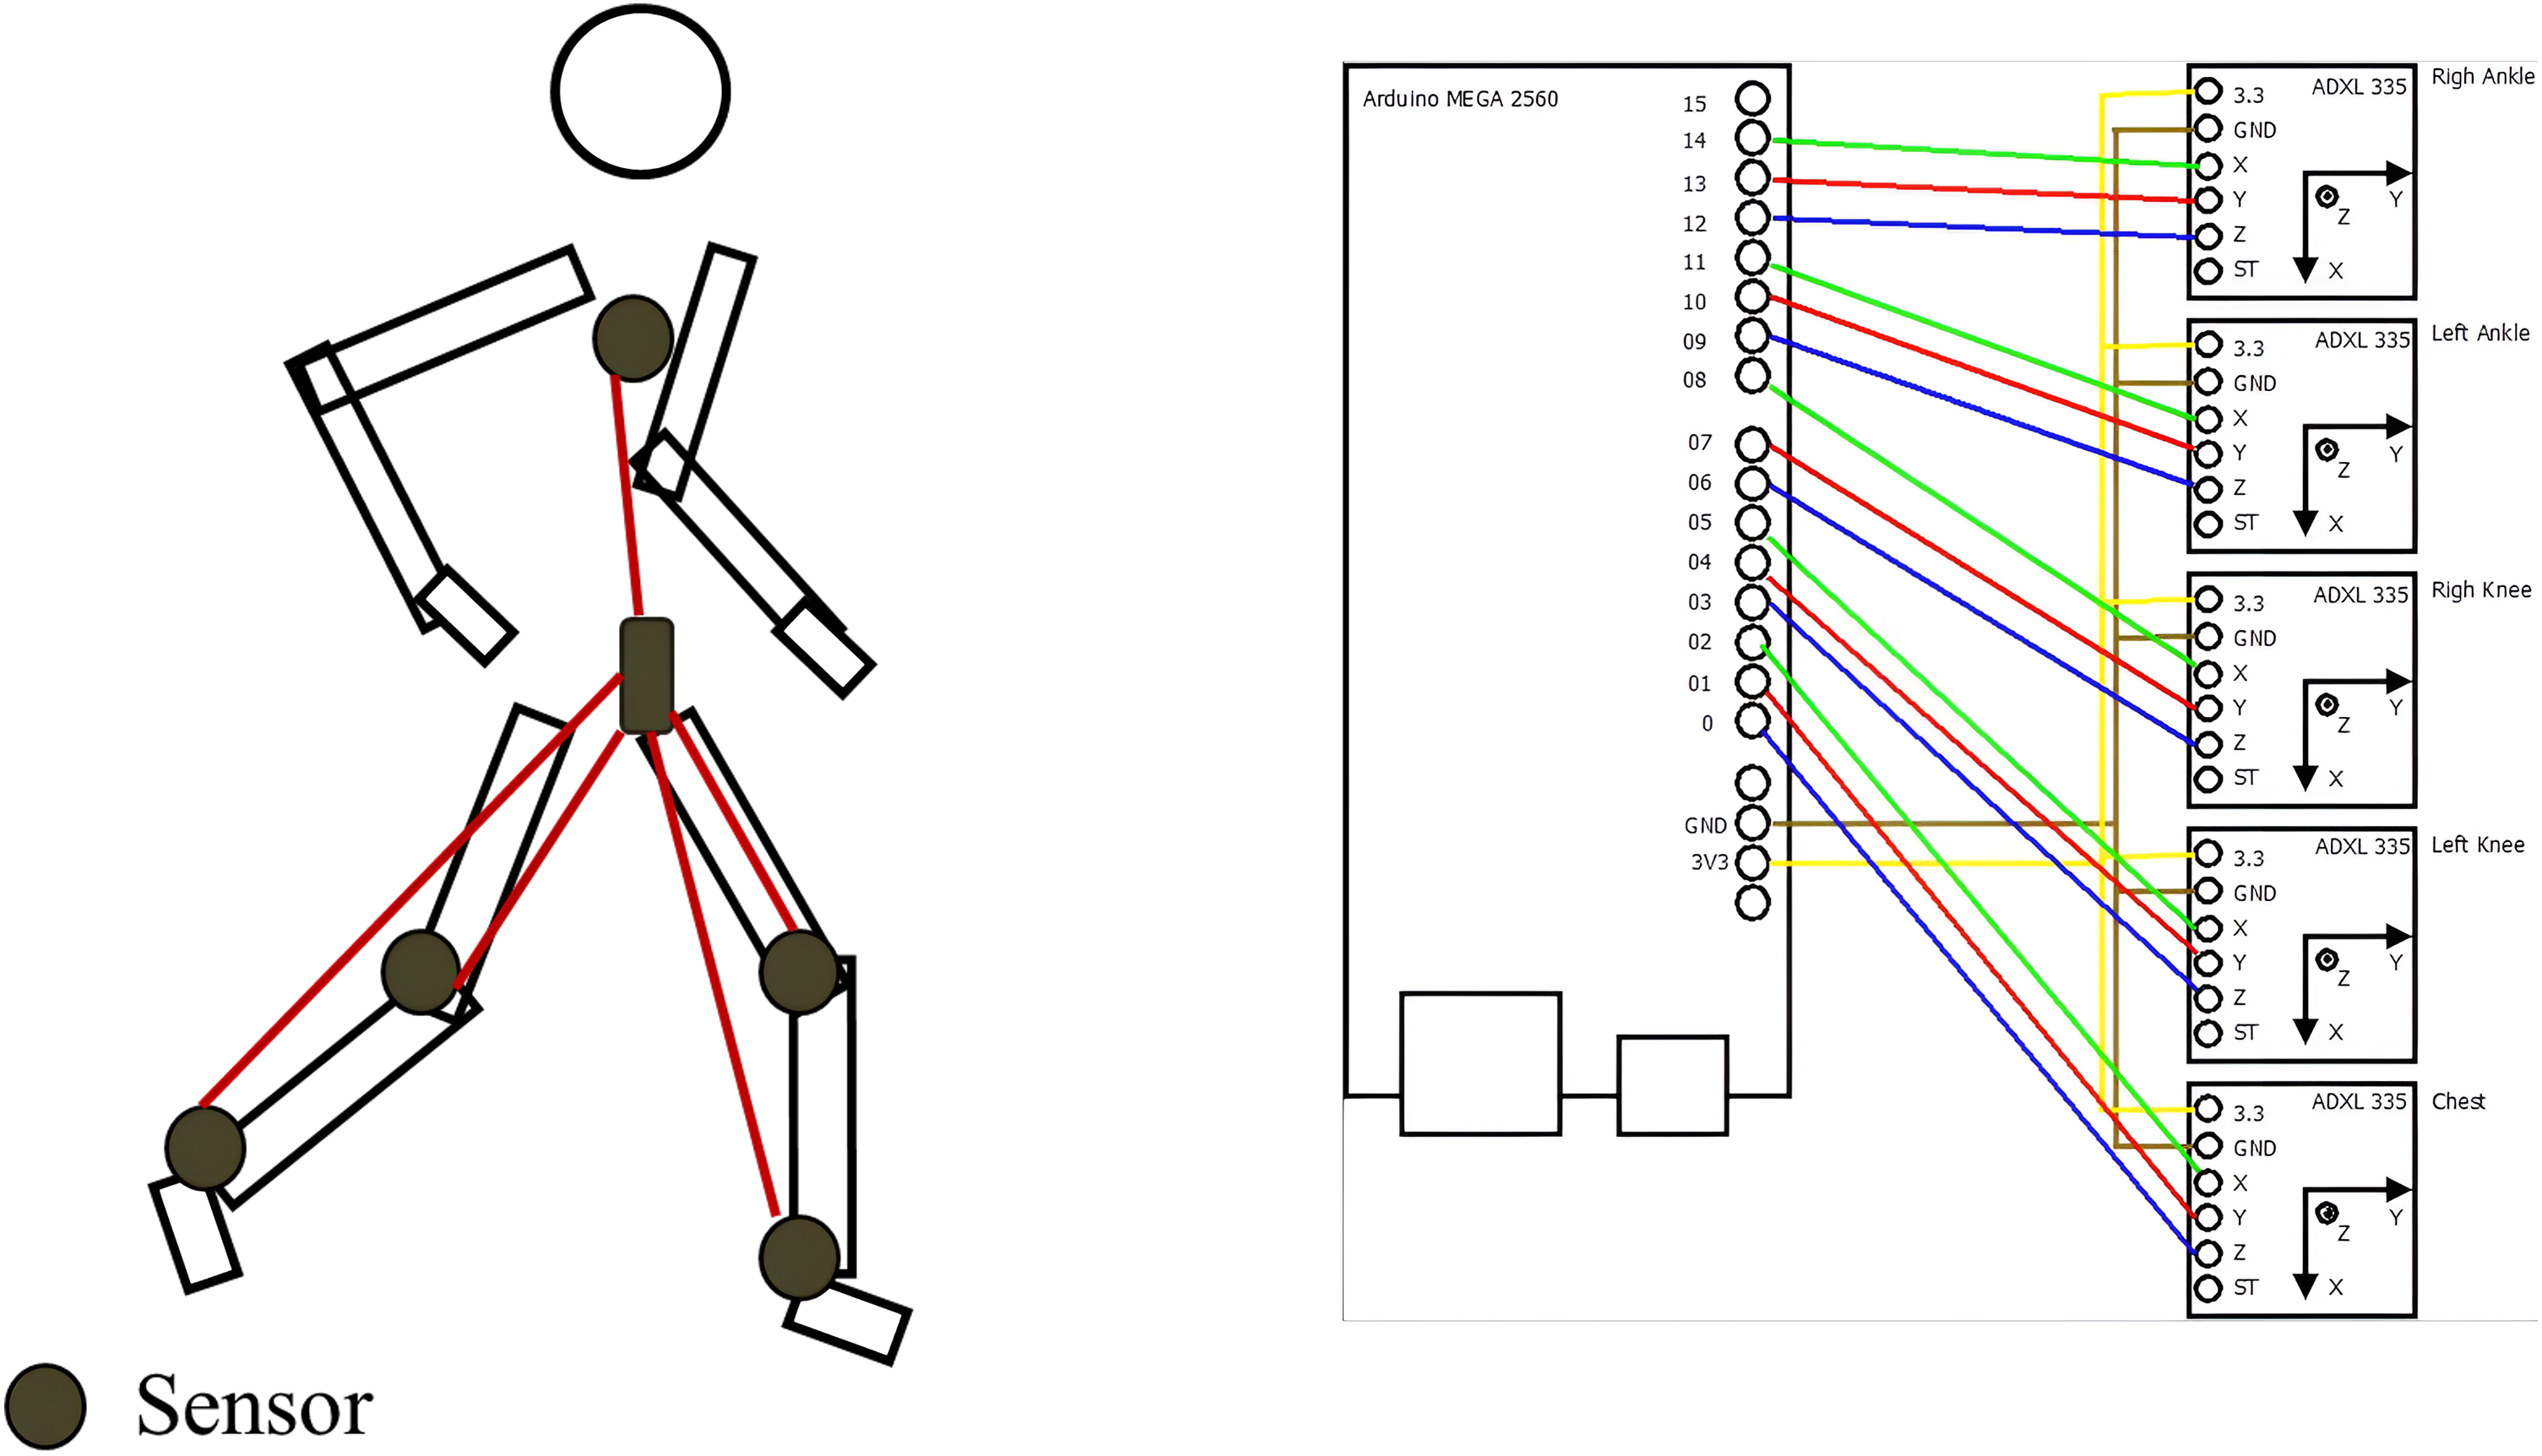
Examples of the sensors used to obtain the dataset. 16
Dataset
Data for the study were collected and ethically approved by the NINN Ethics Committee.40,16 Gait biomarkers were employed in the evaluation of patients with PD and HD, along with a control group comprising healthy subjects.
In addition, patients and family members signed informed consent forms to ensure that the data were published and that they did not reveal the identity of the participants.
The total number of patients was 78, which were divided into 47 with PD, 13 with HD, and 19 healthy subjects, 34 women and 45 men (see Table 2).
Sex and age distribution of patients under study.
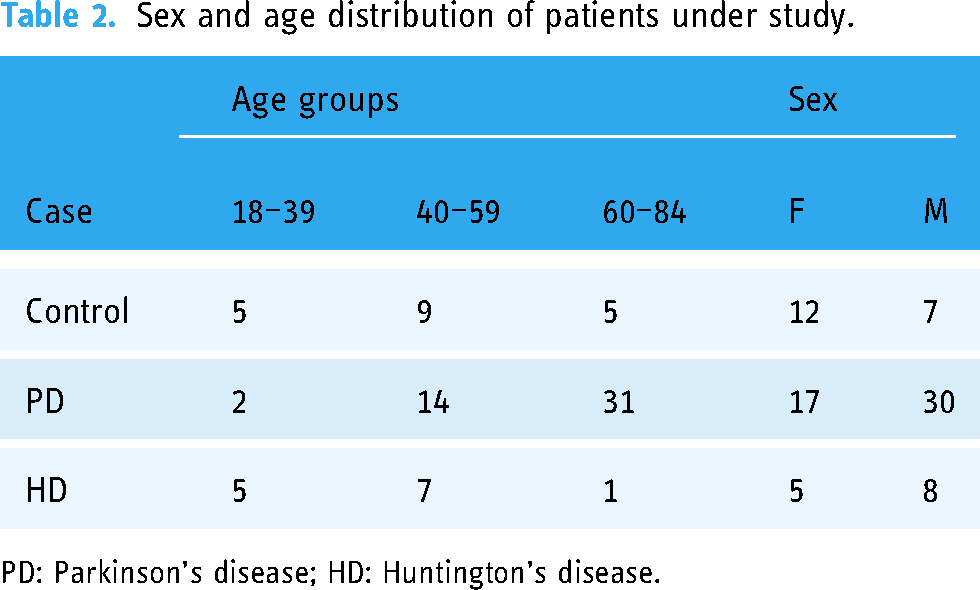
PD: Parkinson’s disease; HD: Huntington’s disease.
During the gait analysis process, data were provided in ∼ 2 minutes.
The exclusion criteria were people who had difficulty walking by themselves or who were in wheelchairs.
The datasets comprising raw data without any preprocessing, were grouped in a single file for each participant and the information was united in a single document, both for those with the disease and those who were healthy. This resulted in three datasets, which were used to carry out the classification, resulting in a binary category, Each of these datasets contains 1800 records per class, accumulating a total of 3600 records:
Binary sets: {PD, Control}, {PD, HD} and {HD, Control}
Finally, a subject-wise strategy was employed to split the data, allocating 80% for training and the remaining 20% for testing.
Automatic selection model
Thornton et al.’s ML model selection method was employed to automatically choose the classification algorithm,42,41 which involves:
Given a collection of algorithms 
Based on the above equation and the experimental tests performed in Waikato Environment Knowledge Analysis v.3.8, 43 it was found that the random forest algorithms for the set {PD, Control} were the most appropriate algorithms for classification. It is important to point out that the analysis was performed using an exhaustive algorithm-by-algorithm search provided by the software. The mathematical basis of the selected algorithms will be shown below.
Algorithms
Random forest
This algorithm, as a key component of the methods employed, utilizes an ensemble of classifiers denoted as
Initialization RF
Create a bootstrap sample T′ from dataset T
Grow a decision tree Tree using T′ and parameter k
Add Tree to RF
This technique includes the inputs which are the data (T) containing previous information (x) with its result (y), the number of decision trees (m), as well as the highest value that each tree will have (k). Once the values are obtained, new training data (
K-star
The definition of 


Random subspace method
This method constructs a decision forest ensemble,
46
using S training samples represented by
Initialize E to empty set
for i = 1 to B
Multilayer perceptron
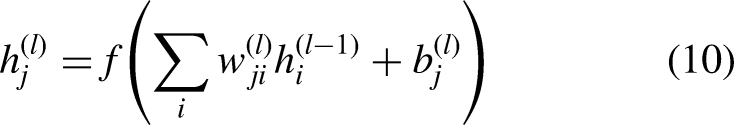
This type of artificial neural network consists of an input layer, one or more hidden layers, and an output layer.
48
Each layer contains multiple neurons, and every neuron in one layer is connected to all neurons in the next layer. This architecture enables the multilayer perceptron to model complex, non-linear relationships in data. The input features are represented in

Metrics
To assess performance, the confusion matrix (see Table 3), Kappa (equation (12)), precision (equation (13)), sensitivity or recall (equation (14)), f-measure (equation (15)), and area under the receiver operating characteristic curve were used as evaluation metrics. In a confusion matrix, the counts of predicted classes are displayed in columns, while actual values are shown in rows. This matrix helps identify true negative (TN), true positive (TP), false negative (FN), and false positive (FP). The confusion matrix provides the TP rate of correctly classified instances. The fraction of instances classified in the positive class is obtained by precision. The F value integrates the characteristics of the PT rate, and the precision becomes a single factor. While the receiver operating characteristic curve illustrates the TP rate and the FP rate.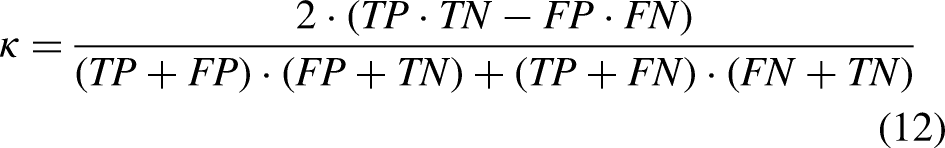


Confusion matrix.
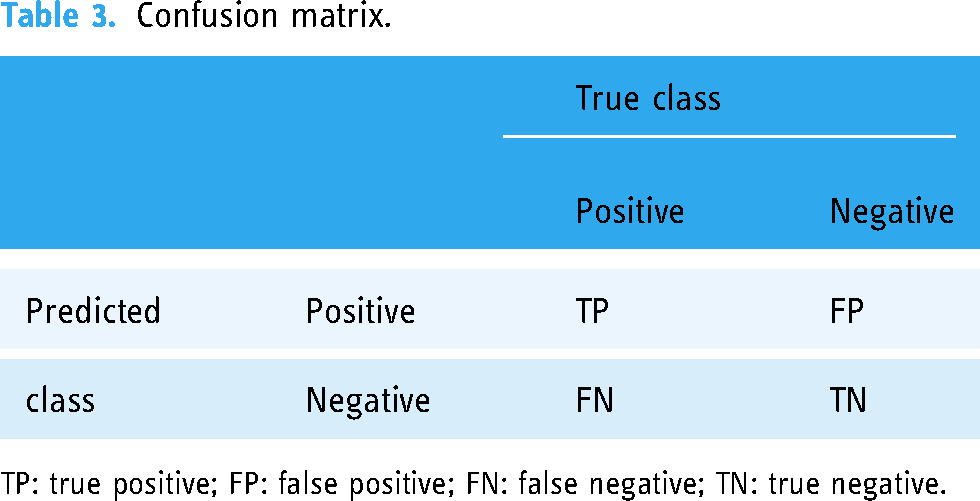
TP: true positive; FP: false positive; FN: false negative; TN: true negative.
Experiments
The experimental setup involved the evaluation of two main cases for the classification of biomedical data into binary sets: the first using the automatic selection model and the second employing the multilayer perceptron. The classifications performed were:
PD versus control: In the first case, the random forest algorithm was selected using the automatic selection model, while in the second case, the multilayer perceptron was employed. PD versus HD: The random subspace method was automatically selected in the first case, and the multilayer perceptron was used in the second. HD versus control: For this comparison, the K-star algorithm was automatically selected in the first case, and the multilayer perceptron was used in the second.
The performance metrics include the percentage of correctly classified instances, the Kappa statistic, weighted average precision, weighted average recall, and weighted average F-measure. Additionally, the confusion matrix for each classification task is provided.
The experiments were performed in Waikato Environment Knowledge Analysis v.3.8, 43 on an HP laptop with Windows 11 64-bit, Intel (R) Core(TM) i7-1065G7 processor @ 1.30 GHz, and 12.00 GB RAM.
Results
The classification results are presented in Table 4. In the first case, the automatic selection model identified the following three algorithms for the classification of the binary sets:
Classification results of binary sets.
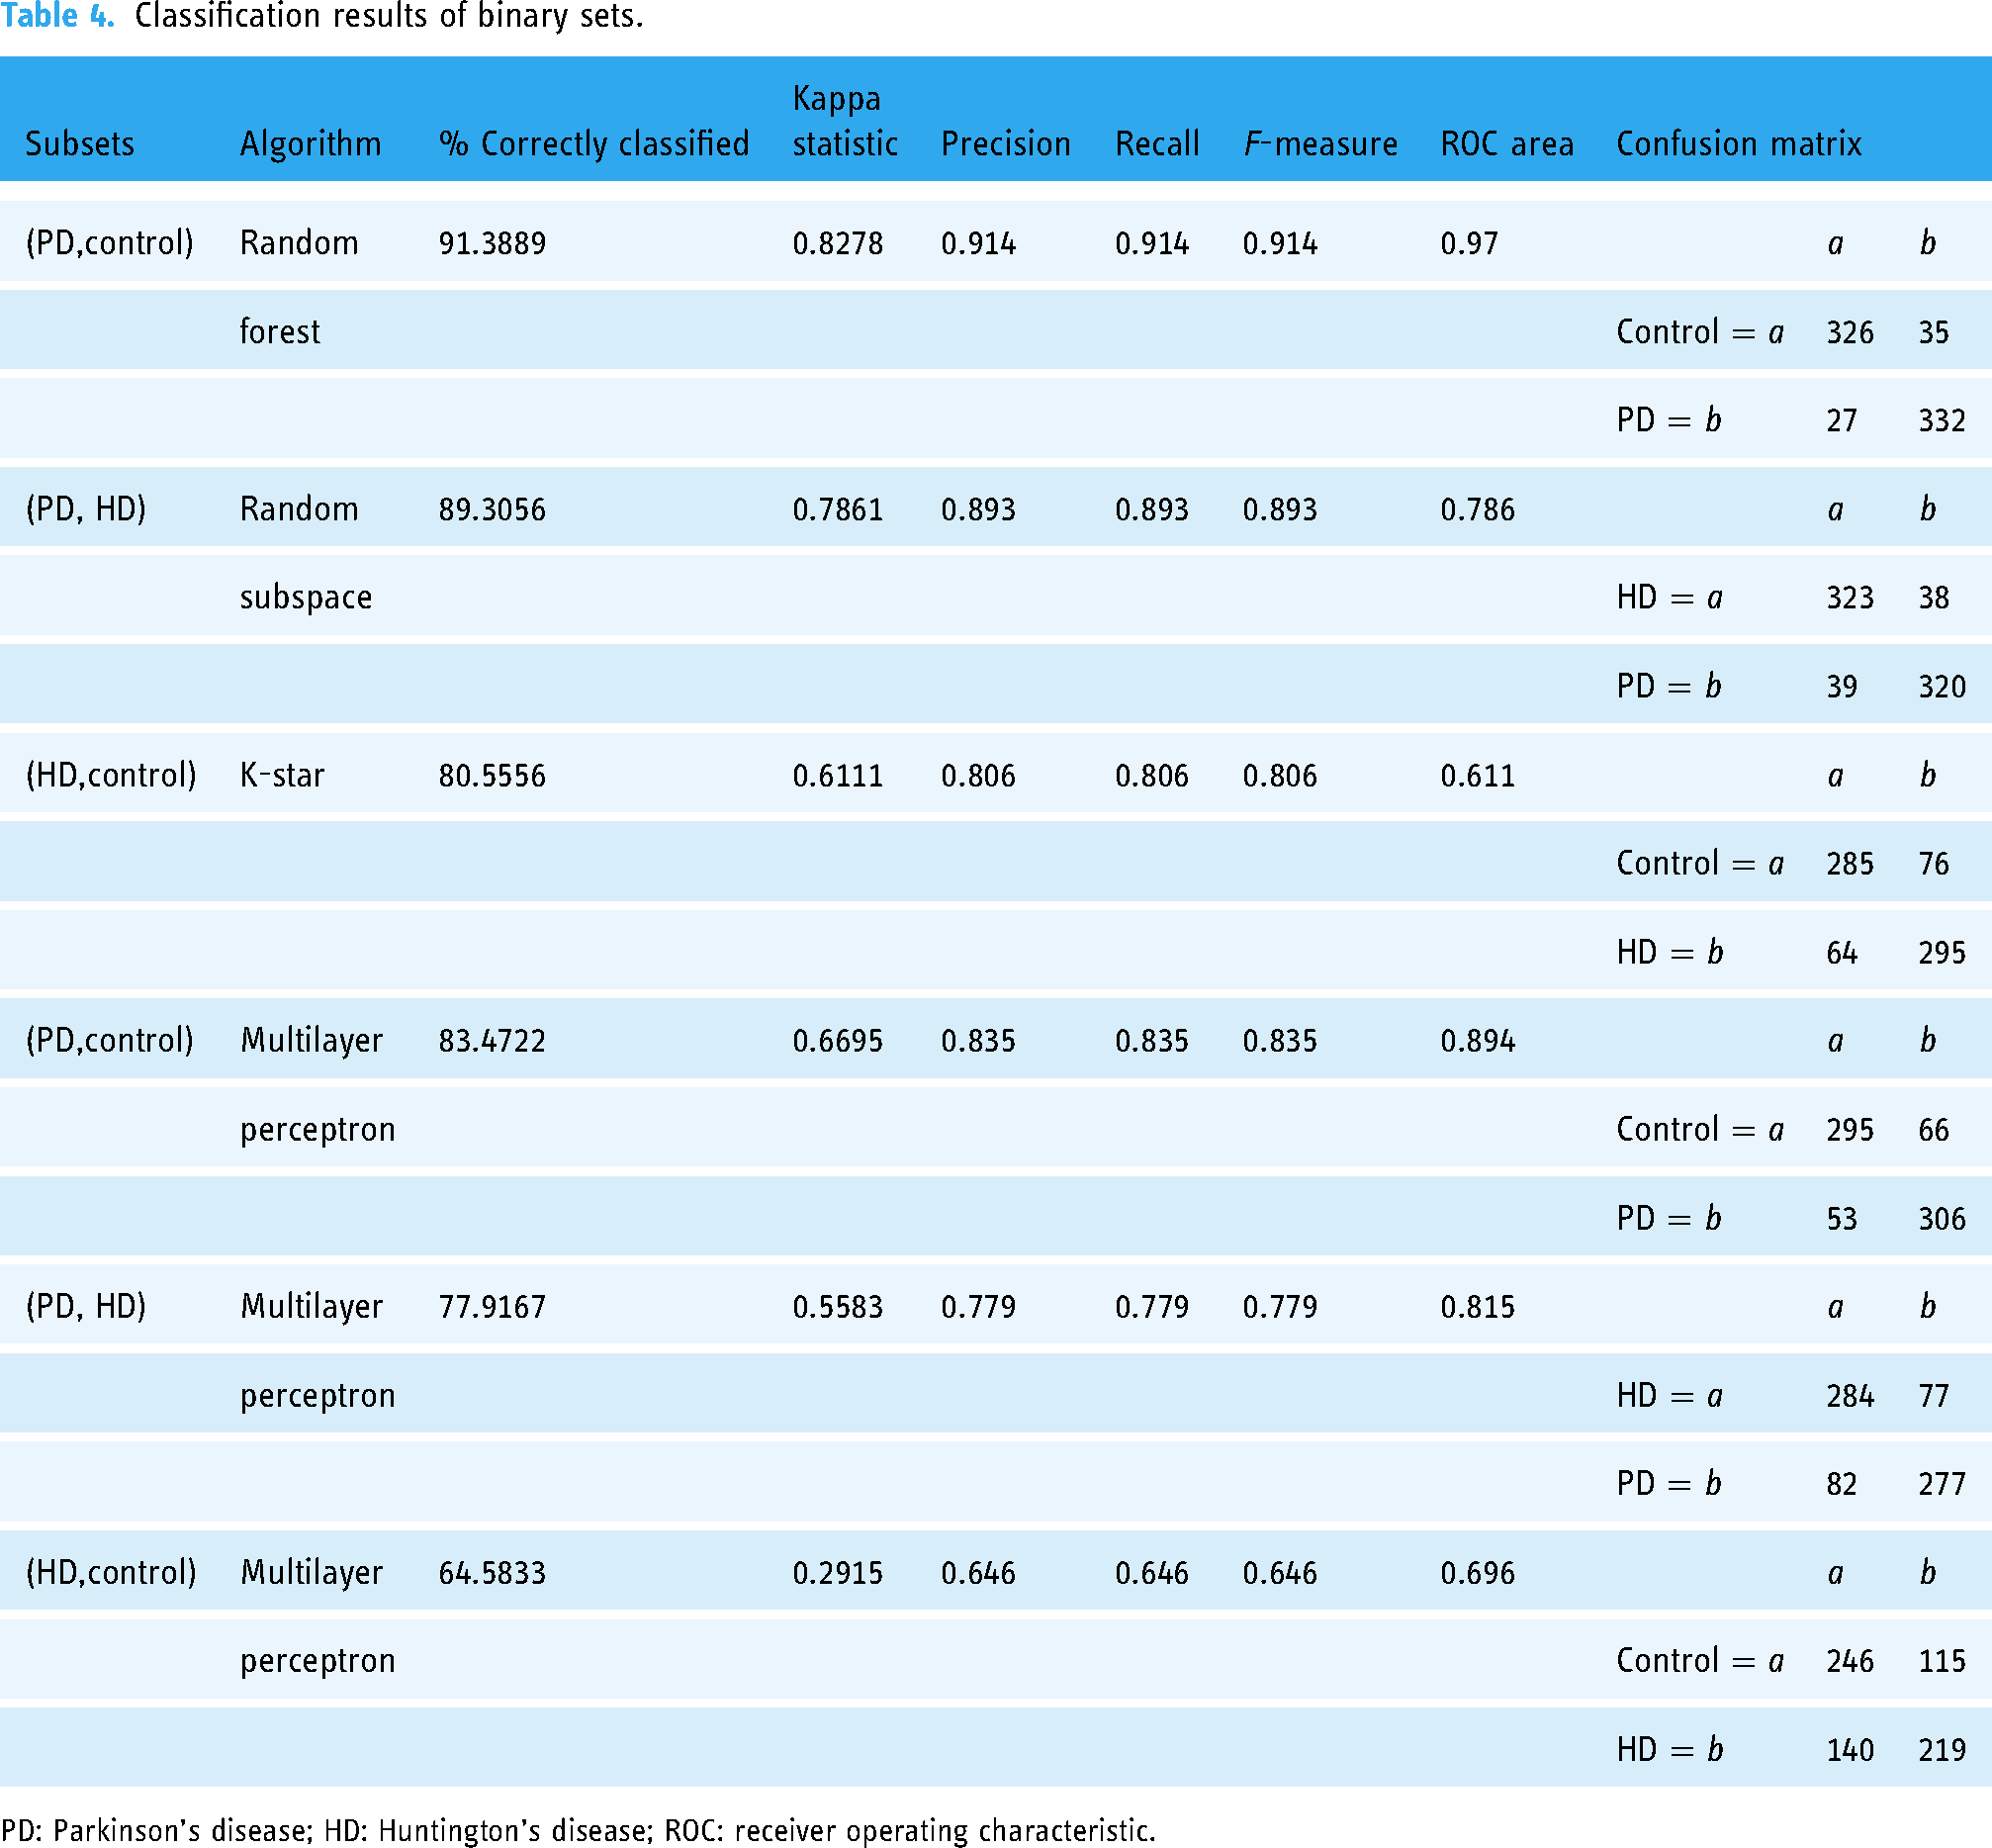
PD: Parkinson’s disease; HD: Huntington’s disease; ROC: receiver operating characteristic.
PD versus control: The random forest algorithm correctly identified 91.3889% of the cases with a Kappa statistic of 0.8278, and precision, recall, and F-measure all at 0.914. The confusion matrix indicates that 326 control instances and 332 PD instances were correctly classified. PD versus HD: Using the random subspace method, 89.3056% of the cases were correctly identified with a Kappa statistic of 0.7861. Precision, recall, and F-measure were all 0.893. The confusion matrix shows that 323 HD instances and 320 PD instances were correctly classified. HD versus control: The K-star algorithm correctly identified 80.5556% of the cases with a Kappa statistic of 0.6111. Precision, recall, and F-measure were all 0.806. The confusion matrix highlights that 285 control instances and 295 HD instances were correctly classified.
In the second case, a multilayer perceptron was used for the classification of the binary datasets, yielding the following results:
PD versus control: The multilayer perceptron correctly identified 83.47% of the data with a Kappa statistic of 0.6695. Precision, recall, and F-measure were all 0.835. The confusion matrix shows that 295 instances of control and 306 instances of PD were classified correctly. PD versus HD: Using the multilayer perceptron, 77.92% of the data was correctly identified with a Kappa statistic of 0.5583. Precision, recall, and F-measure were all 0.779. The confusion matrix shows 284 instances of HD and 277 instances of PD classified correctly. HD versus control: The multilayer perceptron correctly identified 64.58% of the data with a Kappa statistic of 0.2915. Precision, recall, and F-measure were all 0.646. The confusion matrix highlights 246 instances of control and 219 instances of HD classified correctly.
Figures 3 to 5 display the precision–recall graphs, demonstrating values around 85%.

Precision and recall graph of Parkinson’s disease (PD) versus control using random forest.

Precision and recall graph of PD versus HD using random subspace. PD: Parkinson’s disease; HD: Huntington’s disease.

Precision and recall graph for Huntington’s disease (HD) versus control using K-star.
Discussion
In the present study, we found some interesting findings. For example, it is the first study that presents a comparison on automatic selection model and multilayer perceptron on a dataset of patients in Mexico (NINN), so it represents a valuable tool for physicians in this country because it has been documented, for example, that the genetic etiology and prevalence of both (PD and HD) and therefore the characteristics of involuntary movements are different in different sites in Latin America and the world, so using this technique is vital at present.53,51,52
Likewise, the sensor network used in the study subjects is unique, since it has been designed in such a way that the data obtained in the different X, Y, and Z axes of the different limbs provide greater information for the dataset. 16
The results of the experiments show significant differences in the performance of the algorithms used in this study, highlighting the importance of proper algorithm selection for different biomedical data classification tasks.
In the first case, the automatic selection model identified three algorithms: random forest, random subspace, and K-star. These algorithms exhibited high performance in terms of precision and Kappa statistic. Specifically, random forest achieved the highest precision (0.914) and the highest Kappa value (0.8278) in classifying PD versus control, indicating excellent ability of the model to distinguish between these two classes.
The random subspace method also yielded good results in classifying between PD and HD, with a precision of 0.893 and a Kappa statistic of 0.7861. Although this algorithm showed slightly lower performance compared to Random forest, it still achieved accurate classification.
The K-star algorithm, while performing acceptably with a precision of 0.806 and a Kappa statistic of 0.6111 in classifying between HD and control, was the least effective among the three selected by the automatic selection model.
In the second case, the multilayer perceptron was used for all classification tasks. Although its performance was inferior compared to the algorithms selected automatically, the multilayer perceptron still showed reasonable results. The highest precision was achieved in the classification between PD and Control (0.835) with a Kappa statistic of 0.6695. However, the confusion matrix reveals a higher number of misclassifications compared to random forest.
For the classification between PD and HD, the multilayer perceptron achieved a precision of 0.779 and a Kappa statistic of 0.5583. These results are lower compared to those obtained with the random subspace method, suggesting that the multilayer perceptron may not be the most suitable model for this specific task.
Finally, in the classification between HD and Control, the multilayer perceptron showed the lowest performance with a precision of 0.646 and a Kappa statistic of 0.2915. The confusion matrix indicates more difficulties in distinguishing between these two classes, with a significant number of misclassifications.
The results suggest that automatically selected classification algorithms tend to outperform the multilayer perceptron in terms of precision and capacity to discriminate between classes. This underscores the importance of using automated model selection to identify the most suitable algorithms for specific classification tasks in complex datasets such as biomedical data. Additionally, it is noteworthy that for both approaches analyzed, the best performance was achieved in the classification between PD and control, indicating a greater ability to distinguish between these two groups. In contrast, the classification between HD and control showed the poorest performance, highlighting potential additional challenges in differentiating these specific groups. This pattern suggests that the evaluated algorithms could be more effective in detecting subtle differences in closer groups in terms of clinical and pathological characteristics.
It is important to highlight that the analysis conducted in the Weka software involved a comprehensive search of algorithms, evaluating the dataset one by one from the package of options offered by the program. This approach differs from other studies where only specific algorithms or Autoweka (an algorithm with parameter optimization) are used, which may provide a more thorough exploration of possibilities.
Conclusions and perspectives
In conclusion, this study highlights the effectiveness of automated model selection in identifying high-performance algorithms with percentages close to 90% in the classification identification of PD and HD based on gait biomarkers. However, limitations of the multilayer perceptron are evident in certain classification scenarios. These findings underscore the importance of customizing classification models to optimize performance in specific biomedical applications.
Furthermore, the variability in performance among different algorithms suggests that there is no single optimal model for all classification tasks.
Something very important is that the database used is from patients in different stages of the disease, so future works are expected to be carried out with data in the early stages of the disease. Therefore, the following studies are expected to be carried out:
Developing and evaluating combinations of algorithms and advanced automatic selection techniques to further improve the accuracy and robustness of classification systems. Employ other types of devices, for example, smart bands, which have become very accessible to the patient and thus costs remain low. To use the algorithms found with a greater percentage of efficacy in other neurodegenerative pathologies that also affect gait, such as ataxias or amyotrophic lateral sclerosis, in both binary and multifactorial studies. To carry out ML studies in datasets of other chronic degenerative diseases, such as diabetes, obesity, hypertension, arthritis, asthma, etc., using clinical laboratory tests.
Footnotes
Acknowledgements
We would like to thank Dr Marie-Catherine Boll-Woehrlen, a specialist in movement disorders, for her advice and support with the tests carried out on the volunteers in the gait laboratory of the National Institute of Neurology and Neurosurgery from Mexico. The authors express their sincere gratitude to all the patients who participated in this study for their invaluable contribution and cooperation.
Contributorship
Eddy Sánchez-DelaCruz: project administration, supervision, methodology, formal analysis, and writing–original draft preparation. Cecilia-Irene Loeza-Mejía: conceptualization of this study, data curation, methodology, and writing–original draft preparation. César Primero-Huerta: investigation, methodology, and writing–original draft preparation. Mirta Fuentes-Ramos: conceptualization of this study, investigation, methodology, and writing–original draft preparation.
Declaration of conflicting interests
The author(s) declared no potential conflicts of interest with respect to the research, authorship, and/or publication of this article.
Ethical approval
Ethical approval for this study was obtained from the National Institute of Neurology and Neurosurgery in Mexico, CONAHCyT project number FOMIX-TAB:2014-C29-245876. Also, a signed informed consent form was obtained from each patient and their family member prior to study initiation.
Funding
The author(s) disclosed receipt of the following financial support for the research, authorship, and/or publication of this article: The authors would like to thank CONAHCyT, Mexico, for the fund 2021-000018-02NACF-12228, for graduate studies assigned to Loeza-Mejía.
Guarantor
National Institute of Neurology and Neurosurgery from Mexico.