
Abstract
Objective
Neurodegenerative diseases affect millions of families around the world, while various wearable sensors and corresponding data analysis can be of great support for clinical diagnosis and health assessment. This systematic review aims to provide a comprehensive overview of the existing research that uses wearable sensors and features for the diagnosis of neurodegenerative diseases.
Methods
A systematic review was conducted of studies published between 2015 and 2022 in major scientific databases such as Web of Science, Google Scholar, PubMed, and Scopes. The obtained studies were analyzed and organized into the process of diagnosis: wearable sensors, feature extraction, and feature selection.
Results
The search led to 171 eligible studies included in this overview. Wearable sensors such as force sensors, inertial sensors, electromyography, electroencephalography, acoustic sensors, optical fiber sensors, and global positioning systems were employed to monitor and diagnose neurodegenerative diseases. Various features including physical features, statistical features, nonlinear features, and features from the network can be extracted from these wearable sensors, and the alteration of features toward neurodegenerative diseases was illustrated. Moreover, different kinds of feature selection methods such as filter, wrapper, and embedded methods help to find the distinctive indicator of the diseases and benefit to a better diagnosis performance.
Conclusions
This systematic review enables a comprehensive understanding of wearable sensors and features for the diagnosis of neurodegenerative diseases.
Keywords
Introduction
The number of patients affected with neurodegenerative diseases (NDDs) increased rapidly in the last few decades, which brings an adverse impact on society and the economy. 1 In general, NDDs include Alzheimer’s disease (AD), Parkinson's disease (PD), multiple sclerosis (MS), amyotrophic lateral sclerosis (ALS), and Huntington's disease (HD). NDDs tend to be progressive, and there is no cure for most of them. Accurate diagnosis of NDDs as early as possible can help patients to obtain preventive measures even before the occurrence of irreversible brain damage.
Each NDD is heterogeneous in clinical representations, though there are often overlaps. 2 Symptoms of NDDs on motor behavior are as follows 3 : AD has hypokinesia, apraxia, and abnormalities in walking and trunk movements 4 ; PD displays the symptoms of resting tremor, rigidity, bradykinesia, and postural instability, 5 and the bradykinesia also existed in eye movement 6 ; MS shows motor weakness, spasticity, ataxia, and sensory disturbance 7 ; ALS has the perturbations in the fluctuation dynamics, altered gait rhythm, weakness in legs, feet, or ankles 8 ; HD has uncontrolled movements, emotional problems, psychiatric disorders, and loss of thinking abilities. 9 Moreover, depression symptoms, 10 motor disorders, 11 as well as speech alterations are common in NDDs.
Evaluation of health state and diagnosis of NDDs in most clinics today still rely on the observation-based assessment by clinicians. Thus, the measurement-based diagnosis and treatment of NDDs have attracted interdisciplinary research interest. The objective diagnosis approaches of NDDs are mostly based on neuroimaging, cognitive performance tests, language features, molecular and genetic data, neurophysiological and morphological biomarkers, and clinical records.12,13 Utilizing a simple and reliable wearable system provides a possibility for predicting NDDs in daily life. In addition, both the lack of resources for face-to-face medical facilities and the COVID pandemic requires the remote diagnosis and monitoring of patients with NDDs in daily life.
Wearable sensors are widely employed for their lightweight, non-invasive, and real-time monitoring-supported abilities. 14 They provide objective, accurate, and reproducible measurements that can complement the use of traditional methods. 15 Based on data collected from wearable sensors, machine learning methods were applied for the detection of pathologies. 16 Thus, the recent advances in wearable sensors for biomedical applications17,18 promise smart portable, ingestible, and implantable devices for human health monitoring and disease management. 19
The wearable data were illustrated by the features for the final diagnosis of NDDs. 20 Wearable sensors applied to PD for early diagnosis at home and long-term monitoring were achieved by features from tremors, body motion analysis, and motor fluctuations (ON–OFF phases). 21 Handwriting analysis to support the diagnosis of AD, PD, and mild cognitive impairments was organized by modeling, tasks, and feature analysis. 22 During these mentioned diagnoses, features were extracted from the wearable data, and then the distinctive features were selected to feed into the traditional machine learning model to diagnose the health state. With the selected features, the performance of traditional machine learning can be improved since features that are irrelevant, redundant, or noisy are eliminated.
Prior reviews focused on either wearable sensors, diagnosis methods, or specific diseases, respectively, while the process of how and what features are extracted and selected from different wearable sensors for the diagnosis of NDDs has not been reviewed systematically. Accordingly, the primary objective of this systematic review is to screen the current studies and provide a comprehensive understanding of different wearable sensors and their feature extraction and selection for the diagnosis of NDDs. Therefore, three specific questions were addressed: (1) What kinds of wearable sensors are most frequently used in NDDs diagnosis? (2) Which features are developed for the recognition of NDDs? (3) How features are selected for the efficient diagnosis of NDDs?
Method
Search strategy
This review was conducted following the PRISMA statement guidelines. 23 Though a protocol for this study has been prepared internally, it has not been registered elsewhere, and the PROSPERO database has been checked to confirm the originality of the study.
Electronic searches on the Web of Science, Google Scholar, PubMed, and Scopes were performed. The database searches were completed in September 2022. Searched examples included: “neurodegenerative disease,” “diagnosis,” “wearable sensors,” “feature extraction,” and “feature selection.” The defined search duration includes articles published between 2015 and September 2022. Additional studies were also identified by the reference lists of articles.
Eligibility criteria
The identifying, screening, and selecting of studies for inclusion were conducted as shown in Figure 1. To be identified for inclusion, studies needed to meet the following criteria: they had to be original research written in English, and published in a peer-reviewed journal or conference. Titles and abstracts were screened and excluded if they: (a) were not relevant to the topic; (b) were duplicates; and (c) were similar to selected studies. Then the full texts of the identified studies were screened and studies that used unwearable sensors and without features were excluded. Finally, the studies were excluded if they use the same sensors and features. Each reviewer independently assessed or validated the selected studies. The entire process was carried out manually, without the use of any automation tools.

The flowchart of the study selection process.
To provide a comprehensive overview of wearable sensors and their features for the diagnosis of NDDs, the obtained papers were reviewed and organized in the way of a computer-aided diagnosis process as shown in Figure 2. Various wearable sensors collect different types of data, and from these data, the features are extracted and then selected, finally the selected features are inputted into the machine learning model to recognize the health state.

The diagnosis process using a wearable system with detailed methods.
Results
Wearable sensors and their application for NDDs diagnosis
Wearable sensors are generally placed on different parts of the human body that do not hinder natural movement, and the captured data are transmitted through wireless connections or collected on onboard storage devices. With the rapid development of electronics, biocompatible materials, and nanomaterials, wearable devices have evolved in the form of accessories, integrated clothing, body attachments, and body inserts.24,25 As for NDDs diagnosis and monitoring, various types of sensors can be applied to completely and continuously obtain human activity signals such as plantar pressure, lower limb posture, 26 joint bending, 27 and so on 28 as shown in Figure 3.

Wearable sensors applied to the human body for neurodegenerative diseases (NDDs) diagnosis.
Pressure and strain sensors
Wearable force sensors are flexible or with a flexible substrate to impart mechanical stability to the active material. Force sensors are divided into pressure and strain sensors due to the applied compression or tensile. The transform principles of pressure and strain sensors are diverse such as piezoresistive, piezoelectric, capacitive, and triboelectric. 29
Piezoresistive sensors. Piezoresistivity transforms the mechanical deformations caused by the applied pressure or strain to electrical resistance variations. As a typical piezoresistive pressure sensor generally used, force-sensitive resistors (FSRs) are ultra-thin, low-cost, pressure sensors. FSR can be used in biosignal acquisition for the diagnosis and monitoring of disorders. 30 It can be embedded in gloves to measure both the frequency of the tapping and the force that patients applied in grip. 31 FSR was generally in the shape of radial since the circular structure sensor is most suitable for foot pressure measurement. The irregularity of vertical ground reaction force (vGRF) signals of NDDs caused by gait abnormalities can illustrate different force pattern variations compared to healthy controls (HCs), 32 and thus gait analysis can be used for the diagnosis of NDDs. 33
Piezoresistive strain sensors were successfully applied for measuring bending and torsion types of motion such as knee movement, hand gesture, breathing, phonation (speech), elbow bending angle, finger bending, wrist bending, eye blinking, and neck movement. 34 Plantar pressures with different NDDs and severity levels were given in a public dataset named Physionet (www.physionet.org).8,35 One contains the vGRF of different parts of the plantar from 93 patients with idiopathic PD and 73 HC subjects. Another one contains the total vGRF from 20 HD patients, 13 ALS patients, 15 PD patients, and 16 HC subjects. These data were collected when the subjects walked on level ground at their preferred speeds. It is easy to acquire heel strike and toe-off moments, then the gait events and even more complex features can be deduced for NDDs diagnosis.
Piezoelectric sensors. Piezoelectricity is when the material is compressed and deformed, the cationic and anionic are separated from center to surface, thus positive and negative charges are accumulated on the electrodes and produce electrostatic potential. Polyvinylidene fluoride (PVDF) could exhibit a relatively high piezoelectric property after polarization at a high temperature, and it is widely studied due to the impact of piezoelectricity on biological systems and their versatile biomedical applications. It can be used not only for long-term and stable energy supply but also to monitor a variety of vital signs such as heart rate, breathing, and blood pressure.36,37 As for motor abnormality detection, PVDF sensors were arrayed in insoles to collect plantar pressure in real time. 38 Since the plantar bend of NDD patients tends to be different from the HC, PVDF strips were taped at insoles to measure plantar bend and impact force for NDDs monitoring. 39 Because of the wide application of piezoelectric and piezoresistive sensors in measuring plantar pressure, their wearable gait monitoring techniques were compared. 40
Capacitive sensors. A capacitive sensor composes of dielectric material sandwiched between two electrodes or a structured air gap in the middle of the two electrodes. The electrical energy is stored by transforming it into the electrostatic field. It is widely applied in knee jerks, joint movements, wrist and finger bending, throat motion, and so on as reviewed in Homayounfar and Andrew. 34 Moreover, stretchable and wearable capacitive electrophysiological sensors are applicable for long-term health monitoring. 41
As for diagnosis and monitoring application to NDDs, capacitive sensors also have potential. A capacitive eye tracker was developed to monitor eye movement. This hybrid capacitive sensor made of fibrous and rectangular electrodes had the highest sensitivity since the initial capacitance was reduced and capacitance change was increased when the eyeball was presented. 42 Since PD has abnormal eye movement, this device can be applied to diagnosis and monitor of PD.
Triboelectric sensors. Triboelectric sensors transform mechanical deformation to electricity through the triboelectric effect, which is contact electrification followed by electrostatic induction. Except for the application in cell modulation, drug delivery, circulatory system, hair regeneration, neural prosthesis, biodegradable electronics, gene delivery, microbial disinfection, and implantable devices, TENG is employed for healthcare monitoring by heart and respiratory monitoring, joint motion sensing, sweat and gait phase detection, hearing aid, throat phone, and CO2 detection. 43 Triboelectric transducers which are alternative stretchables and sensitive to muscles/tendons movements were placed on the forearm for PD monitoring by examining not only tremor but also bradykinesia and rigidity same as required by the Unified PD Rating Scale (UPDRS).
Inertial sensors
As motor symptoms predominate and cause considerable functional impairment in patients with NDDs, quantifying gait, and postural control helps the understanding of neurological conditions. Therefore, accelerometers, gyroscopes, and inertial measurement units (IMUs) were widely employed. 44
Accelerometers. The accelerometer measures the acceleration of objects. For NDDs diagnosis by postural measurement of the whole body, the progression markers in the premotor phase of PD were investigated by an accelerometer placed at the back. 45 An accelerometer can also be placed at the center of mass at the lower spine to quantify the sway during a quiet stance with eyes open and closed for the detection of prodromal PD. 46 Accelerometers attached to hips and ankles can be used in gait and balance assessment, and the results show that dual-tasking will help dissect the cognitive and motor contribution in mobility and cognitive decline and future adverse outcomes including falls and mortality. 47 Linking acceleration gait measures to motor skills of walking proved useful in quantifying declines due to aging and other neuromotor factors. 48 Absolute fall incidence was high in NDDs, thus an accelerometer measuring physical activity such as lying or sitting, standing, and walking was used to figure out the fall risk. 49 Especially, an accelerometer-based system that records acceleration signals in 3 dimensions (3D) for intelligent fall detection was developed and it was fastened to the subject's chest. 50
For local part measurement, an accelerometer equipped at the middle finger was far more accurate than at the thumb and center hand to diagnose the stage of PD since the intensity of the PD is related to the amplitude of tremor signals. 51 A wrist-worn accelerometer with the support of a disease-specific cut-point may be further used to measure activities across the continuum during 24 h period in PD. 52 A wireless accelerometer applied with iPhone was used to characterize the tremor of PD. 53 A smartphone accelerometer placed at the wrist using a random forest classifier achieved a high diagnosis accuracy of PD, but moderate accuracy of essential tremor (ET) and poor accuracy of dystonic tremor. 54 Accelerometers can also be tapped at the neck to differentiate between swallows from healthy people and people with NDD. 55 Moreover, it can be employed in handwriting analysis. 56 A device based on an array of four accelerometers connected to an embedded development board was developed to monitor tremor/movement and accidental falls, it can track the Alzheimer subjects’ geographical position. 57
Gyroscope. A gyroscope measures angular velocity or acceleration, and it is sensitive to shocks. It can be employed to detect the tremor at the finger, hand, wrist, and so on. A gyroscope mounted on the hand or head can acquire the tremors since tremulous rotation at the wrist, elbow, or neck will induce tremors. 58 By evaluating angular velocity data recorded by mobile phones’ built-in gyroscope, HC, PD, and ET can also be differentiated. 59 The gyroscope equipped on the shank with a standard deviation algorithm was also developed to prevent falls of PD patients. 60
Magnetometer. The magnetometer can find the orientation of an object by measuring the earth's magnetic field. The bio-magnetometer can enhance the image and eliminate the limitation of conventional magnetoencephalography. 61 In human motion measurement, the magnetometer usually appeared with an accelerometer and gyroscope together. 62 Since the magnetic disturbances contained the magnetometer data for indoor applications, a linear Kalman filtering-based magnetometer-free sensor had been designed for motion capture. 63
Inertial measurement unit (IMU). IMU is a combination of accelerometers, gyroscopes, and occasionally magnetometers, thus it can calculate the angle, velocity, orientation, and gravitational force of the subject. IMU was utilized for gait analysis generally, instrumented clinical tests, upper body mobility assessment, daily-life activity monitoring, and tremor assessment. 64 Wearable IMU has become a solution with the advantage of higher sensitivity and specificity for remote health monitoring since it can not only assess the movement disorders induced by NDDs, but also can evaluate frailty and falls, and promote active living. 65
IMU consists of an accelerometer, gyroscope, and magnetometer incrusted in an ergonomic glove equipped with a module for a micro SD card and Bluetooth adapter. It is portable and wireless with mobility acceptable to the user when testing in different environments. 66 IMU composed of a triaxial accelerometer, a gyroscope, and a magnetometer was placed at the feet dorsum, shanks, thighs, chest, and the back side on the lumbar zone for PD diagnosis. Results indicate that diagnosis accuracy does not directly relate to sensor number. 67 IMU placed at a subject's lower back with gait parameters estimating algorithm can be used for quantifying the progression of PD and assessing medication administration. 68 Four IMUs were attached to the subject's lower limbs to obtain continuous relative phases for distinguishing PD and PD group division. 69 Moreover, to supplement the electrooculogram sensor that measures the eye movement for early diagnosis of NDDs, IMU sensors were embedded in an eyeglass to measure the head movement and tremors. 70
With the development of smartphone techniques, smartphones can provide an inexpensive measurement platform with built-in sensors (acceleration and gyroscope) for health state assessment. For example, accelerometer and gyroscope data collected from a smartphone can be used for PD detection. 71 It can be attached firmly to the subject's waist in a bag during a 20-step walking test. 72
Electromyography sensors
Electromyography (EMG) signal is the electrical current generated in muscles during neuromuscular activities, and it indicates the degree of muscle activation and fatigue. Surface EMG is the non-invasive electrodes applied on the skin, and it is affected by the noise from the nearby muscle. The fine wire electrode is more accurate and precise since it is inserted into the muscle using a hypodermic needle, thus it is also called needle EMG. 73 Surface EMG provides significant practical and analytical flexibility compared to invasive techniques in ALS. 74 It was widely employed in the diagnosis of NDDs by sleep disorders, motor (gait, posture, facial expression, and handwriting) impairments, and other biomarkers. The EMG signals of antagonist muscles surface can investigate PD patients, ET patients, and HC. 75 To obtain an accurate diagnosis of gait disorders, 10 bipolar surface EMG electrodes were attached to five muscles of each leg. 76
Surface EMG signals from the upper extremities, such as the arm and wrist, would be an efficient way to assess neuromuscular function in the detection of PD. 77 To classify different severity levels of PD, surface electrodes were placed over flexor carpi radialis and biceps brachii muscles to record EMG signals during selected upper arm movements: elbow flexed at 90°, elbow flexed at 90° with 1 kg load, wrist pronation, and touching the shoulder. 78 High-density surface EMGs at the vastus lateralis muscle were collected when the participants performed ramp-up and sustained contractions at 30% of their maximal voluntary contraction and then decomposed into individual motor unit firing behavior using a convolution blind source separation. This is an important physiological index for understanding the pathophysiology of ALS. 79
In addition, surface EMG sensors were also employed for NDDs diagnosis in some tasks. The UPDRS can be predicted by surface electrodes of EMG attached to a wristband in a tapping task. 80 EMG signals from eight different points of the forearm during handwriting were acquired by the Myo™ Gesture Control Armband (www.myo.com) for the PD diagnosis. 56
Tonic but not phasic EMG activity may serve as stable biomarkers for predicting the progression of neurodegeneration in idiopathic rapid eye movement (REM) sleep behavior disorder. 81 Assessed by excessive transient muscle activity in the chin or limb EMG in REM sleep, idiopathic REM sleep without atonia may be accepted as a risk factor in the development of PD or other types of NDDs. 82 It is worth mentioning that when EMG was used with transcranial magnetic stimulation to measure the invoke muscle responses, robust measures of function in a variety of cortical network components will be measured. 83
Electroencephalography sensors
Electroencephalography (EEG) was collected by sintered Ag/AgCl electrodes attached to the scalp. EEG signals contain rich information related to the functional process of the brain. It promised to study the relationship between functional impairment and the neural circuit. The influences of PD on brain activity differ from the healthy person's activity. 84
The EEG for NDDs diagnosis was generally collected during resting state 85 with the eyes open or closed to reduce the influence of noise related to artifacts such as blinks, heartbeats, cranial muscle activity, and electrode movements caused by head movements. 86 With the miniaturization of EEG equipment, portable wireless headsets sprout and it helps the utilization in daily life activities. 87
There are many public EEG datasets collected from NDD patients. University of California San Diego Resting State EEG dataset recorded 15 PD patients and 16 HC subjects. 88 EEG signals from 25 PD patients and 25 HC subjects were recorded during a three-stimulus auditory oddball paradigm both with and without medication. 89 Neuronetrix dataset collected the EEG signal from 103 subjects with probable mild AD and 101 HC subjects under clinical tests. 90
Acoustic sensors
Abnormal voice patterns indicate the health state to some degree. For example, PD patients lack intensity modulation, 91 while the progression of HD relates to speech alteration. 92 Acoustic analysis is a valuable and objective tool supporting the diagnosis of NDDs, especially in remote medical examinations during pandemic durations. For capturing voice and speech signals, microphone sensors are appropriate since they are tiny, low-cost, portable, and readily configurable with embedded electronics. An omnidirectional microphone was utilized to collect phonation of sustained vowels /a/, /e/, /i/, /u/ from 39 HC subjects, 60 patients affected by PD, and 54 patients affected by MS. 93 The bulk acoustic wave or quartz crystal microbalance was also employed for breath analysis in NDDs. 94 The speech acoustic and articulatory movement data were collected by electromagnetic articulagraph attached to the subject's tongue, lips, and head, and they could improve the performance of ALS detection significantly. 95
Except for speech signals, body sounds (e.g. breathing, clearing throat, and swallowing), which can be collected from the subject's phone usage (e.g. calling, voice message, voice mailbox, and voice chatting) in daily life can also assess the health condition using a customized residual network. 96 Smartphones may provide an increasing number of longitudinal vocal samples from a given individual in an easy and inexpensive way. 97 It has been proved that PD can be predicted early even through voice recordings recorded on smartphones. 98 Voice signal collected from the smartphone can be conveniently uploaded and then transmitted to the cloud, and the noise and size of the signal were reduced to store as history information. Experts or doctors can then detect and monitor patients from remote areas. 99
There are some acoustic datasets such as the dataset from the University of California at Irvine Machine Learning Repository. The data were collected from 20 healthy individuals and 20 patients with PD.100,101 DementiaBank contains speech data from 167 AD and 97 HC subjects. 102
Optical fiber sensors
Though optical array sensors are highly advantageous for the early detection of AD with multi-biomarkers, 103 it is chemical and not wearable. Optical fiber sensors are developed based on the change in light transmittance as follows: the light beam generated by a light source travels through an optical fiber, and then the intensity-attenuated light beam is received by a photodetector. By simple calculation of the light intensity attenuation, the bending angle of the optical fiber can be obtained, thus it can monitor the human joint angle. 104 Since optical fiber sensors are stretchable and highly sensitive, they were assembled into clothing or mounted on skin surfaces for monitoring human activities such as wrist pulses, joint bending, and hand gestures. 105 In addition, it can even noninvasively quantify the analytes or physiological events under the skin. 106
Optical fiber Bragg grating (FBG) sensors attached to the biocompatible tape were used to monitor the knee angular flexion/extension during walking, and it is even possible to detect the muscle's peak activity moments. 107 Moreover, the sensing network of FBG sensors was multiplexed (in series) in one single optical fiber cable, thus it can simultaneously monitor plantar pressure, peak muscle activity, and the ankle and knee sagittal range of motion, without the need for any synchronization or delay adjustments. 108 Though optical fiber sensors emerged in recent years, their application in joint bending and activity monitoring can be further put into use in the diagnosis and monitoring of NDDs.
Global positioning system
Global positioning system (GPS) and similar technologies in commercial wearable devices such as smartphones, navigation systems, and smart watches can collect precise locations at any time, thus they can assess daily mobility patterns. 109 Though there is a paucity of published studies about wearable GPS, some NDDs-related work had been conducted. Wearable GPS-derived measures had been validated and may apply to NDDs. 110 Wearable GPS was also compared to self-reported measures in recording mobility outcomes and proved promising for research and clinical measure of real-life mobility in PD patients 111 and healthy older adults. The mobile phone's built-in GPS distinguished mild-to-moderate AD patients from controls. 112 Moreover, GPS driving may serve effectively for identifying preclinical AD among older adults. 113
Multi-sensors
These mentioned wearable sensors have different applications, strengths, and drawbacks as shown in Table 1. To take full advantage of these sensors and acquire more NDDs-related information, multi-sensor systems have been devised and tested for NDDs diagnosis propelled by the development of integrated electronics. The sensor network with a complex array is better suited to the diagnosis of PD while the arrangement can be simplified for quantification and tracking once the diagnosis is determined. 114 The combination of EMG and EEG signals can achieve the highest diagnosis accuracy than they singly used. 115 It was observed that heterogeneous sensor-based health monitoring is the most effective way because of its ability to combine multiple sensors from various domains. This also indicates that the fusion of multiple sensors provides reliability, credibility, and better accuracy for human health monitoring by multiple parameters. 116 Versatile wearable sensors can be integrated into smartphones, tablets, smart watches, eyeglasses even masks facilitated to healthcare in daily life.
The sensors used for diagnosis of NDDs.
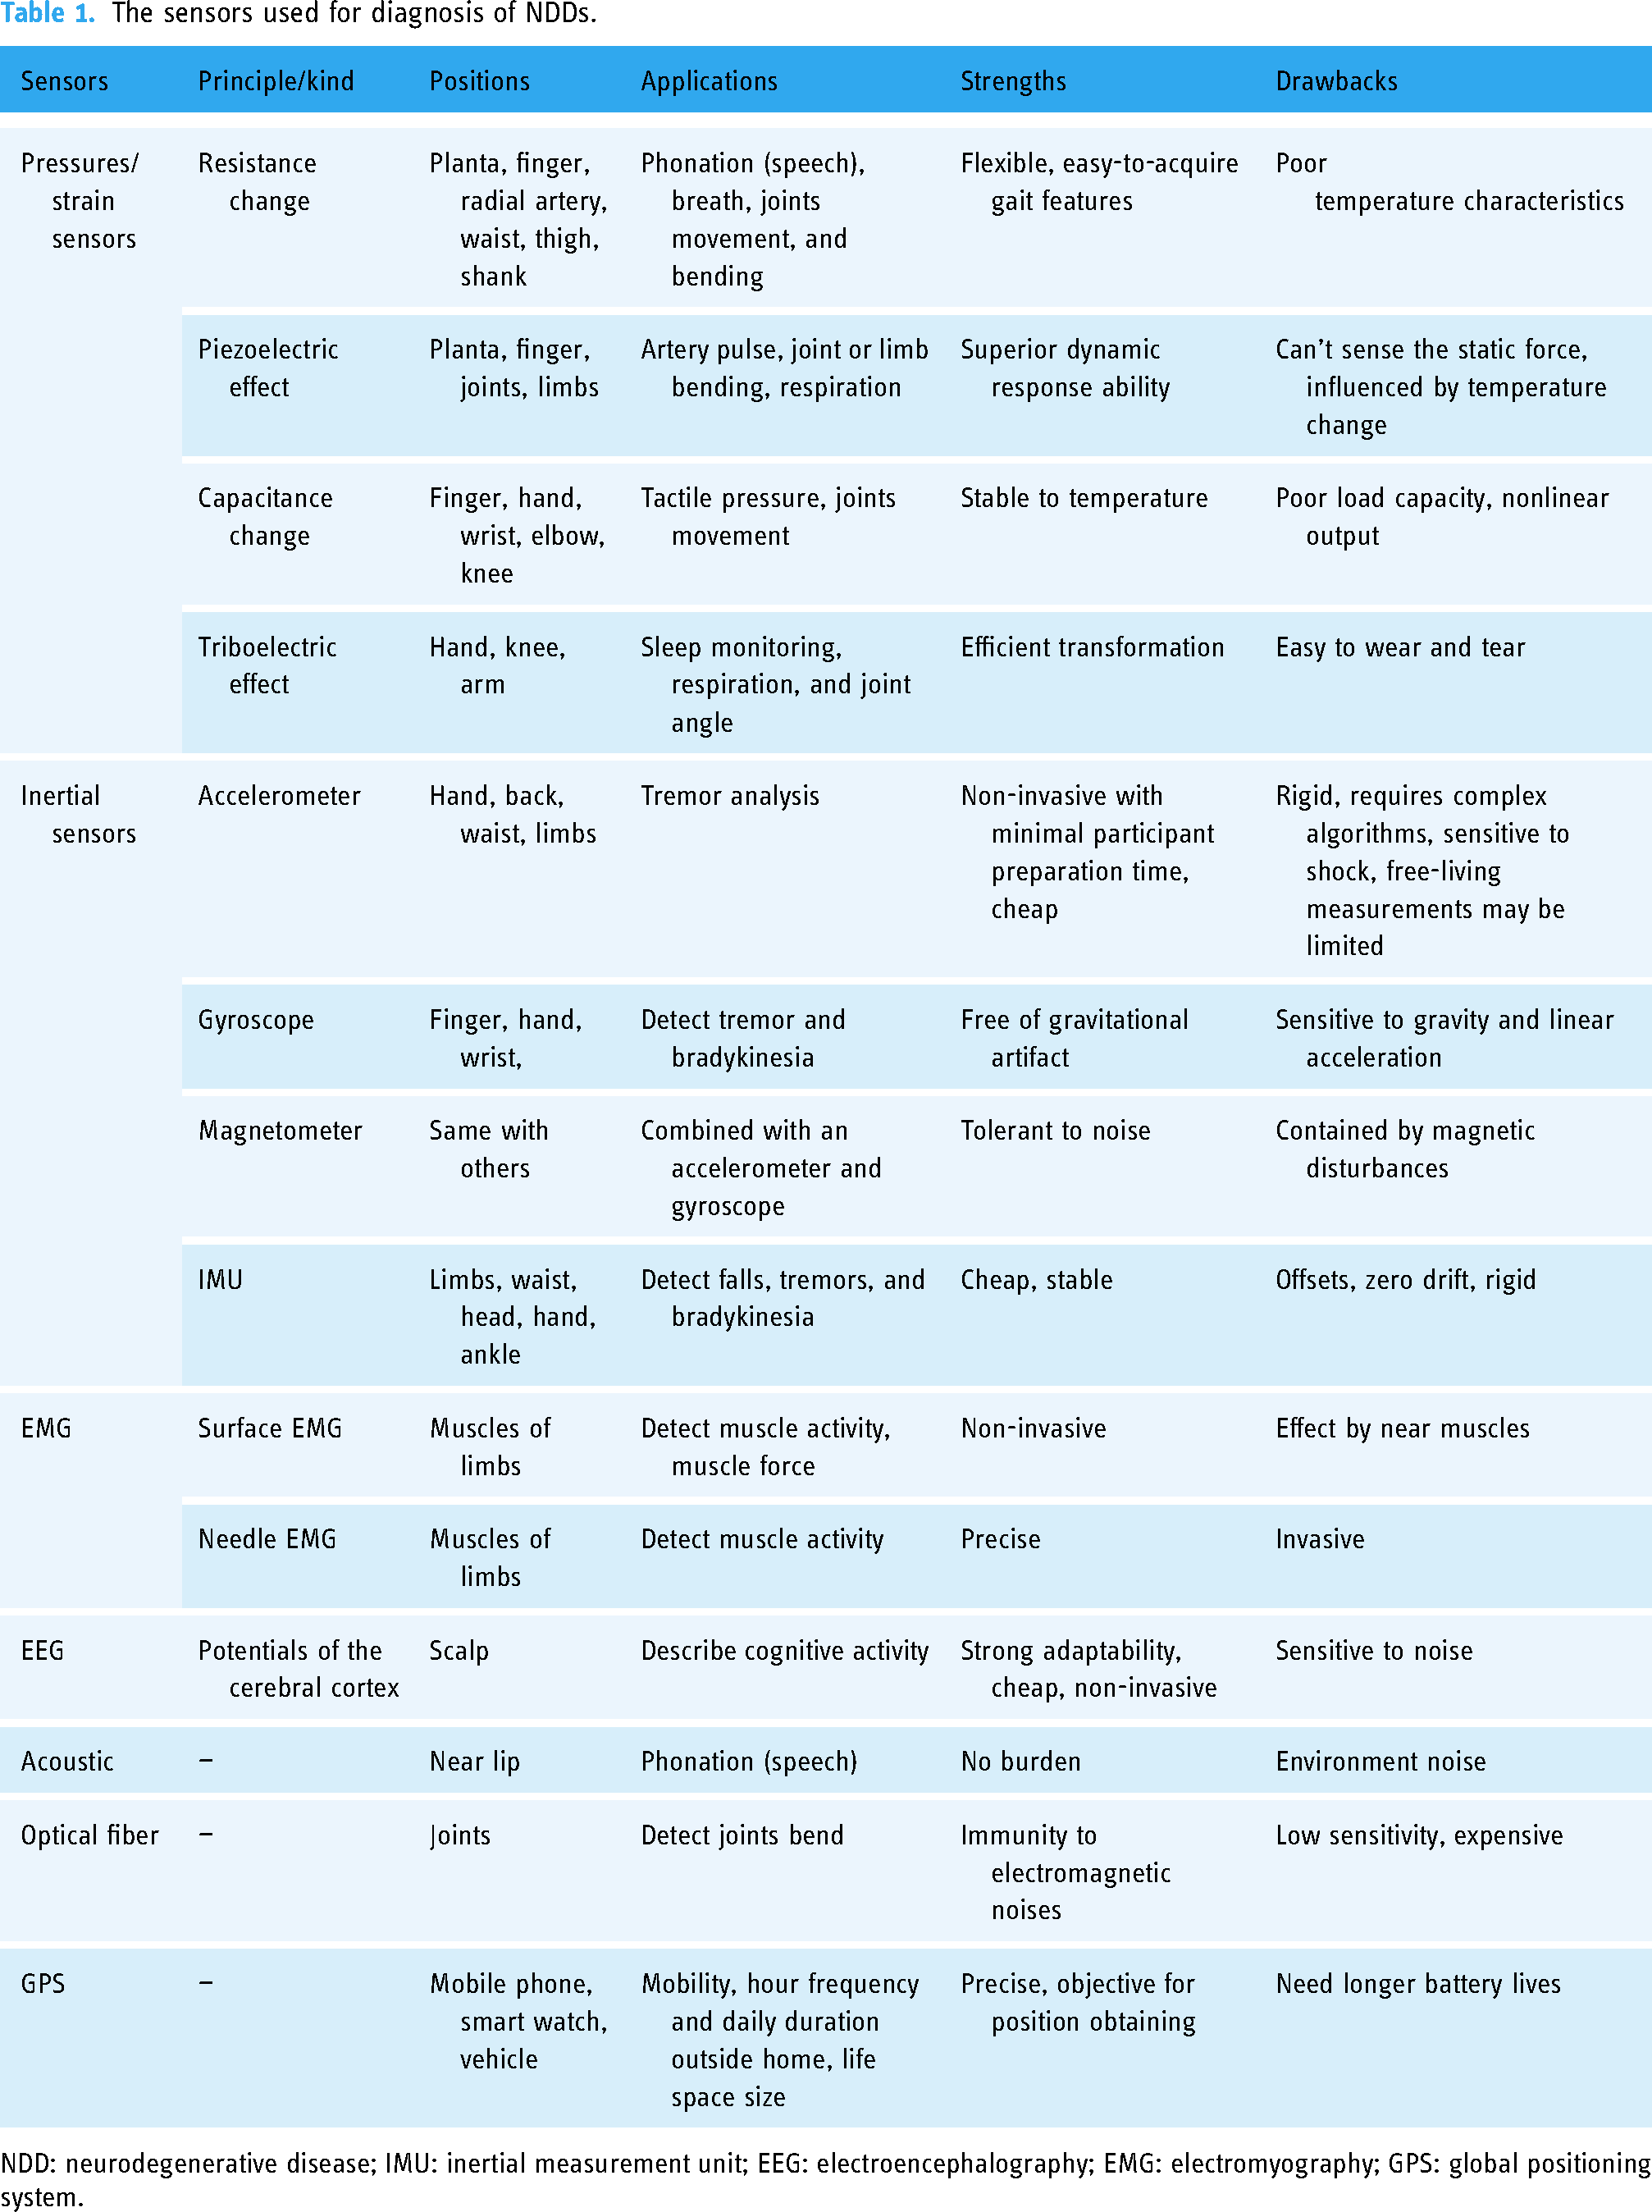
NDD: neurodegenerative disease; IMU: inertial measurement unit; EEG: electroencephalography; EMG: electromyography; GPS: global positioning system.
Features extraction
Features are the key to distinguishing the type of NDD, it also determines the classification performance. To illustrate the underlying differences between NDDs and HC as well as the differences among NDDs themselves, various kinds of features were extracted as displayed in Figure 4.

Various features applied to the detection of neurodegenerative diseases (NDDs).
Physical features
Time domain features. Physic-related features that can directly illustrate the appearance of the motion are extracted from the time domain. There are many different physical features on the account of the versatile signal obtained by various sensors.
Several gait features that characterize vGRF patterns were extracted including gait duration, peak value, and peak delay. 117 Spatiotemporal gait features indicate time and distance-related gait events, for example, the stride time, stance time, swing time, step length, stride length, gait speed, and cadence. 118 Step velocity and step length were found to be the best and most stable gait characteristics defining progression during the prodromal PD phase. Moreover, the asymmetry of step, swing, and stance time and step length are higher for PD patients than HC. 119 The speed, stride length, swing time, and hip excursion were found reduced in patients with PD compared to HC during normal walking. Additionally, PD patients presented higher cadence and double support time. 5 The postural sway can also be characterized by: total sway area and 95% ellipse sway area. While anticipatory postural adjustment was represented by durations, first-step length (degree), and first-step latency. 120 The amplitude and peak-to-peak value of the plantar bend signal were found lower for PD patients than HC. 39
Range of motion refers to the minimum to the maximum angle between two adjacent articular segments within one gait cycle. Range of motion of the ankle, knee, and hip was found reduced for PD patients, and they help to higher diagnosis accuracies when combined with spatiotemporal features. 67 The estimated tremor amplitude showed a high correlation to the UPDRS subscores. 121
Execution time is the time interval(s) during the handwriting task, it can be extracted from the EMG signal with the adaptive threshold. This dynamic feature was important to different PD patients from HC. 122 The motor unit number index of limb muscle for ALS patients was found consistently lower than HC, while the muscle fiber conduction velocity was increased in ALS. 74
When tackling dysarthric-like speech of NDDs, duration of pause intervals, rate of speech timing, articulatory rate, change in interval length, period of onset of vocalization, and vowel keeping time were extracted. 123
As for GPS data, features such as “hourly frequency” (number of trips taken outside of the home per hour sampled) and “daily duration” (percentage of total time sampled per day individuals were outside of the home) were significant. 111 Location and activity features are active time ratios, steps per recording, time at the home ratio, trips out, destination trips, and max distance; transit and community mobility features are distance or time in the vehicle, distance or time on foot, ellipse max distance or area. 113
Frequency domain features. Frequency analysis completes the information of time domain features. Frequency spectra (obtained by fast Fourier transform) and power spectral density of left stride, right stride, and left swing signals, which were derived from the vGRF signal were effective to differentiate patients with ALS, HD, or PD from HC subjects. 124 Features of power spectral density such as peak amplitude, peak delay, and area under the curve were extracted. 117 Higher-order spectra have the ability to preserve useful information due to deviations from Gaussianity and nonlinearities in the time series such as EEG and EMG. 125
EEG signals either for AD or HD detection were analyzed by Fourier transformation. AD patients display a slow characteristic EEG frequency band than HC. 123 The average magnitude of the fast Fourier transform coefficient extracted from the EEG signal can classify AD patients from HC participants, and it gains new insights into how the location of channels and frequency bands correlate to AD classification accuracy. 126
When comes to the speech signals, the main frequency of vocal cord vibration or pitch, jitter, shimmer, noise-to-harmonics ratios, formant frequencies, pitch and amplitude perturbation quotient, Mel frequency, and cepstrum coefficient were extracted. 123
Time-frequency domain features. Time-frequency analysis is a generalization and refinement of Fourier analysis. Continuous wavelet transform, short-time Fourier transform, and wavelet synchro squeezed transform were applied to obtain time-varying frequency spectrum characteristics based on a vGRF signal. 32 The six-level discrete wavelet transforms with different wavelets were employed to extract detailed components of force signals for both left and right feet for the NDDs classification. 127 Using wavelet coherence to the visualized time-frequency spectrogram of plantar force signals helps to differentiate between the gait phenomenon of patients with NDD and HC. 128 Intrinsic mode functions calculated by empirical mode decomposition have been extracted for PD detection based on the Euclidian distance of vGRF signals after phase space reconstruction. 129
The local maxima of the wavelet spectrum from EMG and acceleration data at the tremor side in the 1–3 Hz and 3–7 Hz frequency bands are promising for the early diagnosis of PD. 130 Mel-frequency cepstral coefficients and the tunable Q-factor wavelet coefficients obtained from voice signals achieved high accuracy when classifying PD patients and HC. 131
Statistical features
Statistical features describe the statistical characteristics of signals. Traditional statistics such as mean, standard deviation, skewness, and kurtosis can deal with the time domain features and frequency domain features further for more distinctive markers.
To identify distinct features of PD gait, the mean, standard deviation, and even coefficient of variance (the ratio of standard deviation to the mean) of physical features were extracted. 132 Step width variability was found significant for the diagnosis of PD, while stride width variability and step double support time variability were found related to the PD severity level. 133 The longitudinal assessment of gait impairments found that gait variability and asymmetry characteristics seem to be the best predictors for PD conversion. For example, higher step time variability and asymmetry of all gait characteristics were associated with a shorter time to PD diagnosis in Del et al. 119 On the contrary, a lower variability of wrist movement was found compared to HCs. 134 Mean, variance, skewness, and kurtosis based on sparse matching pursuit decomposition of vGRF were found more efficient in ALS detection. 135
Maximum amplitude, mean, and standard deviation of EMG signals at biceps brachii muscles were strategically quantified, and they were larger for ALS patients compared to HC subjects. 136 Stockwell transform was applied to the EMG signal to extract features such as energy, mean, and standard deviation for the detection and classification of healthy and neuropathy. 137 Skewness and kurtosis of EEG spectra were utilized to detect mild cognitive impairment. 138
Nonlinear features
Nonlinear dynamic features such as correlation dimension, Largest Lyapunov exponent, Hurst exponent, Lemplel–Ziv complexity, approximate entropy, and sample entropy extracted from the time series of the gait signals were explored for the diagnosis of PD. 139 The time series of multiple gait fluctuations can be embedded into the phase space, and then the topological signatures of barcodes were extracted by persistent homology. 140 Multifractal detrended cross-correlation analysis was also applied to study the autocorrelation and cross-correlation of the vGRF for both feet. It found that the multifractality and degree of correlation are generally more for HC than the NDDs. 141 For speech signal, the fractal jitter that explores the self-similarity of the variations in the fundamental frequency, as well as the multivariate fractal scaling exponent was extracted for better diagnosis of ALS. 142
Entropy measures the uncertainty and randomness of the system. Multiscale approximate entropy was calculated from the vGRF of both feet to the diagnosis and long-term assessment of NDDs. 143 Sample entropy was determined for the stride time, with vector length and threshold parameters optimized PD, and it found that PD patients had higher sample entropy stride time than older adults, indicating reduced gait regularity. 144 Sigmoid entropy of EEG signal was found to be better and computationally efficient when compared to other entropy methods. 145 Shannon wavelet entropy, Renyyi wavelet entropy, Tsallis wavelet entropy, permutation entropy, and fuzzy entropy of both IMU and speech data can detect PD as well as their severity level. 146 Shannon entropy, permutation entropy, dispersion entropy, fluctuation-based dispersion entropy, slope entropy, bubble entropy, increment entropy, and bispectral entropy were extracted from the EEG signal for the PD diagnosis. 147
The amount of divergence between the left and right stride, swing, and stance intervals was quantified by the dynamic gait series warping, Euclidean, Manhattan, Minkowski, Chebyshev, Canberra distances, and cosine function. 148 Hidden Markov models were used to encode the IMU gait sequences to extract their dynamics and provide a fixed-length representation. 149
To create meaningful quantitative descriptions of behavioral characteristics of cerebellar ataxias, data collected from inertial sensors were analyzed by autoregressive hidden Markov models complied with a time-frequency approach. 150 Furthermore, a bag-of-words feature engineering method was developed: dividing each time series into subsequences, similar patterns are identified and a vocabulary was generated using the identified patterns. Then, word features were calculated based on the similarity of each subsequence to the vocabulary patterns. It outperforms the epoch-based statistical feature engineering method in the diagnosis of PD. 151
Features extracted from networks
Features also can be extracted from networks. A deep convolutional neural network, referred to as a gait segmentation network had been developed and trained with the purpose of improving traditional gait segmentation from IMU at the fifth lumbar vertebrae and the ankles. 152
Sets of vocal (speech) features were passed to the parallel input layers which are directly connected to convolutional layers, and deep features from each parallel branch were extracted simultaneously before combining in the merged layer. 153
The latent factors of EEG were extracted by variational auto-encoders, and they can be mapped to the three-dimensional state space, thus the transient rotation of a neural state, which indicates the dynamic characteristics of latent factors can be found. 154
Features selection
The extracted features may be redundant and some irrelevant features may overfit the diagnosing model as the sample size is limited. Thus, features selection processes have been designed to select discriminative features or discard redundant ones. Generally, depending on the relation to the latter diagnosing method, feature selection strategies can be divided into filter methods, wrapper methods, and embedded methods 155 as displayed in Figure 5.

Feature selection methods utilized for the diagnosis of neurodegenerative diseases (NDDs).
Filter methods
Filter methods are independent of the classification process. They are effective in computation and robust to overfitting but key features may be missed. Moreover, they can provide interpretable and direct indications of disease influence.
Relevance indices. A good feature should not correlate to other features already selected. The correlation coefficient is the simplest approach to measure their relevance. The Spearman correlation coefficient to select the optimal feature set was applied with a stepwise regression method for PD diagnosis. 156 Mutual information (MI) between each of the features and the class label was determined based on the dependence of the target feature. Features with higher MI were retained since the high MI value represented less randomness and a higher correlation between the feature and its class. 157 Fisher score which measures the relevance between each dimension of the feature vectors and their assigned class labels, as well as Relief which reveals the dependencies of features and class labels were employed to reduce the dimensionality of speech features for PD classification. 158 Correlation feature subset selection has higher accuracy than the information gain and gain ratio for the AD prediction. 159 ReliefF algorithm computed the feature importance weights to detect PD from voice recordings. 160 There were also many multivariate techniques in filter methods for biomedical feature selection, 161 for example, a consistency-based filter selects subsets of features based on the degree of consistency with the class.
Significant difference analysis. Significant difference analysis aids to find out the distinctive features, and they may be the most commonly used approach in feature ranking or selection for NDDs diagnosis. Parametric tests such as analysis of variance (ANOVA) or Student's t-test analyze the data which conform to the Gaussian distribution (normally distributed variables), while non-parametric tests such as the Kruskal-Wallis test and Mann–Whitney U test deal with data that do not obey the Gaussian distribution.
ANOVA with recursive reduction was used to improve the dimension reduction and it reduced the number of sensors from 16 to 2 for plantar FSR. 162 For longitudinal data, variances tend to increase with time and covariances decrease with increasing intervals in time. Thus, ANOVA is not proper since it assumes the measured outcome saves equal variances and covariances over time. Therefore, multivariate ANOVA models that treat repeated observations as a vector had been utilized to detect HD progression. 163
Student's t-test was applied to features extracted from vGRF to recognize how significant each feature was in terms of differentiating PD and control subjects. 164 Independent t-tests were employed to examine the difference between PD and HC, moreover, Pearson's correlation between gait characteristics was also evaluated to see the independence and redundancy. 165
Wilcoxon rank-sum test (p < 0.01) proved that the approximate entropy, normalized symbolic entropy, and signal turns count are significantly larger for PD patients than HC. 166 Mann–Whitney U test observed some gait alteration in PD patients. 132
Principal component analysis (PCA). Features dimensionality will sometimes be reduced by PCA. The PCA was used for feature enhancement of the recurrence plots transformed from the time-domain vGRF data. 167 PCA was implemented to reduce the dimensionality and select the most appropriate features from eight parameters namely mean, standard deviation, variance, skewness, kurtosis, energy, entropy, and correlation of each seven-gait feature (left stride interval, right stride interval, left swing interval, right swing interval, left stance interval, right stance interval, and double support). 168 For gait classification of NDDs, PCA removed correlated features within each symmetric measure (being involved in more than one time series for feature extraction). 148 PCA reduced the dimension of handwriting features, and the most representative features were found related to surface EMG. 56 Moreover, it can identify the differences in gait (e.g. hip and knee kinematics) from PD patients to HC. 169
Wrapper methods
Wrapper methods need a learning model to evaluate candidate subsets and provide feedback. They have high accuracy and can identify key features in the cost of high time complexity, low operating efficiency, and poor generalization ability. Wrapper approaches aim to enhance the performance of the specific diagnosing model. The sequential feature selection method was utilized to reduce the number of features such as multiscale sample entropy values combined with statistical values extracted from the differential transformation of the vGRF signal. 170
Regression approaches select or remove features based on the output of predictors. Stepwise regression models were proved to have superior convergent validity than PCA. 171 Evolutionary algorithms were applied to feature selection for AD diagnosis. 172 A generic algorithm is also a wrapper method, and it also belongs to the evolutionary algorithms. The best feature was selected using a fitness function and delivered to the next generation by a crossover operator. 173 Genetic algorithms and a binary classifier (X-ROC) were used to select the best combinations of EEG features for PD diagnosis. 174 Multiple ranks with a majority vote-based relative aggregate scoring model were proposed to select key features for PD analysis. 175
Embedded methods
Embedded methods perform feature selection and classification simultaneously since features were selected in the training process. They were divided into regularization-based embedded feature selection and tree-based embedded feature selection. 176 A new feature selection method was developed by embedding the relational information inherent in the observations (sample–sample relation, feature–feature relation, and response–response relation) into a sparse multi-task learning framework for the diagnosis of AD diagnosis. 177 A joint kernel-based feature selection approach was proposed to best benefit the classification scheme in the kernel space for the early diagnosis of PD. 178
Hybrid method
There was no universal feature selection and classification method for medical datasets, different feature selection methods combined with different classification methods had been tried to find the best performance. 179 The mentioned three feature selection methods were tested by speech features, ANOVA as filter method, sequential feature selection as wrapper method, least absolute shrinkage, and selection operator act as an embedded method, and both of them selected the jitter and shimmer. 180
Wrapper methods combined with the filter method, such as Fisher's score and recursive feature elimination methods. 181 Pearson correlation coefficient and ReliefF were both applied to calculate the feature weight and then inputted into the discrete artificial bee colony algorithm for PD diagnosis. 182 Correlated feature selection combined with particle velocity clamping swarm optimization takes advantage of both the filters and the wrappers. 183 A hybrid MI gain and recursive feature elimination method selected 40 features out of 754 speech features, and it achieves the highest accuracy in classification than other standard feature selection approaches. 184 Features selected by filter and embedded methods were inputted to a wrapper-based approach optimizing both stability and predictability for AD prediction. 185
Discussions
Applications for diagnosis
Feature extraction and selection aim to find distinctive features and they help an interpretable diagnosis of NDDs since most machine learning methods are limited by congenital observations. As mentioned, feature values of different NDDs were separated, and these discrepancies can be utilized as prior knowledge for the early diagnosis of corresponding NDD. 186 Machine learning based on handwritten, voice, and gait datasets was utilized for the diagnosis of PD in clinical decision-making. 187 Separate multivariable linear regression models and proportional odd regression models were applied to evaluate the relation of the Kinect measures to UPDRS motor and postural instability and gait difficulty scores. 188 Moreover, bradykinesia severity was measured by the frequency content of strides from a waist-worn sensor based on UPDRS scores estimated by support vector regression model. 189 Decision tree, random forest, K-nearest neighbor, Naïve Bayes, and support vector machine (SVM) were widely applied to various data for NDDs classification based on features. 123 SVM can produce efficient classification accuracy when feed directly with the features extracted by the wavelet transformation from the vGRF signals. 190 SVM was also the most used classification algorithm for the detection of AD, PD, HD, and ALS, respectively. 123 However, there are still challenges in the current applications of traditional machine learning in the diagnosis of NDDs domain. It is of great importance to properly address these issues in facilitating the clinical diagnosis and treatment strategy with the wearable system.
Influences of data collection
Sensors used in health monitoring and diagnosis that have reached an industrial level or that are at least at the stage of advanced field trials have been reviewed. Although the majority of works reported are not clinically and extensively validated for effectiveness confirmation, wearable sensors still present a promising impact on the diagnosis and monitoring of NDDs. On one hand, wearable sensors can achieve high accuracy when compared with videos of routine exercises, and the results show that sensor data analysis has the highest f1-score while handwriting is the most convenient. 191 On the other hand, the evaluation of PD developed from the in-lab devices such as force plate and needle EMG transitioned to wearable accelerometers/gyroscopes, and finally to phone and mobile applications in home monitoring. 192
Evaluation of the health state or diagnosis of NDDs does not rely only on a single index or measurement even for clinic experts. Therefore, the wearable system should have the ability to collect different types of signals for more symptoms. With the rapid development of the smartphone, some sensors integrated into the phone and smart watches can collect versatile data such as speech signals, inertial signals, location data, and so on. In addition, the relationship of the signal obtained by the multisource sensors should be explored in the future. It is also worth noting that various tasks during data collection display different even contrastive effects on NDDs diagnosis. Self-selected walking speed conditions without dual tasking perform better for prodromal PD detection. 119 While some studies state that gait abnormalities were evident in dual cognitive tasks for PD patients. 193 To figure out the inherent influence of task effects on NDDs diagnosis, collecting more wearable data with more different tasks will be desired.
Challenges and prospects
This review will facilitate the research of wearable sensors as a noninvasive, less expensive, and potentially portable technique for NDDs' study, assessment, and diagnosis, particularly for low- and middle-income countries, which lack access to costly neuroimaging equipment. But there are still some challenges: (1) For wearable sensors, there remain considerable variability and lack of standardization in the wearable sensor technology platforms, type of clinometric data acquired, and remote monitoring resolution as it relates to the sensor location. 194 Using wearable sensors for the diagnosis of NDD is still in the exploration stage. Therefore, there are some limitations of existing research in the future clinical applications for the diagnosis of NDDs. The long-term test of the wearable sensors applications to patients has not been conducted for most of these wearable sensors. This is mainly limited by the personal privacy of users, moreover, the long-term and low-burden ability of the power supply. (2) As for feature extraction and feature selection for diagnosis, most of the existing research mainly focuses on the analysis of signals based on the public dataset to find out the significant features and diagnosis method. The amount of public data collected from the wearable sensors is rare and thus lacks individual diversity, this lead to the mined information being limited and lack of generability. To deal with this issue, more data collected from wearable sensors are required and to be published in the future. (3) For the used dataset itself, most of the studies are cross-sectional studies, the NDDs and HC samples are independent even for some NDDs severity level studies, and the individual differences between each subject may submerge the alteration induced by the NDDs and their progression. Therefore, studying the NDDs progression with the longitudinal study will be helpful though it is challenging. (4) The summarized feature extraction and feature selection methods are fundamental procedures for diagnosis with the traditional machine learning method. With the development of deep learning methods, they have been introduced to the diagnosis of NDDs despite the lack of interpretability and transparency. Corresponding application and development in the diagnosis of NDDs should also be summarized in the future. In summary, to overcome these issues and develop an entire wearable system with NDDs diagnosis method based on machine learning in a complex space such as daily life, more longitudinal studies, and more cross-disciplinary training projects are needed. In addition, a collaboration between experts in biomedicine and machine learning is required.
Conclusions
This study provides a comprehensive examination of wearable sensors and features for the diagnosis of NDDs. The study includes 171 articles that were chosen after a thorough screening process. Crucial aspects of NDDs diagnosis were grouped under three main categories: wearable sensors, feature extraction, and feature selection. Such aspects have been reviewed, compared, and discussed, with the final goal of providing an overview of the state-of-the-art on wearable sensors for NDDs diagnosis and assessment. The application details such as principle, applied position, detecting events, strengths and drawbacks of force sensors, inertial sensors, EMG, EEG, acoustic sensors, optical fiber sensors, and GPSs have been illustrated and compared. Based on the wearable data, physical features, statistical features, nonlinear features, and features from the network have been illustrated and their alteration toward diseases have been displayed. Among these extracted features, feature selection methods including filtering, wrapper, and embedded methods have been illustrated to select discriminative features and achieve an efficient diagnosis. This review provides researchers with a complete view of the use of wearable sensors, feature extraction, and feature selection in NDDs diagnosis and monitoring. In the future, the wearable system can quantificationally evaluate the health state with interpretable results and records to help determine the need for medication changes in telemedicine applications further.
Footnotes
Acknowledgements
The authors would like to thank the colleagues who generously gave up their time to share their experiences.
Contributorship
HZ contributed to the conception and execution of the research analysis, drafting of the manuscript, review, and critique of the manuscript preparation. JX contributed to the execution of the research and manuscript preparation. JC and WL contributed to the conception, design, and organization of the research project, review, and critique of manuscript preparation. HC and QQ contributed to the organization and execution of the research. YL and CB contributed to the review and critique of the manuscript preparation. All authors critically read and approved the final manuscript.
Declaration of conflicting interests
The authors declared no potential conflicts of interest with respect to the research, authorship, and/or publication of this article.
Ethical approval
Not applicable.
Funding
The authors disclosed receipt of the following financial support for the research, authorship, and/or publication of this article: This work was supported by the National Key Research and Development Program of China (grant number 2021YFE0203400), and Innovation and Technology Commission under Mainland-Hong Kong Joint Funding Scheme (MHKJFS), the Hong Kong Special Administrative Region, China (Project No. MHP/043/20).
Guarantor
HZ.
Informed consent
Not applicable.