
Abstract
Objective
To develop and internally validate interpretable machine learning (ML) models for predicting incident cardiovascular disease (CVD) among middle-aged and older Chinese adults across cardiovascular–kidney–metabolic (CKM) stages 0–3, excluding CKM stage 4 (established CVD) by design, and to characterize stage-specific risk patterns using SHapley Additive exPlanations (SHAP).
Methods
Using data from 6049 adults aged ≥45 years without baseline CVD in the China Health and Retirement Longitudinal Study, we developed interpretable ML models to predict incident, self-reported CVD during follow-up across CKM stages 0–3. Feature selection combining the Boruta algorithm with recursive feature elimination identified 11 key predictors. Five ML algorithms—logistic regression, random forest (RF), Extreme Gradient Boosting, Light Gradient Boosting Machine, and multilayer perceptron—were trained and evaluated using a stratified 70/30 train-test split. SHAP analysis enhanced model interpretability and characterized stage-specific risk profiles.
Results
During a median 6-year follow-up, 1373 participants (22.7%) developed CVD, with incidence increasing progressively from 11.9% in Stage 0 to 24.4% in Stage 3 (p < 0.001). The RF model showed moderate discriminative ability (area under the receiver operating characteristic curve = 0.704), with balanced sensitivity and specificity, and consistently outperformed other models across CKM stages. Model calibration was evaluated in the independent test set using calibration curves, demonstrating generally consistent agreement between predicted and observed CVD risk across CKM stages, with modest deviations at higher predicted risk levels. SHAP analysis identified age, systolic blood pressure, triglycerides, waist circumference, and C-reactive protein as key contributors to CVD risk prediction, revealing distinct stage-specific importance patterns and non-linear associations.
Conclusions
This interpretable ML framework provides a stage-specific CVD risk stratification approach across the CKM spectrum and may inform future risk assessment research in middle-aged and older Chinese adults. However, external validation and clinical utility evaluation are required before clinical translation.
Keywords
Introduction
Cardiovascular–kidney–metabolic (CKM) syndrome is a complex multisystem disorder defined by pathophysiological interactions among metabolic abnormalities, chronic kidney disease (CKD), and cardiovascular dysfunction.1,2 These interrelated mechanisms contribute to multiorgan damage and substantially increase the risk of adverse cardiovascular outcomes. To address this complexity, the American Heart Association recently introduced CKM syndrome as a unified framework for clinical management and risk stratification, advocating for integrated care rather than isolated treatment of individual conditions. 3
Globally, CKM syndrome has reached epidemic levels, with particularly concerning trends in China driven by rapid socioeconomic development, urbanization, and shifts in lifestyle patterns.4,5 Data from the China Health and Retirement Longitudinal Study (CHARLS) indicate high prevalence rates of hypertension (29.1%), diabetes (13.2%), and CKD (11.5%) among adults aged ≥45 years.6–8 These conditions often co-occur and act synergistically, resulting in a substantial cardiovascular burden that exceeds the impact of any single disease entity.
The CKM staging system (Stages 0–4) provides a clinically actionable framework for stratifying cardiovascular risk.3,9 Stages 0–3 represent a critical window for prevention, as individuals at these stages have not yet developed established cardiovascular disease (CVD) but exhibit progressively elevated risk profiles. Prior studies have shown that CVD risk increases markedly with advancing CKM stage,10,11 highlighting the need for accurate, stage-specific risk prediction tools to support targeted prevention and management.
However, existing cardiovascular risk prediction tools have notable limitations in the CKM context. Conventional models—such as the Framingham Risk Score and SCORE—were primarily developed in Western populations and rely on simplified, largely linear risk formulations, which may inadequately capture the complex interactions among metabolic, renal, and cardiovascular systems.12,13 External validations have also demonstrated substantial miscalibration when these tools are transported to Chinese populations (e.g. the Framingham Wilson model reported markedly low observed-to-expected ratios of 0.27 in men and 0.50 in women), with China-PAR showing comparatively better calibration in pooled analyses than some imported tools (e.g. Framingham Wilson and PCE), although performance varied across validation settings. 14 In addition, widely used CVD risk scores generally do not incorporate kidney function measures (e.g. eGFR or albuminuria) and tend to underestimate cardiovascular risk among individuals with CKD, 15 limiting their ability to capture CKM-specific risk heterogeneity. Moreover, these tools typically apply a uniform prediction strategy across heterogeneous risk states, without accounting for CKM stage-specific pathophysiology, and have limited validation across distinct CKM stages.
Machine learning (ML) methods offer a promising alternative, as they can model complex, non-linear associations among multiple risk factors.16,17 Although prior studies have shown that ML models can match or modestly outperform traditional risk scores in predicting CVD outcomes,18,19 most have focused on generic population-level prediction and treated cardiometabolic risk as a homogeneous construct. Importantly, few ML-based studies have explicitly incorporated CKM staging or examined whether predictive features and risk patterns differ meaningfully across CKM stages, particularly in Chinese (East Asian) populations. Given the substantial heterogeneity in cardiovascular risk profiles across Asian ethnicities (e.g. South Asian vs. East Asian), evidence derived from Chinese cohorts should not be assumed to generalize to all Asian populations without external validation. To justify the additional flexibility of ML, we included logistic regression (LR) as an interpretable baseline regression comparator to quantify the incremental value of more flexible ML algorithms.
In addition, the limited interpretability of many ML models poses a major barrier to clinical adoption. The “black box” nature of these algorithms constrains clinicians’ ability to understand stage-specific risk drivers or to translate predictions into actionable preventive strategies. The SHapley Additive exPlanations (SHAP) framework has emerged as a robust solution to this challenge, providing transparent, individualized feature attributions (i.e. the contribution of each variable) to model predictions.20,21 Despite its potential relevance, SHAP has rarely been applied to characterize stage-specific cardiovascular risk profiles within the CKM framework, leaving an important methodological and clinical gap.
To address these gaps, we developed and validated ML models for CVD risk prediction across CKM stages 0–3 using data from the CHARLS cohort. We systematically evaluated the performance of five ML algorithms across the full CKM spectrum, as well as within early-stage (Stages 0–2) and advanced-stage (Stage 3) subgroups. By integrating SHAP analysis, we further characterized shared and stage-specific risk factors and elucidated stage-dependent, non-linear risk patterns. Given the demographic characteristics of the cohort, our findings are most directly applicable to middle-aged and older Chinese adults and should be interpreted within this context. Future studies should externally validate and recalibrate the proposed framework in other Asian ethnicities and regions before extending its clinical use beyond Chinese populations. This stage-stratified, interpretable ML framework moves beyond generic risk prediction by explicitly accounting for CKM-related heterogeneity and offers data-driven insights to inform future risk stratification and prevention strategies across the CKM continuum.
Methods
Data source and study population
This study utilized data from the CHARLS, a nationally representative cohort of Chinese adults aged ≥45 years. Participants were selected through a stratified multistage probability sampling process across 150 county-level units in 28 provinces. Data collection encompassed demographic characteristics, health status, behavioral factors, and biomarkers, obtained through standardized questionnaires administered via face-to-face interviews. The study design and methodology of CHARLS have been thoroughly described in prior publications. 22 All participants provided written informed consent before enrollment, and the study was approved by the Institutional Review Board of Peking University (IRB00001052-11015). The present analysis included data from the baseline survey (2011–2012) and three follow-up waves conducted in 2013 (Wave 2), 2015 (Wave 3), and 2018 (Wave 4). The CHARLS datasets are publicly available, and the authors obtained formal permission to use the data through the official CHARLS data access application process in accordance with the data use agreement.
As illustrated in the study flowchart (Figure 1), we applied specific inclusion and exclusion criteria to define our analytical sample. From the initial CHARLS cohort, we excluded participants who were: (a) younger than 45 years at baseline (n = 774), (b) missing laboratory values critical for CKM classification (n = 7811), (c) had prevalent CVD at baseline (n = 1446), or (d) had incomplete follow-up data for CVD (n = 1625). After applying these criteria, 6049 participants remained eligible for the final analysis.

The overall flowchart of the study.
To assess potential selection bias introduced by the exclusion of participants with missing laboratory data required for CKM classification, baseline characteristics of included and excluded participants were compared, with results presented in Supplementary Table 1. Specifically, we compared age, waist circumference, sex, residence, marital status, education, smoking status, and drinking status between the included (n = 6049) and excluded (n = 7811) groups using t-tests (continuous variables) and chi-square tests (categorical variables). In addition, we reported standardized mean differences (SMDs) to quantify the magnitude of imbalance between groups, because p-values can be sensitive to large sample sizes; SMD > 0.10 was considered indicative of potentially meaningful differences.
Definition and operationalization of cardiovascular–kidney–metabolic stages
We implemented the American Heart Association's framework for CKM syndrome, 1 categorizing participants into four progressive stages. Stage 0 represented the absence of all CKM risk factors. Stage 1 was defined by excess adiposity (body mass index [BMI] ≥ 23 kg/m2; waist circumference ≥80 cm for women, ≥90 cm for men) without metabolic complications (hypertension, dyslipidemia, diabetes, CKD). Stage 2 included participants with one or more metabolic abnormalities (hypertension, hypertriglyceridemia ≥150 mg/dL, metabolic syndrome, diabetes) or CKD (estimated glomerular filtration rate [eGFR] < 60 mL/min/1.73m2). Stage 3 encompassed individuals with subclinical CVD or equivalent risk factors (very high-risk CKD [stage G4/G5] or high Framingham 10-year CVD risk).23,24 The eGFR was calculated using the Chinese Modification of Diet in Renal Disease equation, 25 and CKD was staged according to the Kidney Disease Improving Global Outcomes guidelines. 26
When participants met criteria for multiple CKM stages, stage assignment followed a hierarchical rule consistent with the American Heart Association CKM framework, whereby individuals were classified into the highest applicable stage to reflect the most advanced disease state. Specifically, participants meeting criteria for stage 3 (e.g. very high-risk CKD or high Framingham 10-year CVD risk) were assigned to stage 3 regardless of concurrent metabolic abnormalities or earlier stage features. Similarly, individuals meeting criteria for stage 2 were assigned to stage 2 even if criteria for stage 1 were also present. This hierarchical approach ensured mutually exclusive stage categorization and minimized ambiguity arising from overlapping CKM-related conditions.
Cardiovascular disease diagnosis
The primary outcome was incident CVD occurring between Wave 2 (2013) and Wave 4 (2018) of the follow-up period. Consistent with approaches widely used in prior CHARLS-based studies,11,27,28 CVD events were identified through standardized self-reported questionnaires. Participants were asked two key questions: “Have you been told by a doctor that you have been diagnosed with a heart attack, coronary heart disease, angina, congestive heart failure, or other heart problems?” and “Have you been told by a doctor that you have been diagnosed with a stroke?” Individuals who responded affirmatively to either question at any follow-up wave were classified as having developed incident CVD. In the publicly available CHARLS dataset used in this study, incident CVD outcomes are ascertained via self-reported physician diagnosis and do not include adjudicated medical-record verification or registry linkage; therefore, an internal validation analysis of self-reported incident CVD against adjudicated records was not feasible within our dataset. To contextualize potential misclassification, prior CHARLS validation studies for self-reported physician-diagnosed chronic conditions (e.g. diabetes and hypertension) against biomedical measurements generally report high specificity but only modest sensitivity, suggesting under-ascertainment.29,30 External validation evidence from Asian adults comparing self-reported CVD with registry/adjudicated diagnoses similarly indicates high specificity with moderate sensitivity. 31
Data preprocessing and feature selection
Prior to model development, the full dataset was first split into a training set (70%) and an independent test set (30%) using stratified random sampling to preserve the outcome distribution. The test set was held out from all model development procedures and was not used to estimate any preprocessing parameters. All subsequent data preprocessing, feature selection, hyperparameter tuning, and model optimization steps were performed exclusively within the training set to prevent information leakage and optimistic bias.
Variable selection was informed by clinical expertise and existing literature on risk factors associated with CKM syndrome. Selected variables were organized into key domains. Sociodemographic factors included age, gender, residence (urban/rural), marital status (married, single/divorced/widowed), and education (elementary school or below, middle school or above). Lifestyle and behavioral factors encompassed sleep patterns including nighttime sleep duration (categorized as <6 h, 6–8 h, >8 h) and daytime nap duration (no nap, short nap <30 min, moderate nap 30–90 min, long nap >90 min). Smoking status was classified as non-smoker or smoker, while alcohol consumption was categorized as non-drinker or drinker. Physical activity was measured using the International Physical Activity Questionnaire, with activity levels quantified using metabolic equivalent (MET) coefficients (vigorous exercise × 8.0 + moderate exercise × 4.0 + walking × 3.3)32,33 and participants subsequently grouped into MET categories for analysis. Anthropometric measurements comprised BMI, waist circumference, and hand grip strength measured using a dynamometer. Blood pressure parameters included systolic blood pressure (SBP) and diastolic blood pressure (DBP), measured three times using an Omron HEM-7200 Monitor after a 30-min abstinence from smoking, exercise, alcohol, and food, with final values calculated as the average of three readings. Cognitive function was assessed using the Mini-Mental State Examination, a validated instrument for evaluating cognitive status. 34 Laboratory indices were comprehensive, including complete blood count (white blood cell count, hemoglobin, platelet count), glycemic markers (glycated hemoglobin [HbA1c], fasting glucose), lipid profile (triglycerides, high-density lipoprotein cholesterol, low-density lipoprotein cholesterol, calculated remnant cholesterol [RC]), renal function indicators (blood urea nitrogen, creatinine, eGFR, cystatin C), inflammatory markers (C-reactive protein [CRP]), and other biochemical indices such as uric acid. Chest pain was assessed using standardized self-reported questionnaires to evaluate cardiovascular discomfort. Psychological assessment was conducted using the Center for Epidemiologic Studies Depression Scale, with scores ≥10 classified as clinically significant depression. 35 Finally, we incorporated comorbidities including liver disease, kidney disease, digestive disease, arthritis or rheumatism, cancer, lung disease, asthma, psychiatric problems, and sensory impairments (eyesight and hearing conditions).
After data splitting, preprocessing procedures were performed within the training set only to ensure strict separation between model development and evaluation. Variables with more than 30% missing data were excluded to avoid excessive imputation-related uncertainty. For continuous variables with partial missingness, missing values were imputed using the K-Nearest Neighbors (KNN) method (n_neighbors = 5), selected for its ability to preserve multivariate relationships among predictors and its demonstrated robustness in epidemiologic datasets with moderate missingness. 36 To prevent information leakage during model tuning, KNN imputation was embedded within the fivefold cross-validation procedure using a sklearn Pipeline, such that the imputer was fitted only on each training fold and then applied to the corresponding validation fold. After hyperparameter tuning, the final imputer and model were refit on the full training set and subsequently applied to the independent test set for performance evaluation. Mode imputation was applied for categorical variables to retain original category structure without introducing artificial levels. 37 Outliers were detected using the interquartile range (IQR) method, defined as values below Q1 − 1.5 × IQR or above Q3 + 1.5 × IQR, and winsorization was applied to reduce the influence of extreme values while preserving sample size and biologically plausible variability, particularly relevant in aging populations.
Feature selection was conducted exclusively within the training dataset using a comprehensive strategy integrating two complementary methods implemented in parallel. The Boruta algorithm—a random forest (RF)-based wrapper technique—was executed over 20 iterations to ensure stability, identifying features with importance significantly exceeding that of randomly permuted “shadow features.” 38 Concurrently, Recursive Feature Elimination (RFE) with internal fivefold cross-validation was performed within the training set, using the area under the receiver operating characteristic curve (AUROC) as the performance criterion to evaluate predictive performance at each step of feature elimination. 39
By integrating results from Boruta and RFE, we identified 11 predictors that demonstrated stable and consistent predictive value for incident CVD. These features were subsequently fixed and carried forward into all model development and evaluation procedures, including training and testing across different CKM stages: age, eGFR, RC, triglyceride, platelet count, DBP, SBP, waist circumference, BMI, hand grip strength, and CRP.
Machine learning algorithms
In this study, we applied stratified random sampling to divide the dataset into a training set (70%) and a test set (30%). The training set was used to develop ML models, while the test set was reserved solely for evaluating model performance. Five ML algorithms were constructed—LR, RF, Extreme Gradient Boosting (XGBoost), Light Gradient Boosting Machine (LightGBM), and Multilayer Perceptron (MLP)—based on the 11 most predictive features identified through feature selection. Models were developed separately for three patient cohorts: the full CKM population (Stages 0–3), early-stage CKM (Stages 0–2), and advanced-stage CKM (Stage 3). All models were implemented using scikit-learn and relevant Python libraries. To address class imbalance, class weighting strategies were applied, with weights calculated as the ratio of negative to positive samples. 40
Hyperparameter tuning was conducted using grid search with fivefold stratified cross-validation to systematically explore predefined parameter spaces while minimizing the risk of overfitting. 41 The F1 score was selected as the primary optimization metric, given its balanced integration of precision and recall—an essential consideration in clinical prediction models. 42 The resulting optimal configurations included: LR with elastic net regularization 43 ; RF with increased tree depth and class weighting; XGBoost with controlled tree depth and regularization to mitigate overfitting; LightGBM with tuned leaf count and regularization parameters; and MLP with an adaptive learning rate and early stopping criteria.
Model performance was assessed using multiple evaluation metrics, including accuracy, precision, recall, specificity, F1 score, and AUROC. Final performance was evaluated on a held-out test set comprising 30% of the original dataset, stratified to preserve the original class distribution and ensure robust performance estimates across both majority and minority classes.
In addition to discrimination metrics, model calibration was assessed in the independent test set to evaluate the agreement between predicted probabilities and observed event rates. Calibration performance was examined using calibration curves, and stage-stratified calibration analyses were conducted for all CKM stages combined (stages 0–3), early-stage CKM (stages 0–2), and advanced-stage CKM (stage 3) to assess stage-specific calibration characteristics.
SHapley Additive exPlanations interpretability analysis
To enhance the interpretability of ML models, we conducted SHAP analysis on the best-performing algorithm. SHAP provides a unified framework for interpreting model predictions by quantifying the marginal contribution of each feature to the model's output. We utilized the TreeExplainer algorithm, specifically designed for tree-based models, to compute SHAP values. Positive SHAP values indicate that a feature increases the predicted probability of CVD, while negative values suggest a protective effect. Because some predictors represent overlapping cardiometabolic constructs (e.g. BMI and waist circumference as adiposity measures), multicollinearity can lead to attribution-sharing in SHAP, whereby importance may be redistributed across correlated features. Accordingly, SHAP-based interpretations in this study emphasize the overall contribution of correlated feature domains (e.g. adiposity) rather than definitive conclusions about the relative importance of one highly correlated anthropometric metric over another.
To visualize and interpret the results, we employed three complementary approaches. First, summary plots were generated to illustrate the distribution and relative importance of each feature across the test dataset. Second, partial dependence plots were constructed using locally weighted scatterplot smoothing to capture non-linear relationships between individual feature values and their corresponding SHAP values. Third, force plots were used to decompose individual-level predictions, providing a visual representation of how each feature influenced the deviation from the model's baseline output.
Statistical analysis
Continuous variables were summarized as mean ± standard deviation or median with IQR, depending on data distribution. Group comparisons were conducted using Student's t-test for normally distributed data and the Wilcoxon rank-sum test for non-normally distributed data. Categorical variables were reported as frequencies and percentages, with group differences assessed using the chi-square test or Fisher's exact test when expected cell counts were small. To compare discriminative performance between models, we employed DeLong tests to assess whether differences in AUROC values were statistically significant. The DeLong test is a nonparametric approach specifically designed for comparing correlated ROC curves derived from the same study population. A two-sided p-value <0.05 was considered statistically significant. All statistical analyses were performed using R (version 4.4.2; R Foundation for Statistical Computing, Vienna, Austria) and Python (version 3.12.9), incorporating the scikit-learn, pandas, and statsmodels libraries for ML and statistical procedures.
Results
Patient characteristics
A total of 6049 participants were included in this study, with 1373 (22.7%) participants developing CVD during the follow-up period. The mean age was 58.3 ± 8.8 years, with 53.8% female participants. As shown in Table 1, CVD participants were significantly older, more commonly female, and had poorer lifestyle metrics including shorter sleep duration and lower physical activity levels compared to the non-CVD group (all p < 0.01). Participants with CVD exhibited unfavorable clinical parameters, including higher BMI, waist circumference, blood pressure, and adverse metabolic and inflammatory profiles (all p < 0.01). The prevalence of comorbidities was also significantly higher in the CVD group, particularly depression (81.6% vs. 75.6%, p < 0.001) and respiratory conditions (p < 0.001).
Baseline characteristics of included participants stratified by CVD status.

*p-values were calculated using Student's t-test for continuous variables and Chi-square test for categorical variables.
Abbreviations: CVD: cardiovascular disease; SD: standard deviation; MET: metabolic equivalent; BMI: body mass index; SBP: systolic blood pressure; DBP: diastolic blood pressure; MMSE: Mini-Mental State Examination; WBC: white blood cell; HbA1c: glycated hemoglobin A1c; HDL-C: high-density lipoprotein cholesterol; LDL-C: low-density lipoprotein cholesterol; RC: remnant cholesterol; BUN: blood urea nitrogen; eGFR: estimated glomerular filtration rate; CRP: C-reactive protein; CKM: cardiovascular–kidney–metabolic.
When stratified by baseline CKM stage, the cumulative incidence of incident CVD during follow-up increased monotonically with advancing CKM severity, ranging from 11.9% in Stage 0 to 24.4% in Stage 3. This pattern underscores the prognostic relevance of baseline CKM staging for subsequent CVD risk, rather than reflecting cross-sectional disease prevalence (p < 0.001).
Feature selection results
Feature selection was performed on the training dataset using a combined approach of Boruta algorithm and RFE. This process identified 11 optimal predictors for CVD risk: age, eGFR, RC, triglyceride, platelet, DBP, SBP, waist circumference, BMI, hand grip strength, and CRP (Figure 2). Analyses of feature importance across different CKM stages (Supplementary Figure 1 and Supplementary Figure 2) showed consistent patterns with minor ranking variations. Age and BMI maintained top positions across all CKM stages, while other key predictors—including eGFR, lipid parameters, CRP, SBP, and DBP—consistently ranked highly in both early-stage (stage 0–2) and advanced-stage (stage 3) CKM. For consistency and to enable comparative analyses, these 11 features from the complete cohort analysis were used for all subsequent ML model development.

Feature selection results for CVD risk prediction in CKM stages 0–3. (A) Sorted feature ranking distribution by Boruta algorithm. (B) Feature contribution and AUC performance with recursive feature elimination. CVD: cardiovascular disease; CKM: cardiovascular–kidney–metabolic.
Multimodel-integrated analysis for classification
Five ML models were evaluated for predicting CVD risk across the spectrum of CKM disease. As illustrated in Figure 3, in patients across all CKM stages combined (stages 0–3), the RF model demonstrated the best relative performance among the evaluated algorithms, achieving the highest AUROC of 0.750 (95% CI: 0.734–0.766) in the training set and 0.704 (95% CI: 0.673–0.734) in the test set. LightGBM achieved the second-highest performance with AUROCs of 0.703 (95% CI: 0.686–0.721) and 0.669 (95% CI: 0.638–0.700) in training and test sets, respectively, followed by XGBoost, LR, and MLP. As shown in Supplementary Table 2, the RF model exhibited balanced performance metrics with training sensitivity of 76.4%, specificity of 59.1%, and F1 score of 48.4%. While LightGBM and XGBoost showed higher specificity (85.2% and 75.4%, respectively), their substantially lower sensitivity values (35.2% and 46.6%) compromised their clinical utility. Despite high accuracy (76.7%) and specificity (98.5%), the MLP model's negligible sensitivity (2.7%) rendered it unsuitable for clinical implementation. Notably, although the RF model achieved the most balanced trade-off between sensitivity and specificity, the overall discriminative performance remained moderate, particularly in early-stage CKM patients, underscoring its role in risk stratification rather than definitive clinical decision-making.

Receiver operating characteristic (ROC) curves for CVD risk prediction across CKM stages using five machine learning models. ROC curves with area under the curve (AUC) and 95% confidence intervals (CI) for Logistic Regression (LR), Random Forest (RF), Multilayer Perceptron (MLP), Extreme Gradient Boosting (XGBoost), and Light Gradient Boosting Machine (GBM) models. (A) All CKM stages (0–3) training set. (B) Early-stage CKM (stages 0–2) training set. (C) Advanced-stage CKM (stage 3) training set. (D) All CKM stages (0–3) test set. (E) Early-stage CKM (stages 0–2) test set. (F) Advanced-stage CKM (stage 3) test set. CVD: cardiovascular disease; CKM: cardiovascular–kidney–metabolic.
In early-stage CKM (stages 0–2) patients, the RF model maintained superior discriminative ability with the highest AUROCs in both training (0.756, 95% CI: 0.728–0.782) and test sets (0.712, 95% CI: 0.672–0.754). Notably, the XGBoost model demonstrated comparable performance with AUROCs of 0.746 and 0.704 in training and test sets, respectively, suggesting particular efficacy in early-stage disease prediction. RF maintained better balance across metrics with F1 scores of 46.8% (training) and 41.6% (test). Despite relatively stable AUROC values, the modest F1 scores observed in early-stage CKM highlight the inherent difficulty of predicting incident CVD in lower risk populations and suggest that these models should complement, rather than replace, existing clinical assessment strategies.
For advanced-stage (CKM stage 3) patients, the RF model maintained its discriminative superiority with the highest AUROCs in both training (0.783, 95% CI: 0.763–0.804) and test sets (0.737, 95% CI: 0.708–0.767). A key finding was the markedly improved sensitivity across models in stage 3 patients compared to early-stage disease, with RF achieving 80.7% sensitivity in the training set and 75.3% in the test set. The RF model also demonstrated optimal metric balance with the highest F1 scores in both training (51.8%) and test sets (50.1%).
To formally assess whether the RF model's performance advantage justifies its greater complexity compared to the interpretable LR baseline, we conducted DeLong tests comparing AUROC values between these two models (Supplementary Table 3). RF demonstrated highly statistically significant superiority over LR across all CKM stages (all p < 0.001). In the overall cohort (stages 0–3), RF significantly outperformed LR (AUROC: 0.704 vs. 0.604, absolute difference = + 0.100, representing a 16.6% relative improvement, DeLong p < 0.001). This pattern of substantial superiority was consistent in early-stage CKM (RF: 0.712 vs. LR: 0.577, difference = + 0.135, 23.4% relative improvement, p < 0.001) and advanced-stage CKM (RF: 0.737 vs. LR: 0.626, difference = + 0.111, 17.7% relative improvement, p < 0.001). These substantial, consistent, and highly statistically significant performance gains strongly support the use of the more flexible ML approach across the full CKM spectrum.
Calibration performance was evaluated in the independent test set using observed vs. predicted risk plots, with stage-stratified calibration curves generated for all CKM stages combined (stages 0–3), early-stage CKM (stages 0–2), and advanced-stage CKM (stage 3) (Supplementary Figure 3). Overall, calibration curves demonstrated generally acceptable agreement between predicted probabilities and observed event rates in the low-to-moderate risk range, whereas deviations became more evident at higher predicted risk levels, particularly in CKM stage 3 where estimates are less stable in the extreme probability bins. Brier scores (95% CI) are reported in the figure legend: in the overall cohort (stages 0–3), the RF model yielded a Brier score of 0.242 (0.237–0.247) compared with 0.264 (0.259–0.269) for LR; in early-stage CKM (stages 0–2), RF achieved 0.221 (0.215–0.226) versus 0.248 (0.242–0.254) for LR; and in advanced-stage CKM (stage 3), RF achieved 0.231 (0.224–0.238) versus 0.270 (0.263–0.277) for LR. These findings indicate broadly reliable probability estimates for risk stratification while suggesting that external validation and potential recalibration may be needed before using high-risk probability thresholds in practice.
Interestingly, all models demonstrated higher apparent discriminative performance in stage 3 patients compared to early CKM stages. However, this pattern is likely attributable, at least in part, to the higher baseline event rates and more pronounced gradients of cardiometabolic and inflammatory risk factors in advanced CKM, which enhance separability between individuals with and without incident CVD, rather than reflecting inherent superiority of model performance in advanced disease. In contrast, the more modest discrimination observed in early-stage CKM underscores the intrinsic difficulty of predicting incident CVD in lower risk populations with subtler risk factor variation. Within this context, the consistently favorable balance between sensitivity and specificity achieved by the RF model across CKM stages supported its selection as the optimal model for subsequent interpretability analyses.
Interpretability analysis of the random forest model based on SHapley Additive exPlanations
We employed SHAP analysis to interpret the RF model's CVD risk predictions across different CKM stages. In the overall cohort, age emerged as the most influential predictor, followed by SBP and triglyceride levels (Figure 4A). Adiposity-related features (BMI and waist circumference) also contributed prominently to prediction in the overall cohort. Given the strong correlation between BMI and waist circumference, their SHAP attributions should be interpreted as reflecting the importance of adiposity as a shared domain, and the relative ordering between these two measures should not be over-interpreted. The quantitative feature importance ranking confirmed this hierarchy, with age demonstrating the highest mean SHAP value (Figure 4B). The force plot demonstrated how elevated age (62.0 years), SBP (147.33 mmHg), DBP (90.33 mmHg), and reduced hand grip strength (22.0 kg) contributed positively to CVD risk in a representative patient (base value: 0.54, predicted risk: 0.60), while normal eGFR (104.66 mL/min/1.73 m2), platelet count (140.0 × 10⁹/L), low CRP (0.45 mg/L), and RC (0.25 mg/dL) conferred protection (Figure 4C). Importantly, beyond reaffirming established predictors (e.g. age and SBP), the SHAP dependence plots elucidated non-linear, threshold-dependent relationships that a standard linear model would not capture unless explicitly specified (Figure 4D). BMI showed a clear threshold-like pattern, with SHAP values remaining relatively flat at lower BMI levels and increasing more steeply around the overweight range (approximately 25 kg/m2) in the overall cohort. SBP exhibited a non-linear escalation, with risk contribution increasing disproportionately once SBP exceeded a mid-range level, consistent with a threshold effect rather than a constant linear slope. eGFR demonstrated a non-linear pattern with risk attribution changing more sharply as renal function declined, indicating that the marginal impact of kidney function is not constant across its distribution. In addition, several biomarkers displayed saturation/diminishing-return behaviors, where SHAP values rose rapidly at lower ranges and then plateaued (e.g. triglycerides/RC/CRP), highlighting non-constant marginal effects across the predictor spectrum. These “risk-shape” patterns provide added interpretability value beyond feature ranking and support the use of flexible ML to model heterogeneous CKM physiology. Hand grip strength inversely correlated with CVD risk, particularly at values below 25 kg.
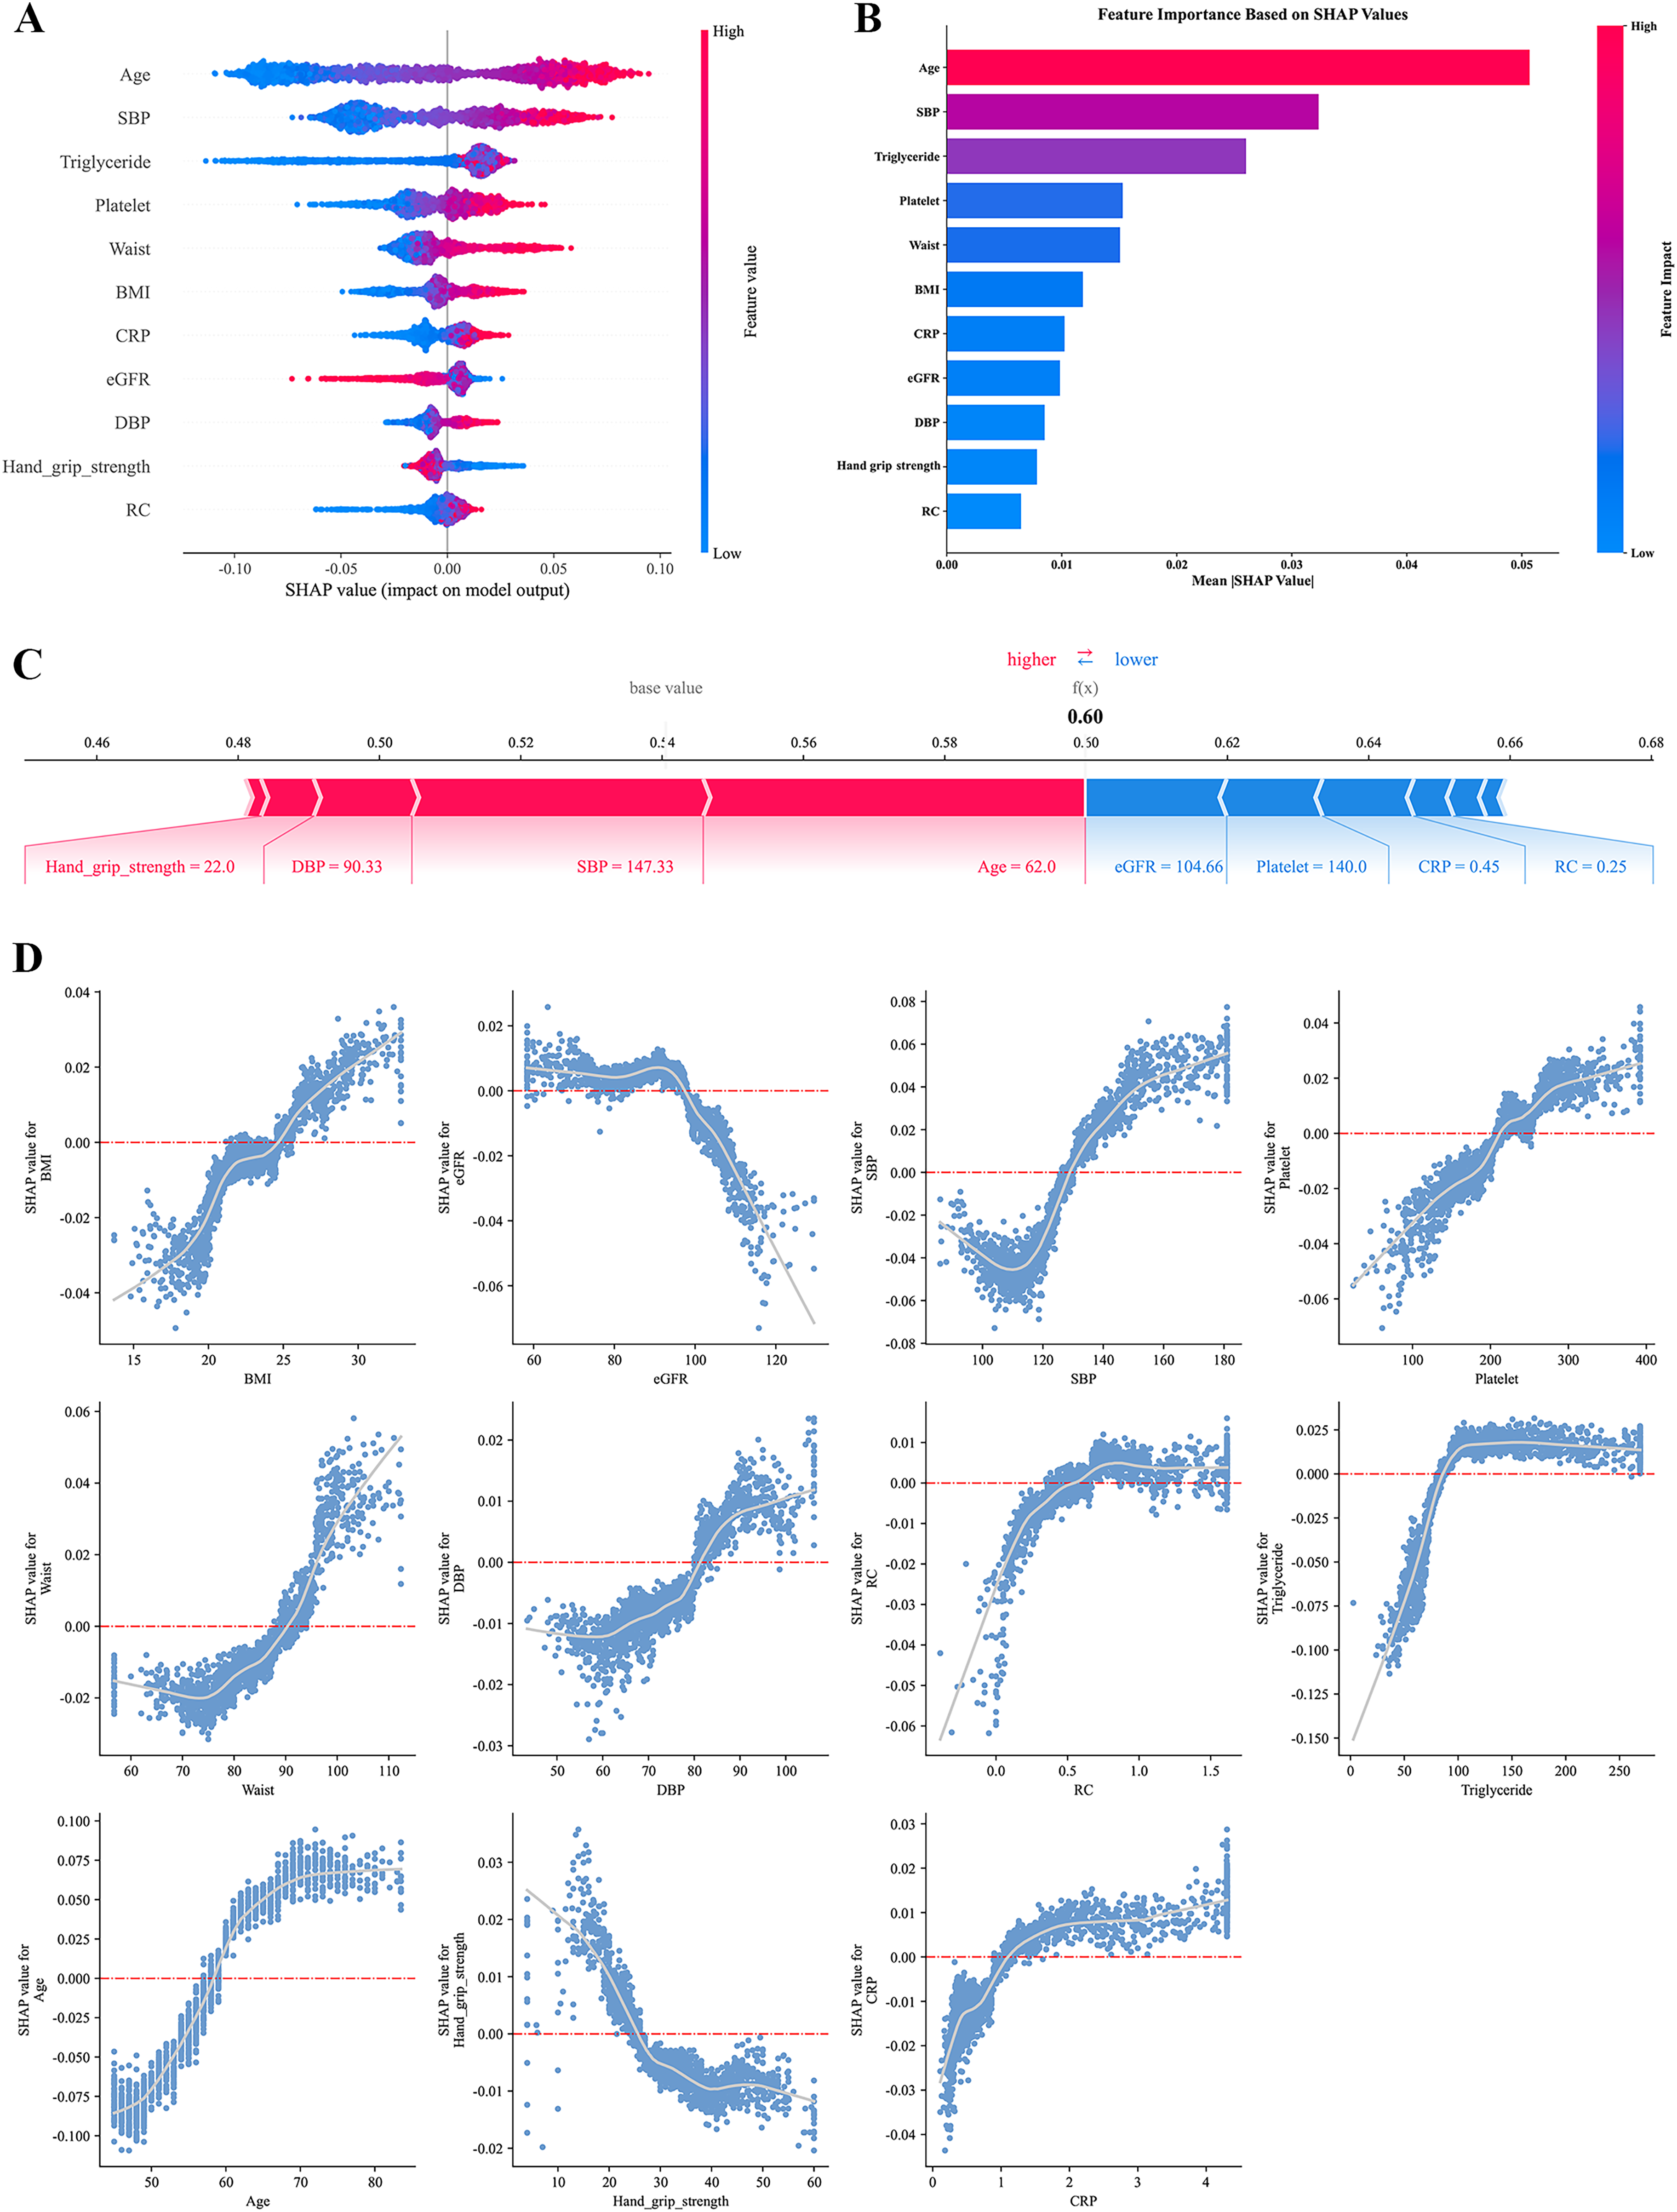
SHAP interpretation of the random forest model for CVD risk prediction in CKM stages 0–3. (A) Summary plot of SHAP values. Each row represents a feature, and each point denotes an individual sample. The x-axis indicates SHAP values (impact on model output), with positive values increasing and negative values decreasing CVD risk prediction. Red and blue points represent high and low feature values, respectively. (B) Feature importance ranked by mean absolute SHAP values. (C) Force plot for individualized prediction in a representative patient (base value = 0.54, predicted CVD risk = 0.60). Red bars indicate risk-enhancing features; blue bars indicate protective features. Bar length reflects the magnitude of contribution. (D) SHAP dependence plots showing non-linear associations between selected features (x-axis) and their SHAP values (y-axis). CVD: cardiovascular disease; CKM: cardiovascular–kidney–metabolic; SHAP: SHapley Additive exPlanations.
In early-stage CKM (stages 0–2) patients, distinctive risk prediction patterns emerged (Figure 5). While age and SBP remained the predominant predictor, waist circumference gained relative importance compared to triglycerides. Notably, hand grip strength demonstrated higher relative importance in this subgroup than in the overall cohort. The force plot clearly demonstrated that for this representative patient (base value: 0.508, predicted CVD risk: 0.57), elevated SBP (141.33 mmHg), increased age (60.0 years), and reduced hand grip strength (15.0 kg) were the primary contributing factors to CVD risk, while platelet count (157.0 × 10⁹/L), CRP level (0.63 mg/L), waist circumference (84.0 cm), and RC (0.92 mg/dL) within normal ranges exhibited protective effects. Analysis of threshold effects specific to early-stage disease revealed that BMI risk began to increase at lower values (23 kg/m2) and SBP risk elevated at lower thresholds (125 mmHg) compared to those observed in the overall CKM patient population.

SHAP interpretation of the random forest model for CVD risk prediction in early-stage CKM patients (stages 0–2). (A) Summary plot of SHAP values. Each row represents a feature, and each point denotes an individual sample. The x-axis indicates SHAP values, with positive values increasing and negative values decreasing predicted CVD risk. Feature values are color-coded (red: high; blue: low). (B) Feature importance ranked by mean absolute SHAP values. (C) Force plot for individualized prediction in a representative patient (base value = 0.508, predicted CVD risk = 0.57). Red bars indicate features contributing to higher risk; blue bars represent protective effects. (D) SHAP dependence plots illustrating non-linear and threshold effects of key predictors on CVD risk in early-stage CKM patients. CVD: cardiovascular disease; CKM: cardiovascular–kidney–metabolic; SHAP: SHapley Additive exPlanations.
Advanced-stage CKM (stage 3) patients exhibited distinct risk patterns (Figure 6). Age remained the predominant factor, followed by waist circumference and SBP in relative importance. CRP demonstrated heightened relative importance compared to early-stage disease. The force plot highlighted the substantial contribution of elevated CRP (2.63 mg/L) and increased platelet count (308.0 × 10⁹/L) to CVD risk, while younger age (53.0 years) and normal clinical parameters conferred protection. Threshold effects in advanced-stage disease aligned with established clinical parameters, with risk inflection points occurring at BMI of 25 kg/m2 and SBP of 140 mmHg. CRP level exhibited a pronounced positive correlation with CVD risk in this advanced subgroup.

SHAP interpretation of the random forest model for CVD risk prediction in advanced-stage CKM patients (stage 3). (A) Summary plot of SHAP values across features and individual samples. The x-axis indicates SHAP values, reflecting each feature's influence on predicted CVD risk. Red points indicate higher feature values; blue points indicate lower values. (B) Feature importance ranked by mean absolute SHAP values. (C) Force plot for a representative patient (base value = 0.565, predicted CVD risk = 0.45). Red bars indicate features increasing risk; blue bars represent protective effects. (D) SHAP dependence plots showing associations between key feature values (x-axis) and their corresponding SHAP values (y-axis). CVD: cardiovascular disease; CKM: cardiovascular–kidney–metabolic; SHAP: SHapley Additive exPlanations.
Discussion
In this study investigating CVD risk prediction across CKM stages, the RF model outperformed other ML algorithms, demonstrating the highest overall predictive performance. Notably, model accuracy improved with advancing CKM stages, with all models exhibiting superior discriminative ability in stage 3 compared to earlier stages. Among the five evaluated algorithms, the RF model consistently achieved the best balance between sensitivity and specificity, underscoring its potential utility for population-level risk stratification and early risk identification, rather than immediate clinical deployment. Although the RF model demonstrated stable discrimination and acceptable calibration across CKM stages, the overall predictive performance remained moderate. These findings support the use of the proposed framework for risk stratification and hypothesis generation rather than immediate clinical deployment.
DeLong tests showed that RF significantly outperformed LR across all CKM subgroups (all p < 0.001), yielding meaningful AUROC gains of +0.100 to +0.135 (16.6%–23.4% relative improvement). Beyond statistical significance, RF provided a more clinically useful sensitivity–specificity balance (67.0%/60.8% vs. LR 71.9%/43.5%) and better captured non-linear, threshold effects; integrating SHAP further addressed interpretability by providing transparent, stage-specific feature attributions, supporting RF as the preferred model in the heterogeneous CKM setting.
SHAP analysis provided interpretable insights into both shared and stage-specific CVD risk profiles. Age, SBP, and triglyceride levels emerged as dominant predictors across all CKM stages. However, earlier stages (CKM 0–2) were characterized by anthropometric and functional indicators—particularly waist circumference and hand grip strength—with SHAP-derived inflection points that appeared below traditional clinical cutoffs. In contrast, stage 3 was defined by a risk signature dominated by inflammatory markers such as CRP, with threshold effects more closely aligned with conventional clinical parameters.
These findings highlight the dynamic progression of CVD risk across the CKM continuum and suggest that preventive strategies should be tailored to the risk profile of each stage. The identification of distinct stage-specific risk factors through SHAP analysis underscores the importance of model interpretability for guiding personalized preventive strategies in clinical practice.
Our findings expand on previous literature by demonstrating the value of ML-based approaches for CVD risk prediction within the CKM framework. Conventional risk models such as the Framingham Risk Score and SCORE have shown moderate discriminatory power, with AUROCs typically ranging from 0.70 to 0.75.44,45 The RF model achieved comparable performance while leveraging its ability to model complex, non-linear interactions without relying on pre-specified assumptions, consistent with recent studies indicating that ML methods can match or exceed traditional risk prediction tools. 18 However, we did not perform a direct head-to-head comparison or recalibration of conventional risk scores (e.g. Framingham or SCORE) within CHARLS; therefore, these comparisons should be interpreted as descriptive rather than inferential and do not imply superiority.
Importantly, unlike conventional models that adopt a uniform prediction strategy irrespective of metabolic status,16,46 our stage-specific approach captures the heterogeneity across CKM stages, enabling more precise stratification of CVD risk. The observed improvement in predictive performance with disease progression aligns with prior research showing greater discriminative accuracy in high-risk populations, 12 likely reflecting the increased clarity and intensity of pathophysiological signals in more advanced CKM stages. 47
SHAP analysis corroborated established pathophysiological mechanisms while offering new insights into stage-specific risk patterns. While age and SBP were consistent predictors across all stages, 48 central adiposity and reduced muscle strength were more predictive in earlier stages, supporting emerging evidence that these features may precede overt metabolic dysfunction.49,50 Notably, BMI and waist circumference are correlated measures capturing overlapping aspects of adiposity; therefore, SHAP values may be distributed across these features rather than uniquely attributable to one metric. Accordingly, we interpret the interpretability results as supporting the importance of adiposity-related domains in early-stage CKM, while avoiding definitive statements that BMI is more important than waist circumference (or vice versa). The predominance of inflammatory markers in later stages aligns with their recognized role in mediating metabolic-cardiovascular interactions.51,52 Furthermore, SHAP-based dependence patterns suggested that CVD risk may begin to increase at values below traditional clinical cutoffs for BMI and SBP in early-stage CKM. 53 These inflection patterns are exploratory and should be interpreted as hypothesis-generating; formal evaluation of alternative thresholds, false-positive implications, and net benefit (e.g. decision-curve analysis) is required before translating them into screening or prevention recommendations. Importantly, SHAP-derived effects describe model-based associations for prediction and do not imply that the corresponding features are causal drivers or intervention targets.
These stage-specific patterns primarily indicate differences in predictive markers across CKM stages, rather than confirming causal targets for intervention. In early-stage CKM, central adiposity (e.g. waist circumference) and functional status (e.g. hand grip strength) emerged as prominent predictors, suggesting that simple anthropometric and functional assessments may be useful for risk stratification and early identification before metabolic abnormalities are detected
This study presents several important strengths. First, we utilized data from the CHARLS, a nationally representative cohort of middle-aged and older adults, which provides detailed assessments of cardiovascular, renal, and metabolic health. This resource offers a robust foundation for examining CKM syndrome in an under-represented population. Its longitudinal design and systematic follow-up further enhanced the accuracy of incident CVD outcome ascertainment.
Methodologically, we employed a comprehensive ML framework that incorporated comparative evaluation of multiple algorithms, hyperparameter optimization, and class balancing techniques. Among the models tested, the RF algorithm consistently demonstrated superior performance and robustness. Our feature selection approach—combining the Boruta algorithm with RFE—ensured the inclusion of both statistically reliable and clinically relevant predictors.
A particularly notable strength of this study is the application of SHAP analysis to characterize stage-specific contributions of CVD risk factors across the CKM continuum. SHAP's principal advantage lies in its capacity to enhance model interpretability, a critical prerequisite for clinical implementation of ML tools. 58 In this study, SHAP not only quantified the relative importance of individual predictors but also identified clinically meaningful threshold effects that varied by CKM stage. By improving transparency and interpretability, SHAP facilitates clinician engagement, supports shared decision-making, and enables the prioritization of modifiable, stage-specific risk factors for targeted intervention. At the same time, we acknowledge that SHAP attributions can be influenced by feature collinearity, and we therefore emphasize domain-level interpretation for correlated anthropometric measures such as BMI and waist circumference.
Nonetheless, several limitations warrant consideration. First, incident CVD was based on self-reported physician diagnosis, which may introduce outcome misclassification. As described in the Methods, the publicly available CHARLS data do not provide adjudicated medical-record verification or registry linkage for cardiovascular outcomes, precluding internal validation in this study. Although the questionnaire items are standardized and widely used in CHARLS-based research, this approach may lead to under-ascertainment of CVD events, particularly in rural or low-access populations. Such misclassification likely results in under-ascertainment and, if largely non-differential across CKM stages and predictors, would be expected to attenuate associations and reduce model discrimination rather than inflate performance. Future studies incorporating adjudicated outcomes, registry linkage, or repeated event confirmation are warranted to further validate and refine CKM stage-specific risk prediction. Second, a substantial proportion of participants were excluded due to missing laboratory values required for CKM classification (n = 7,811, exceeding the final analytical sample of n = 6049), which increases the risk of selection bias and may limit external validity. Baseline comparisons (Supplementary Table S1) showed modest sociodemographic differences—particularly sex, residence, and education—which may reflect differential access to laboratory testing, while most other clinical and behavioral characteristics were broadly comparable and exhibited smaller imbalances (SMDs < 0.10). Nevertheless, the analytical sample may under-represent individuals with limited healthcare access or incomplete biomarker assessment, and model performance and stage-specific patterns may not fully generalize to the full CHARLS target population. Future work should assess robustness using missing data strategies (e.g. multiple imputation and sensitivity analyses) and validate the model in independent cohorts. Additionally, our models demonstrated moderate predictive performance, indicating room for enhancement. While calibration analyses were conducted and demonstrated broadly acceptable performance, deviations at higher predicted risk levels indicate that further refinement and external validation are required before clinical implementation. Although we used a held-out test set and conducted feature selection and hyperparameter tuning within the training set only, the multi-step modeling pipeline may still be susceptible to overfitting, and performance estimates may be optimistic in the absence of external validation. Accordingly, the proposed models should be viewed as tools for longitudinal risk stratification and hypothesis generation, rather than as instruments for direct clinical decision-making. Future studies incorporating decision-curve analysis, clinically meaningful risk thresholds, and external validation will be necessary to formally establish clinical utility. Integration of additional data sources, including biomarkers, imaging, and genetic information, may improve future predictive accuracy. Furthermore, our analysis was based on baseline data; dynamic risk models incorporating time-varying covariates may offer greater precision. Lastly, our findings are derived from a Chinese cohort aged ≥45 years and may not be directly generalizable to other ethnic or age groups. External validation across diverse populations is essential to confirm the utility of these models and stage-specific strategies.
Future research should focus on validating these stage-specific ML models in external, ethnically diverse populations. Incorporating longitudinal changes in risk factors will be crucial for developing dynamic prediction models that better capture CKM disease evolution. Integration with clinical decision support systems may facilitate translation into practice, allowing clinicians to apply personalized, stage-based interventions. Interventional trials are warranted to assess whether tailoring preventive strategies to CKM stage improves outcomes compared to standard approaches. Importantly, future work should evaluate the clinical consequences of model-guided decisions using decision-curve analysis and stage-specific risk thresholds to determine whether model-informed strategies provide net benefit over existing assessment approaches. Additionally, inclusion of novel biomarkers reflecting inflammation, subclinical vascular injury, or metabolic dysfunction may further refine risk stratification.
Conclusions
In this Chinese cohort of middle-aged and older adults with CKM syndrome stages 0–3, ML with SHAP analysis revealed a dynamic evolution of CVD risk factors across disease progression. Early-stage CKM was characterized by anthropometric and functional parameters, while advanced-stage disease showed stronger associations with inflammatory markers. These findings underscore the importance of CKM stage-aware risk profiling and provide hypothesis-generating, interpretable insights for future risk stratification research; external validation and prospective evaluation are needed before clinical translation.
Supplemental Material
sj-docx-1-dhj-10.1177_20552076261427850 - Supplemental material for Predicting cardiovascular risk across cardiovascular–kidney–metabolic syndrome stages in middle-aged and older Chinese adults: An interpretable machine learning analysis
Supplemental material, sj-docx-1-dhj-10.1177_20552076261427850 for Predicting cardiovascular risk across cardiovascular–kidney–metabolic syndrome stages in middle-aged and older Chinese adults: An interpretable machine learning analysis by Zhan Chen, Ruimin Lin and Yue Zhang in DIGITAL HEALTH
Supplemental Material
sj-xlsx-4-dhj-10.1177_20552076261427850 - Supplemental material for Predicting cardiovascular risk across cardiovascular–kidney–metabolic syndrome stages in middle-aged and older Chinese adults: An interpretable machine learning analysis
Supplemental material, sj-xlsx-4-dhj-10.1177_20552076261427850 for Predicting cardiovascular risk across cardiovascular–kidney–metabolic syndrome stages in middle-aged and older Chinese adults: An interpretable machine learning analysis by Zhan Chen, Ruimin Lin and Yue Zhang in DIGITAL HEALTH
Supplemental Material
sj-xlsx-5-dhj-10.1177_20552076261427850 - Supplemental material for Predicting cardiovascular risk across cardiovascular–kidney–metabolic syndrome stages in middle-aged and older Chinese adults: An interpretable machine learning analysis
Supplemental material, sj-xlsx-5-dhj-10.1177_20552076261427850 for Predicting cardiovascular risk across cardiovascular–kidney–metabolic syndrome stages in middle-aged and older Chinese adults: An interpretable machine learning analysis by Zhan Chen, Ruimin Lin and Yue Zhang in DIGITAL HEALTH
Supplemental Material
sj-xlsx-6-dhj-10.1177_20552076261427850 - Supplemental material for Predicting cardiovascular risk across cardiovascular–kidney–metabolic syndrome stages in middle-aged and older Chinese adults: An interpretable machine learning analysis
Supplemental material, sj-xlsx-6-dhj-10.1177_20552076261427850 for Predicting cardiovascular risk across cardiovascular–kidney–metabolic syndrome stages in middle-aged and older Chinese adults: An interpretable machine learning analysis by Zhan Chen, Ruimin Lin and Yue Zhang in DIGITAL HEALTH
Footnotes
Abbreviations
Acknowledgements
The authors express their sincere gratitude to the participants of the CHARLS for their valuable contributions. We thank the research team at the National School of Development, Peking University, for their meticulous data collection and management.
Ethics approval and consent to participate
The study protocol was reviewed and approved by the Institutional Review Board of Peking University (IRB00001052-11015). Written informed consent was obtained from all participants prior to their inclusion in the CHARLS.
Consent for publication
Not applicable.
Author contributions
YZ, ZC, and RL conceived the study design and conceptualization. YZ and ZC performed data analysis and statistical interpretation. ZC drafted the initial manuscript. YZ and RL critically revised the manuscript for important intellectual content. All authors read and approved the final manuscript.
Funding
The authors received no financial support for the research, authorship, and/or publication of this article.
Declaration of conflicting interests
The authors declared no potential conflicts of interest with respect to the research, authorship, and/or publication of this article.
Data availability
Supplemental material
Supplemental material for this article is available online.
References
Supplementary Material
Please find the following supplemental material available below.
For Open Access articles published under a Creative Commons License, all supplemental material carries the same license as the article it is associated with.
For non-Open Access articles published, all supplemental material carries a non-exclusive license, and permission requests for re-use of supplemental material or any part of supplemental material shall be sent directly to the copyright owner as specified in the copyright notice associated with the article.