
Abstract
Background
Atherogenic dyslipidemia significantly influences diabetes development, yet the longitudinal prognostic value of the atherogenic index of plasma (AIP) in prediabetic populations remains understudied. This study investigated whether dynamic AIP measures predict diabetes conversion in middle-aged and older Chinese adults with prediabetes while exploring interactions with other metabolic risk factors through interpretable machine learning.
Methods
We analyzed data from 1965 prediabetic adults (≥ 45 years) from the China Health and Retirement Longitudinal Study (2012–2015), assessing baseline AIP, cumulative AIP exposure (AIPcum), and change patterns via K-means clustering. Associations with incident diabetes were evaluated using logistic regression with progressive confounder adjustment. Five machine learning models were developed using predictors identified through the Boruta algorithm and recursive feature elimination, with the best model interpreted via SHAP (SHapley Additive exPlanations) analysis.
Results
During follow-up, 15.0% of participants progressed to diabetes. Elevated AIPcum showed the strongest association with diabetes risk (OR for highest vs. lowest quartile = 2.37; 95% CI: 1.60–3.57; P < 0.001), while “Persistently High” and “Increasing” AIP change patterns exhibited ∼2.5-fold higher risk versus “Persistently Low” patterns. Random forest achieved the best predictive performance (AUROC = 0.760), with glucose, hand grip strength, AIPcum, and waist circumference as key predictors. Interaction analyses revealed significant synergistic effects between AIPcum and other metabolic factors.
Conclusion
Cumulative AIP exposure and unfavorable AIP change patterns independently predict prediabetes-to-diabetes progression. Incorporating these measures into risk assessment may enhance early identification of high-risk individuals and inform targeted interventions.
Keywords
Introduction
Diabetes mellitus represents a global health challenge of increasing magnitude, with ∼537 million adults currently affected worldwide and projections suggesting this number will rise to 783 million by 2045. 1 Of particular concern is the large population with prediabetes—characterized by impaired fasting glucose or impaired glucose tolerance—who face an annual conversion rate to diabetes of 5%–10%. 2 With China hosting one of the world's largest populations of individuals with prediabetes, estimated at 35.7% of adults, identifying reliable predictors of diabetes development is of paramount public health importance. 3
Atherogenic dyslipidemia, characterized by elevated triglycerides (TGs) and decreased high-density lipoprotein cholesterol (HDL-C), plays a critical role in the pathogenesis of both cardiovascular disease and diabetes.4,5 The atherogenic index of plasma (AIP), calculated as the logarithmic ratio of TG to HDL-C, has emerged as a comprehensive marker that reflects the balance between atherogenic and protective lipoproteins. 6 While AIP has demonstrated strong associations with insulin resistance, metabolic syndrome, cardiovascular outcomes, and obesity,7,8 its value in predicting progression from prediabetes to diabetes remains inadequately explored.
Previous studies investigating lipid parameters and diabetes risk have predominantly used baseline measurements from large cohort studies,9,10 with limited attention to the dynamic and cumulative nature of lipid exposure over time. 11 Moreover, the complex interplay between AIP and other metabolic risk factors in determining diabetes risk has not been systematically evaluated using advanced analytical approaches that can account for non-linear relationships and interactions.
Machine learning (ML) techniques offer promising tools to address these limitations by identifying complex patterns and interactions within multivariate data. Several studies have demonstrated successful applications of ML approaches to diabetes prediction and diagnosis, with Nguyen et al. achieving exceptional performance using random forest (RF) algorithms (cross-validation scores reaching 0.998), highlighting the potential of tree-based models in clinical applications. 12 However, their application of ML in diabetes prediction has been hampered by concerns about interpretability. 13 The recent development of explainable artificial intelligence methods, such as SHapley Additive exPlanations (SHAP), presents an opportunity to leverage the predictive power of ML while maintaining clinical interpretability. 14 This breakthrough enables clinicians to understand not only what the model predicts but why specific predictions are made, thereby making ML technology practically applicable in clinical settings while maintaining the sophisticated analytical capabilities that distinguish ML from traditional statistical approaches.
In this study, we aimed to investigate the association between dynamic measures of AIP and the risk of progression from prediabetes to diabetes in middle-aged and older Chinese adults. Specifically, we evaluated three complementary AIP indices: baseline AIP, cumulative AIP exposure (AIPcum), and longitudinal AIP change patterns identified through unsupervised clustering. Furthermore, we employed interpretable ML approaches to identify key predictors of diabetes development and explore potential interaction effects between AIP and other metabolic risk factors. Our findings may provide novel insights into lipid-related risk stratification for individuals with prediabetes and inform targeted preventive strategies to mitigate the growing burden of diabetes in aging populations.
Methods
Data source and study population
This study analyzed data from the China Health and Retirement Longitudinal Study (CHARLS), a nationally representative cohort of Chinese adults aged ≥ 45 years. Participants were selected through stratified multistage probability sampling across 150 county-level units in 28 provinces. Data collection included demographic characteristics, health status, behavioral factors, and biomarkers, obtained via standardized face-to-face interviews. The study design and methodology of CHARLS have been previously described in detail. 15 All participants provided written informed consent, and the study was approved by the Institutional Review Board of Peking University (IRB00001052-11015).
We designated wave 1 (2011–2012) as the baseline and utilized data from this survey and wave 3 (2015) to evaluate dynamic changes in the AIP and assess diabetes outcomes. As shown in the study flowchart (Figure 1), we applied specific inclusion and exclusion criteria to define our analytical sample. From the initial CHARLS cohort, we identified participants with prediabetes at baseline (n = 3065), defined according to American Diabetes Association criteria as having fasting plasma glucose levels between 5.6 and 6.9 mmol/L (100–125 mg/dL) or hemoglobin A1c (HbA1c) values between 5.7% and 6.4%. 16 We excluded participants who were younger than 45 years (n = 104), had incomplete diabetes follow-up data at wave 3 (n = 990), or lacked laboratory values necessary for AIP calculation (n = 6). After applying these criteria, 1965 participants with prediabetes remained for the final analysis.

The overall flowchart of the study.
Measurement and calculation of AIP
AIP was selected as the primary study variable to evaluate atherogenic dyslipidemia. Blood samples were collected after overnight fasting from participants during the baseline survey (2011–2012) and follow-up (2015), with over 92% of respondents who gave blood reporting that they were fasting. Serum TG and HDL-C were measured using enzymatic colorimetric tests by trained medical personnel following standardized protocols. 15 All blood samples were processed at the Youanmen Center for Clinical Laboratory of Capital Medical University using an automated chemistry analyzer. 17 Laboratory standardization included rigorous quality control measures with the following assay specifications: TGs were measured using an enzymatic colorimetric test with a within-assay coefficient of variation (CV) of 1.5%, between-assay CV of 1.8%, and detection limits of 4–1000 mg/dL; HDL-C was measured using an enzymatic colorimetric test with a within-assay CV of 1.0%, between-assay CV of 1.3%, and detection limits of 3–120 mg/dL. This laboratory maintains regular external quality assessment organized by the Chinese Ministry of Health and conducts daily quality control samples. The center has been accredited by the Beijing Health Bureau and demonstrates excellent performance during annual evaluation by the External Quality Assurance (EQA) Program organized by the National Center for Clinical Laboratories, China Ministry of Health. All test results from quality control samples were within the target range (within two standard deviations of mean QC control concentrations).
The AIP was calculated using the following formula
6
:

We calculated AIP values for both baseline (2011–2012) and follow-up (2015) measurements. To comprehensively assess the impact of AIP dynamics on diabetes development, we employed three analytical approaches:
Baseline AIP: Participants were stratified into quartiles (Q1–Q4) based on their baseline AIP values.
18
Cumulative AIP exposure (AIPcum): To capture long-term AIP effects, we calculated cumulative exposure using the formula: AIPcum = (AIP₂₀₁₂ + AIP₂₀₁₅)/2 × (2015–2012), as previously described by Zheng et al.
19
AIP change patterns: Using K-means cluster analysis, we identified distinct patterns of AIP change over time, categorizing participants into four change groups: persistently low, decreasing, increasing, and persistently high.
20
Assessment of diabetes
The primary outcome of this study was the development of diabetes at the 2015 follow-up (wave 3). In the CHARLS cohort, diabetes status was assessed through both self-reported information and objective laboratory measurements. 21 Participants were classified as having diabetes if they met any of the following criteria: self-reported physician diagnosis of diabetes, self-reported current use of anti-diabetic medications, or laboratory evidence of diabetes. Laboratory diagnosis was based on American Diabetes Association criteria, 16 defined as fasting plasma glucose (FPG) ≥ 126 mg/dL (7.0 mmol/L), random plasma glucose (RPG) ≥ 200 mg/dL (11.1 mmol/L), or HbA1c ≥ 6.5%.
Data collection
Variable selection was based on clinical expertise and supported by previous literature on risk factors for diabetes. Variables were categorized into six major domains for subsequent analysis. Sociodemographic variables included age, gender, residence (urban or rural), marital status (married or single/divorced/widowed), and educational level (elementary school or below vs. middle school or above). Lifestyle variables comprised smoking status (non-smoker or smoker) and alcohol consumption (non-drinker or drinker). Physical activity was assessed using the International Physical Activity Questionnaire (IPAQ), and Metabolic equivalent (MET) scores were calculated as follows: vigorous activity × 8.0 + moderate activity × 4.0 + walking × 3.3.22,23 Based on the total MET score, participants were classified into low and high activity groups. Anthropometric indicators included body mass index (BMI), waist circumference, and hand grip strength, which was measured using a calibrated dynamometer. Blood pressure was measured three times using an Omron HEM-7200 electronic monitor after participants had abstained from smoking, alcohol, exercise, and food for at least 30 minutes. The final blood pressure values were derived as the average of the three readings. Cognitive function was evaluated using the Mini-Mental State Examination (MMSE), a validated tool for assessing global cognitive status. 24 Laboratory measurements included complete blood count (white blood cell [WBC] count, hemoglobin, and platelet [PLT] count); glycemic markers such as fasting plasma glucose and HbA1c; lipid profile including TG, HDL-C, low-density lipoprotein cholesterol (LDL-C), and calculated remnant cholesterol (RC); renal function indices including blood urea nitrogen (BUN), serum creatinine (Cr), estimated glomerular filtration rate (eGFR), and cystatin C; inflammatory marker C-reactive protein (CRP); and other biochemical indicators such as serum uric acid (UA). Psychological status was assessed using the 10-item Center for Epidemiologic Studies Depression Scale (CESD-10), with scores ≥ 10 indicating clinically significant depressive symptoms. 25 Additionally, we included self-reported comorbidities covering a broad range of conditions, such as cardiovascular disease, stroke, chronic liver and kidney diseases, digestive disorders, arthritis or rheumatism, cancer, lung disease, asthma, psychiatric disorders, and sensory impairments (vision and hearing conditions).
AIP change patterns identification and regression modeling
To identify distinct longitudinal patterns in AIP, we applied K-means clustering, a distance-based unsupervised learning algorithm valued for its simplicity, scalability, and interpretability. 20 The optimal number of clusters (k) was determined using the elbow method, which evaluates the within-cluster sum of squares (WCSS) across different values of k, and further validated through silhouette analysis to assess clustering quality. The final number of clusters was selected by comprehensively considering multiple criteria: (1) the inflection point in the elbow curve where additional clusters yielded diminishing returns in WCSS reduction, (2) acceptable silhouette scores (> 0.3) indicating reasonable clustering quality, (3) clinical interpretability of the resulting change patterns, and (4) clear inter-cluster separation as evidenced by density distribution plots.
Clustering was based on individual AIP measurements at baseline (2011–2012) and follow-up (2015), allowing for the classification of participants into distinct change groups reflecting patterns of AIP change over time. Each participant was assigned to one of the derived change groups, and mean AIP values at both time points were calculated to characterize each cluster's temporal trend.
Subsequently, we examined associations between baseline AIP, AIPcum, AIP change patterns, and diabetes risk using both univariate and multivariate logistic regression models. To ensure the robustness of these analyses, multicollinearity among covariates was assessed using variance inflation factors (VIFs), and no significant collinearity was detected.
Data preprocessing and feature selection
To comprehensively evaluate the predictive role of AIP in diabetes development, we incorporated AIPcum into our ML framework as a key variable. Prior to model development, we conducted comprehensive data preprocessing to ensure quality and consistency. Variables with more than 30% missing data were excluded from consideration. For continuous variables with partial missingness, we applied the K-nearest neighbors (KNNs) imputation method (n_neighbors = 5), which estimates missing entries based on similar observations in the feature space. 26 For categorical variables, mode imputation was employed. 27 Outliers were identified using the interquartile range (IQR) method, defined as values below Q1−1.5 × IQR or above Q3 + 1.5 × IQR. To mitigate their influence while preserving sample size, we applied winsorization to cap these extreme values rather than removing them.
To identify the most relevant predictors of diabetes onset, we employed a comprehensive feature selection strategy that integrated two complementary methods. First, the Boruta algorithm—a RF-based wrapper technique—was applied over 20 iterations to ensure result stability. This approach assesses feature importance by statistically comparing each variable against randomly permuted “shadow features.” 28 Concurrently, we conducted recursive feature elimination (RFE) with 5-fold cross-validation, using the area under the receiver operating characteristic curve (AUROC) and its 95% confidence intervals (CIs) to evaluate model performance at each elimination step. 29 Features consistently identified as important by both methods were selected for final model development. By synthesizing the results of both methods, we identified an optimal subset of seven predictors for diabetes risk, with AIPcum ranking among the top features.
ML algorithms
A stratified random sampling approach was employed to partition the dataset into a training set (70%) and a test set (30%), ensuring preservation of the original class distribution. The training set was used to develop ML models, while the test set was reserved exclusively for performance evaluation. Based on the seven most predictive features identified through feature selection, five ML algorithms were constructed: logistic regression (LR), RF, Extreme Gradient Boosting (XGBoost), light gradient boosting machine (LightGBM), and multilayer perceptron (MLP).
To address class imbalance, class weighting strategies were employed, with weights calculated as the ratio of negative to positive samples. 30 Hyperparameter tuning was conducted via grid search with 5-fold stratified cross-validation to explore predefined parameter spaces while minimizing the risk of overfitting. The F1 score was selected as the primary optimization criterion due to its balanced representation of precision and recall, which is particularly important in clinical prediction contexts. 31
The optimal configurations for each model were as follows: LR with elastic net regularization; RF with increased tree depth and class weighting; XGBoost with depth control and regularization to reduce overfitting; LightGBM with tuned leaf count and regularization parameters; and MLP with an adaptive learning rate and early stopping. Model performance was evaluated using multiple metrics, including accuracy, precision, recall, specificity, F1 score, and AUROC. Additionally, confusion matrices were calculated for all models to provide an intuitive understanding of classification performance, including true positives, true negatives, false positives, and false negatives.
SHAP interpretability analysis
To improve the interpretability of the ML models, we conducted a SHAP analysis on the best-performing algorithm. SHAP provides a consistent and model-agnostic framework for explaining individual predictions by estimating the marginal contribution of each feature to the model's output. For this analysis, we employed the TreeExplainer method, which is specifically optimized for tree-based algorithms. In this context, positive SHAP values indicate that a given feature contributes to an increased predicted probability of diabetes, whereas negative values reflect a protective effect.
To visualize and interpret the results, we used three complementary techniques. First, SHAP summary plots were generated to display the distribution and relative importance of all features across the test set. Second, partial dependence plots were constructed using locally weighted scatterplot smoothing (LOWESS) to explore potential non-linear relationships between individual features and their SHAP values. Third, SHAP force plots were utilized to decompose individual-level predictions, visually demonstrating how each feature contributed to deviations from the model's baseline prediction.
Additionally, to investigate non-linear interactions between AIPcum and other key diabetes risk factors, we generated two-dimensional SHAP interaction heatmaps.
Comparator indices and incremental value
In addition to AIPcum, we derived four commonly used indices (TyG, LAP, VAI, and METS-IR; formulas in the Supplementary Methods). Using the same evaluation dataset, we fitted six logistic models: base, base + AIPcum, and Base + each competing index (TyG/LAP/VAI/METS-IR). We compared discrimination as ΔAUROC versus base using the DeLong test, calibration (intercept/slope with reliability plots), and decision-curve analysis (DCA) across 5%–20% risk thresholds. Because models and decision curves were assessed on the same dataset, DCA estimates may be slightly optimistic; we therefore emphasize relative net-benefit comparisons.
Statistical analysis
Continuous variables were expressed as mean ± standard deviation (SD) or median with IQR, depending on their distribution. Group comparisons were conducted using Student's t-test for normally distributed data and the Wilcoxon rank-sum test for non-normally distributed data. Categorical variables were presented as frequencies and percentages, and differences between groups were assessed using the chi-square test or Fisher's exact test when expected cell counts were ≤5. A two-sided P-value <0.05 was considered statistically significant. All analyses were conducted using R (version 4.4.2; R Foundation for Statistical Computing, Vienna, Austria) and Python (version 3.12.9), with ML and statistical procedures implemented via the scikit-learn, pandas, and statsmodels libraries.
Sensitivity analyses
We conducted a baseline-only analysis using AIP measured in 2011–2012 (excluding any 2015 information) to minimize simultaneity/reverse causation. We also computed E-values for each key odds ratio and for the lower bound of its 95% CI to quantify the minimum strength of association an unmeasured confounder would need with both the exposure and the outcome (on the risk-ratio scale) to explain away the observed effect. 32
Results
Patient characteristics
Among 1965 participants with prediabetes at baseline, 295 (15.0%) developed diabetes during follow-up. The mean age was 59.0 ± 8.8 years, and 54.1% were female. While baseline characteristics showed expected patterns consistent with established diabetes risk factors (older age, lower education, and adverse metabolic profiles among converters), our primary focus was on evaluating the added prognostic value of dynamic AIP measures beyond these conventional predictors.
As shown in Table 1, baseline characteristics demonstrated anticipated differences between diabetes converters and non-converters across established risk factors, including sociodemographic, anthropometric, and metabolic parameters.
Baseline characteristics of included participants stratified by diabetes status.

SD: standard deviation; MET: metabolic equivalent; BMI: body mass index; SBP: systolic blood pressure; DBP: diastolic blood pressure; MMSE: Mini-Mental State Examination; WBC: white blood cell; HbA1c: glycated hemoglobin; HDL-C: high-density lipoprotein cholesterol; LDL-C: low-density lipoprotein cholesterol; RC: remnant cholesterol; BUN: blood urea nitrogen; eGFR: estimated glomerular filtration rate; CRP: C-reactive protein; AIP: atherogenic index of plasma; AIPcum: cumulative exposure to the atherogenic index of plasma.
* P-values were calculated using Student's t-test for continuous variables and chi-square test for categorical variables.
Comorbidities were more prevalent in the diabetes group, particularly heart disease (19.0% vs. 13.0%; P = 0.008), stroke (4.1% vs. 1.6%; P = 0.011), kidney disease (7.8% vs. 4.6%; P = 0.033), and arthritis (35.9% vs. 29.2%; P = 0.023).
Most notably, all AIP measures were significantly elevated in diabetes converters, including baseline AIP (2012; P = 0.006), follow-up AIP (2015; P < 0.001), and AIPcum (1.4 vs. 1.1; P < 0.001), suggesting potential added prognostic value beyond conventional risk factors.
Associations between AIP measures and risk of diabetes development
To identify distinct longitudinal patterns of AIP, we applied K-means clustering analysis. As shown in Figure 2(a) and (b), we evaluated clustering solutions from k = 2 to k = 8 using both the elbow method and silhouette analysis. While the elbow method showed the steepest WCSS reduction at k = 3, and silhouette analysis indicated a slightly higher average silhouette width for k = 3 (0.37) compared to k = 4 (0.36), we selected k = 4 as the optimal solution based on comprehensive evaluation criteria. The k = 4 solution provided the best balance between statistical clustering quality (silhouette score >0.3, indicating acceptable cluster separation) and clinical interpretability, yielding four distinct and biologically meaningful change patterns that capture the heterogeneous nature of lipid dysregulation in prediabetic individuals. The resulting four AIP change patterns (Figure 2(c) and (d)) were characterized as follows: Cluster 1 (persistently low) maintained consistently low AIP values; Cluster 2 (decreasing) exhibited a marked decline in AIP over time; Cluster 3 (increasing) showed a progressive increase in AIP; and Cluster 4 (persistently high) maintained consistently elevated AIP levels. Density plots of AIP values in 2012 and 2015 (Figure 2(e) and (f)) further demonstrated clear separation between clusters and stability of the clustering solution, supporting the validity of our k = 4 selection.
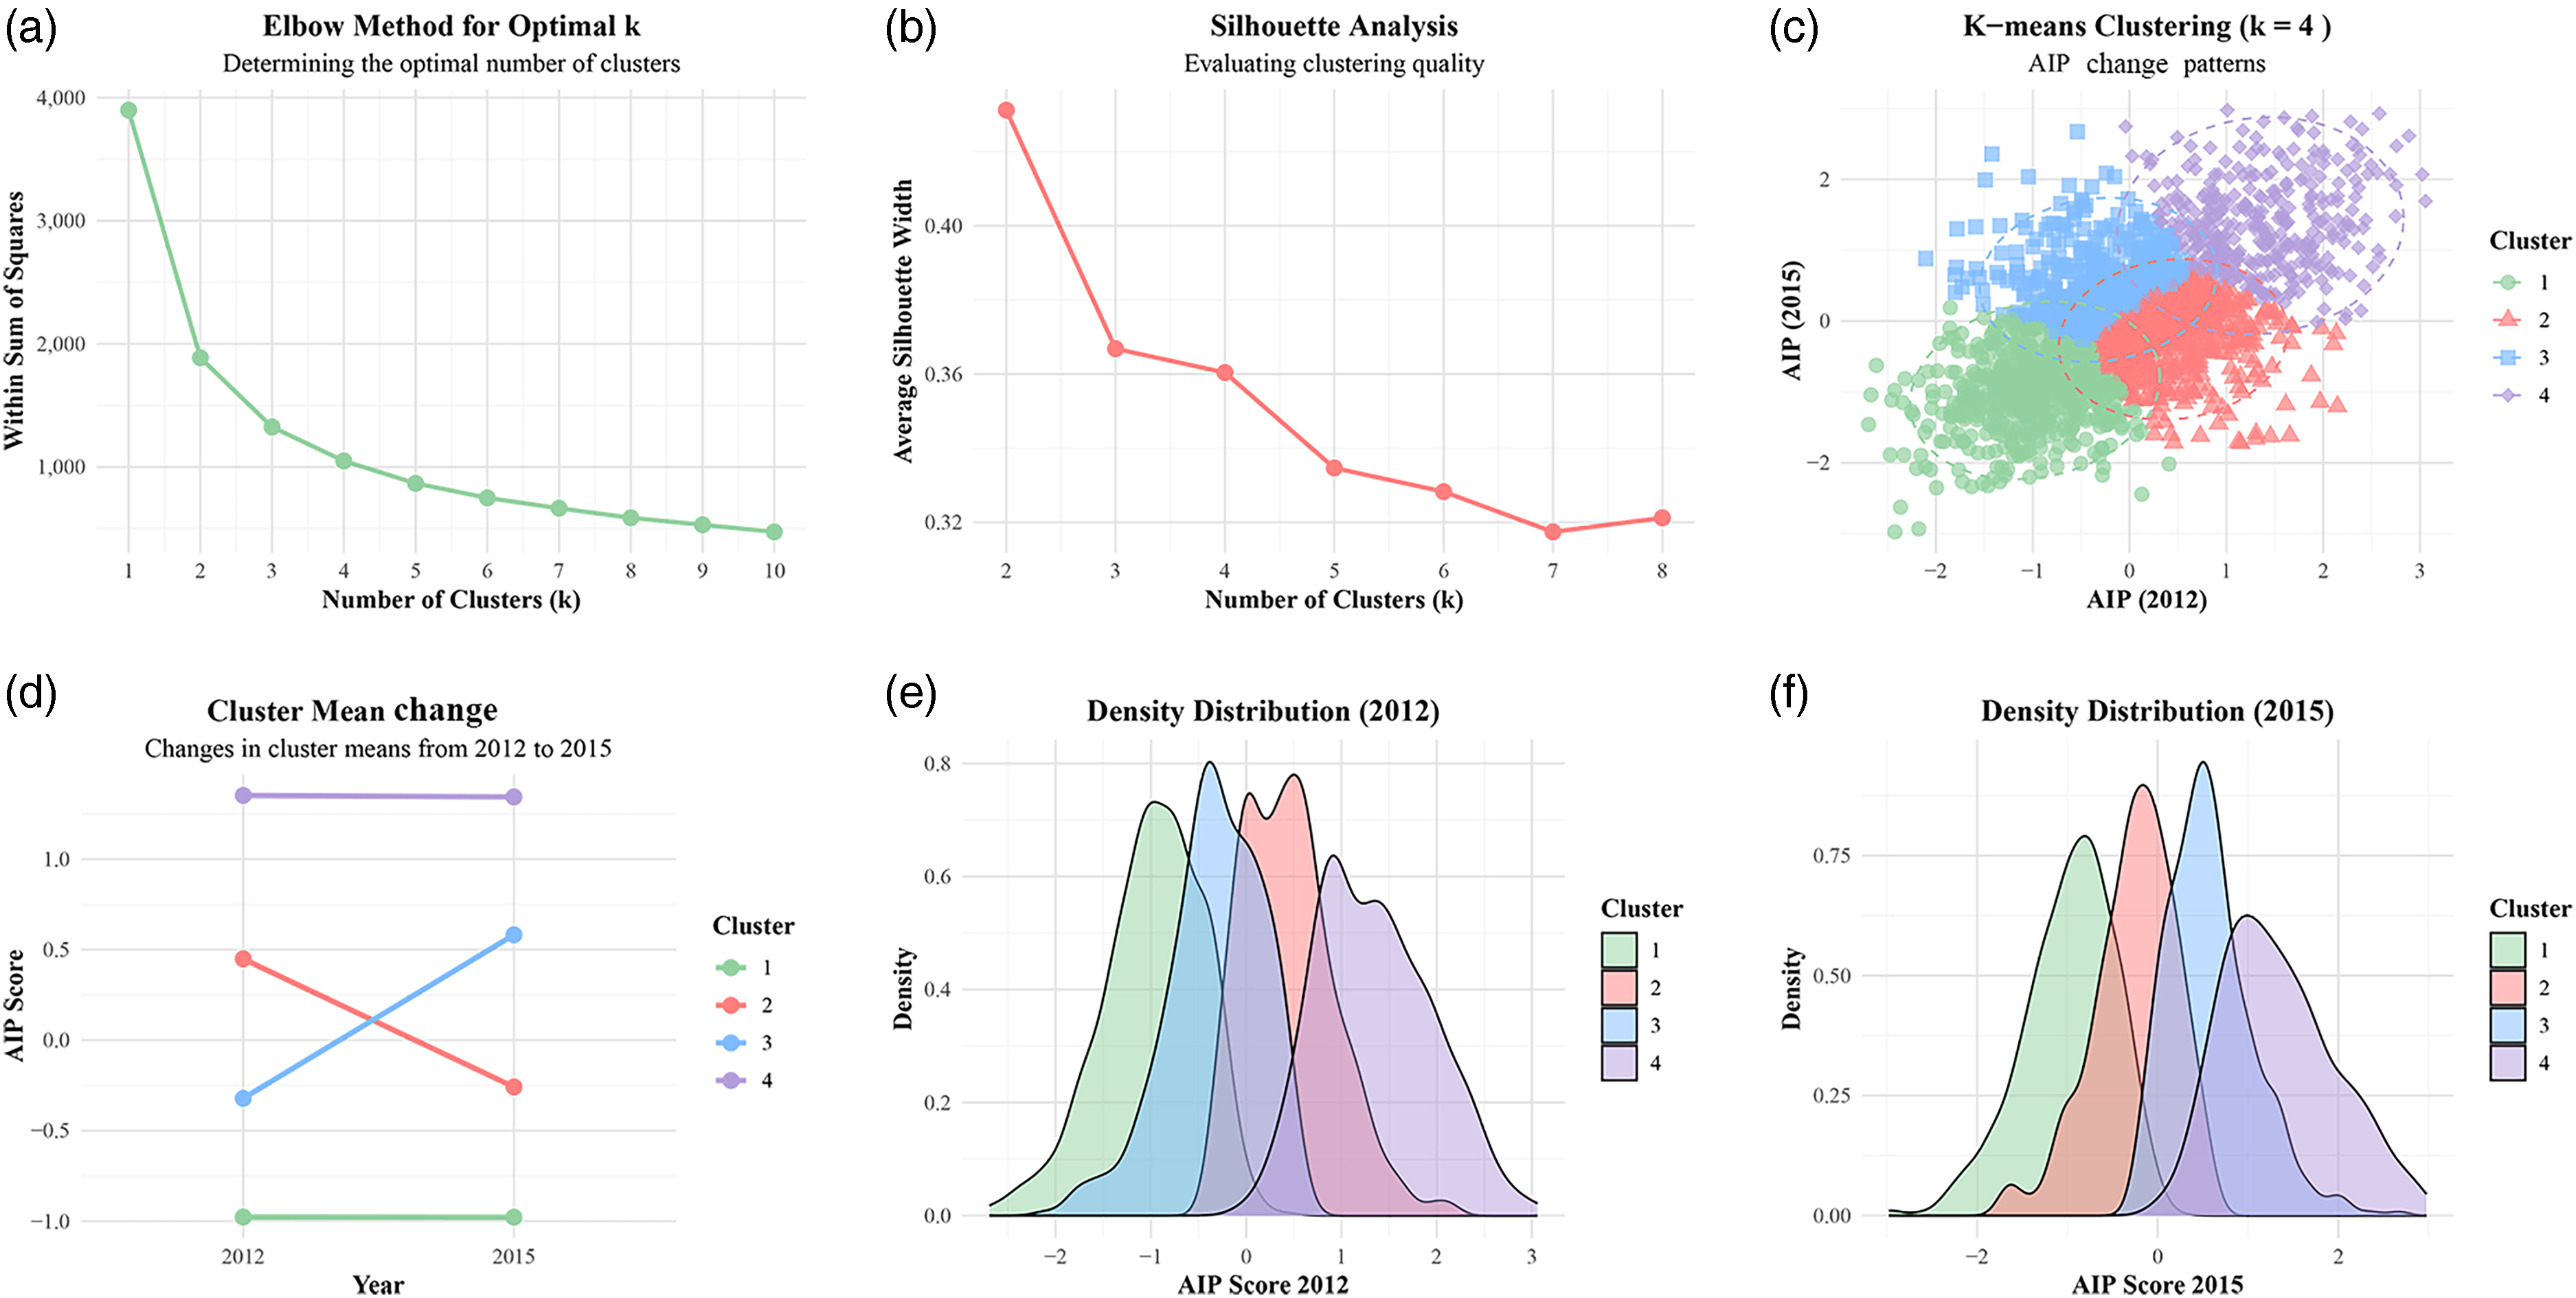
Identification of longitudinal atherogenic index of plasma (AIP) trajectory patterns in adults with prediabetes: (a) elbow method for determining optimal cluster number; (b) silhouette analysis evaluating clustering quality; (c) K-means clustering results (k = 4) showing four distinct AIP trajectory patterns; (d) cluster mean trajectories from 2012 to 2015: persistently low (Cluster 1), decreasing (Cluster 2), increasing (Cluster 3), and persistently high (Cluster 4); and (e and f) density distribution plots of AIP scores in 2012 (e) and 2015 (f).
Table 2 presents univariate and multivariate logistic regression analyses examining associations between AIP measurements and diabetes risk. For baseline AIP, each SD increase was associated with 77% higher diabetes risk in the unadjusted model (OR = 1.77, 95% CI: 1.20–2.61, P = 0.004). This association persisted after adjustment for sociodemographic and lifestyle factors in Model 2 (OR = 1.83, 95% CI: 1.21–2.76, P = 0.004) and clinical factors in Model 3 (OR = 1.79, 95% CI: 1.16–2.77, P = 0.009). Quartile analysis revealed participants in the highest baseline AIP quartile had 52% higher diabetes risk compared to the lowest quartile in the fully adjusted model (OR = 1.52, 95% CI: 1.03–2.26, P = 0.037), with a significant dose–response relationship (P for trend = 0.018).
Associations between baseline AIP, AIPcum, AIP change patterns, and risk of diabetes development.

AIP: atherogenic index of plasma; AIPcum: cumulative exposure to atherogenic index of plasma; OR: odds ratio; CI: confidence interval; SD: standard deviation; IQR: interquartile range; BMI: body mass index; SBP: systolic blood pressure; DBP: diastolic blood pressure; HbA1c: glycated hemoglobin.
Model 1 is not adjusted for any of the variables.
Model 2 is adjusted for age, gender, residence, marital status, education, smoking status, and drinking status.
Model 3 is adjusted for age, gender, residence, marital status, education, smoking status, drinking status, BMI, SBP, DBP, and HbA1c.
Cumulative AIP exposure demonstrated stronger associations with diabetes risk. Each SD increase in AIPcum was associated with 48% higher diabetes risk after full adjustment (OR = 1.48, 95% CI: 1.24–1.77, P < 0.001). Participants in the highest AIPcum quartile had 2.37-fold increased diabetes risk compared to the lowest quartile (OR = 2.37, 95% CI: 1.60–3.57, P < 0.001), with a highly significant dose-response relationship (P for trend<0.001).
For AIP change patterns, participants in the “Increasing” and “Persistently High” clusters had 2.50-fold (OR = 2.50, 95% CI: 1.70–3.69, P < 0.001) and 2.57-fold (OR = 2.57, 95% CI: 1.71–3.87, P < 0.001) higher diabetes risk, respectively, compared to the “Persistently Low” cluster. The “Decreasing” cluster showed no significant association with diabetes risk (OR = 1.13, 95% CI: 0.75–1.71, P = 0.560).
Feature selection and performance of ML models for diabetes risk prediction
Feature selection was performed using two separate and complementary methods operating independently: the Boruta algorithm and RFE. As shown in Figure 3, this combined approach identified seven key predictors of diabetes development among individuals with prediabetes. AIPcum emerged as the most important feature, followed by glucose, waist circumference, BMI, hand grip strength, uric acid, and LDL-C. These seven variables were consistently identified as important predictors across multiple feature selection methods and were subsequently used for all model development and analyses.

Feature selection results for diabetes conversion prediction in adults with prediabetes. (a) Sorted feature ranking distribution by the Boruta algorithm. Displays features ranked by their importance scores, with classification into selected, tentative, or rejected categories based on statistical comparison with shadow features. (b) Feature contribution and area under the curve (AUC) performance with recursive feature elimination. Shows feature contribution (importance) on the left y-axis and mean AUC performance on the right y-axis as features are sequentially eliminated.
Five ML models were evaluated for predicting diabetes development among individuals with prediabetes. As shown in Figure 4 and Supplemental Table S1, the MLP model achieved the highest accuracy in both training (85.2%) and test (79.7%) sets, with superior specificity (89.7% and 86.0%, respectively). However, its relatively low sensitivity (59.7% in training and 48.5% in test sets) limited its ability to correctly identify individuals who developed diabetes.
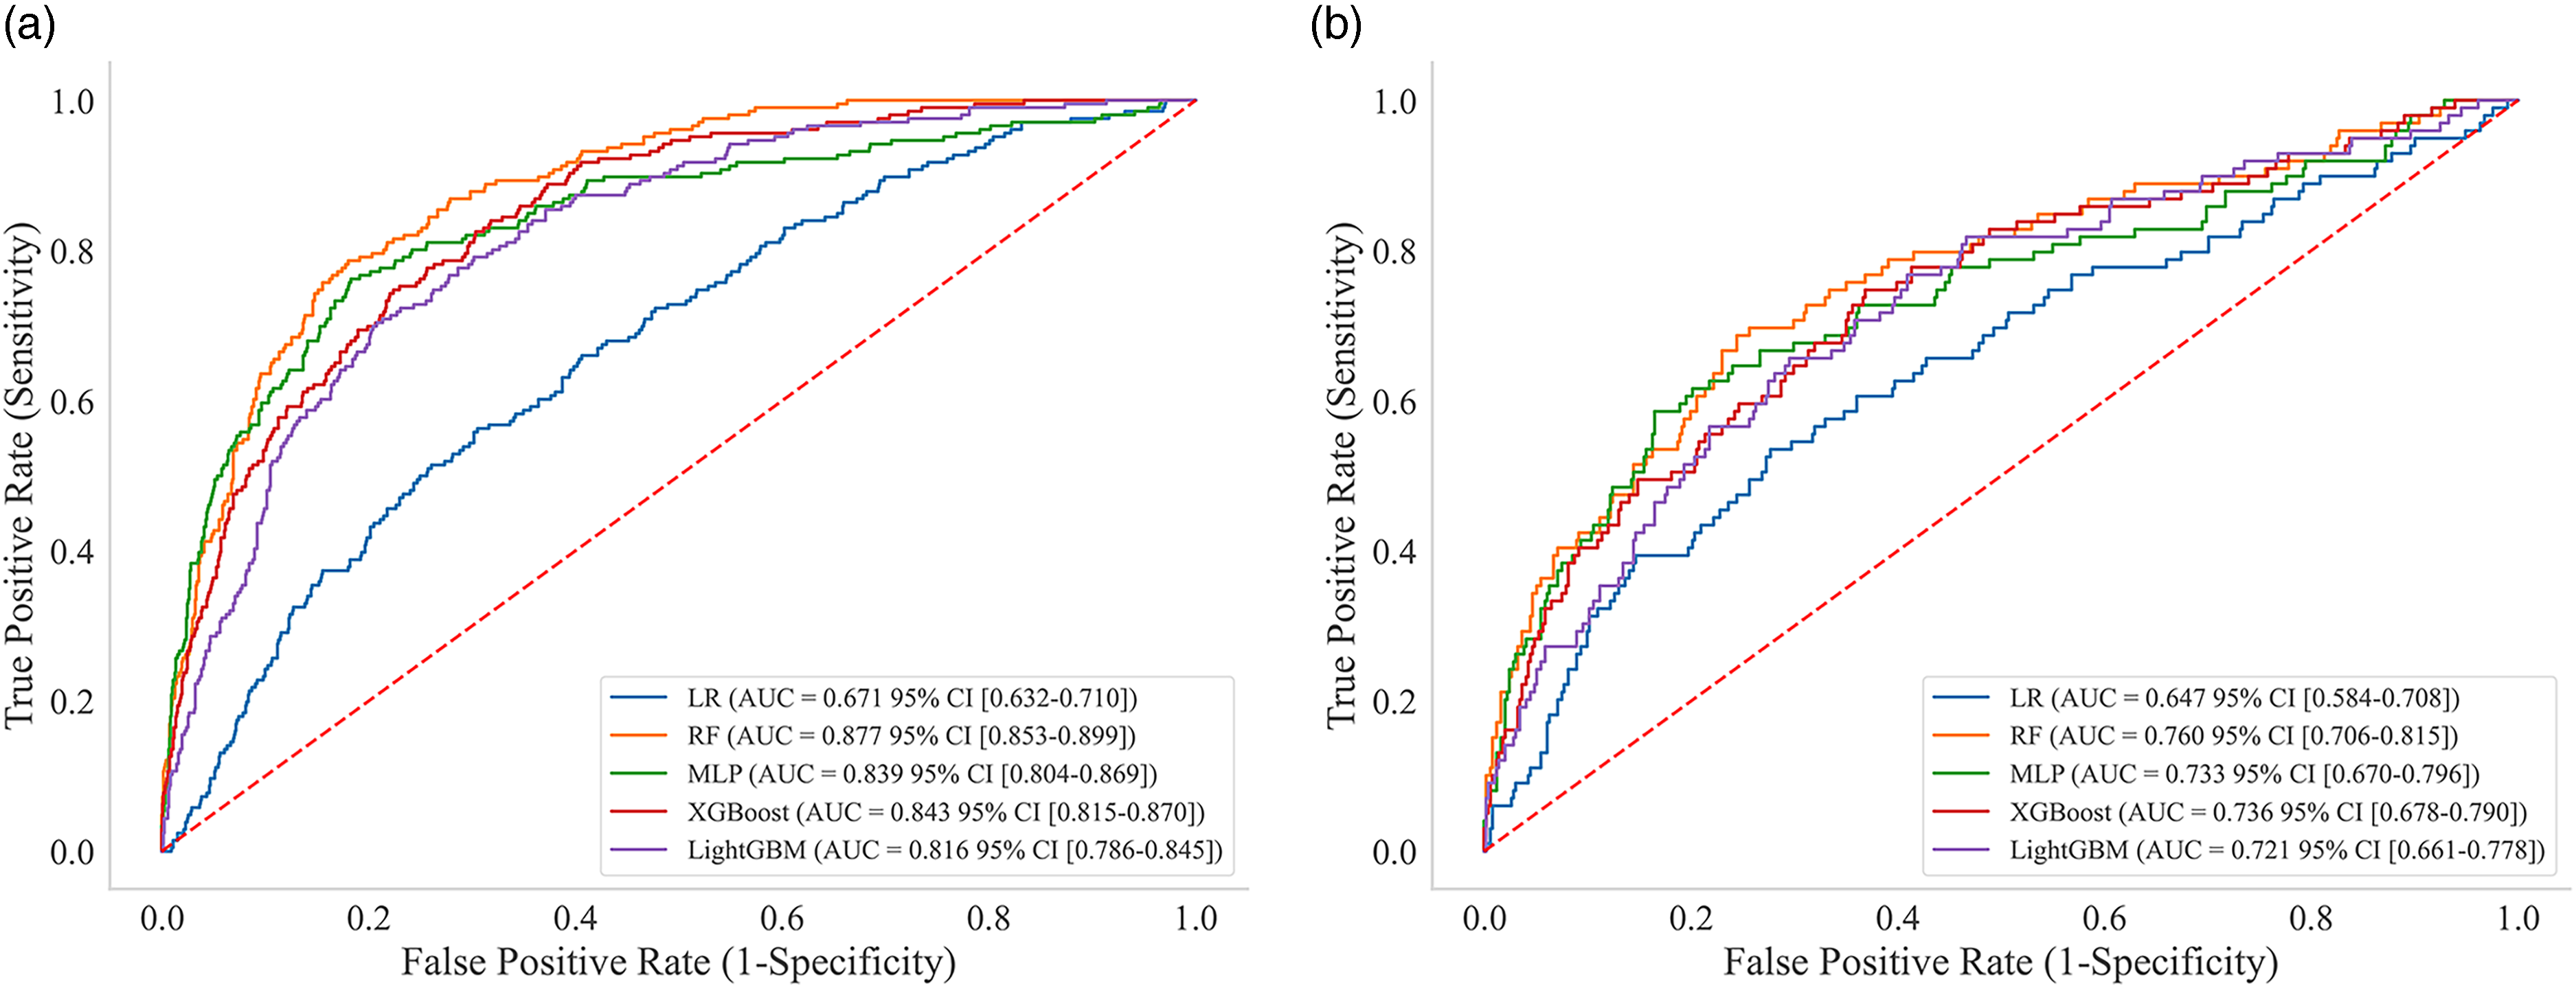
ROC curves for diabetes conversion prediction in adults with prediabetes using five machine learning models. ROC curves with AUC and CIs for LR, RF, MLP, XGBoost, and LightGBM models. (a) Training set and (b) test set.
The RF model demonstrated the most balanced overall performance, with the highest AUROC of 0.877 in the training set and 0.760 in the test set. This model maintained good sensitivity (82.0% and 72.7%) while preserving reasonable specificity (76.1% and 68.0%) across both datasets.
XGBoost and LightGBM performed similarly but slightly below RF, with test set AUROCs of 0.736 and 0.721, respectively. These models showed moderate but balanced sensitivity and specificity values. In contrast, the LR model exhibited the poorest overall performance, with the lowest AUROC (0.647 in the test set) and a substantial imbalance between high sensitivity (83.8%) and low specificity (26.5%), suggesting a tendency to over-classify individuals as high-risk.
The MLP model achieved the highest F1 scores (0.547 in training and 0.444 in test sets), while the RF model achieved F1 scores of 0.516 in training and 0.439 in test sets. Despite the MLP model's superior F1 performance, the RF model demonstrated the most balanced overall performance, achieving the highest AUROC values (0.877 in training and 0.760 in test sets) while maintaining good sensitivity (82.0% and 72.7%) and preserving reasonable specificity (76.1% and 68.0%) across both datasets. This superior balance between discrimination ability and clinical utility made the RF model the preferred choice for subsequent SHAP analyses.
Confusion matrix analysis provided additional insights into the classification performance of each model (Supplemental Table S2). The RF model demonstrated balanced performance with 64 true positives, 24 false negatives, 341 true negatives, and 160 false positives in the test set, correctly identifying 72.7% of participants who developed diabetes while maintaining reasonable specificity. In contrast, the LR model exhibited a problematic pattern with excessive false positives (368 out of 501 non-diabetes participants in the test set), explaining its poor specificity and limited clinical utility. The MLP model showed the opposite pattern with high specificity but lower sensitivity, resulting in 45 false negatives out of 88 diabetes cases in the test set. XGBoost and LightGBM demonstrated moderate performance with similar false positive rates (160 and 176, respectively) but higher false negative rates (28 each) compared to the RF model. These results underscore the importance of considering both sensitivity and specificity trade-offs when evaluating model performance for clinical applications.
Interpretability analysis of the RF model based on SHAP
The SHAP summary plot (Figure 5(a)) identified primary contributors to diabetes risk prediction: elevated glucose, reduced hand grip strength, increased AIPcum, and enlarged waist circumference. Quantitative feature importance ranking (Figure 5(b)) confirmed glucose as the most influential predictor, followed by hand grip strength and AIPcum.

SHAP interpretation of the random forest model for diabetes conversion prediction in adults with prediabetes. (a) Summary plot of SHAP values. Each row represents a feature, and each point denotes an individual sample. The x-axis indicates SHAP values (impact on model output), with positive values increasing and negative values decreasing diabetes conversion risk. Red and blue points represent high and low feature values, respectively. (b) Feature importance ranked by mean absolute SHAP values, with glucose, hand grip strength, and AIPcum as the top three contributors. (c) Force plot for individualized prediction in a representative patient (predicted diabetes conversion risk = 0.72). Red bars indicate the risk-enhancing features and blue bars indicate the protective features. Bar length reflects the magnitude of the contribution. (d) SHAP dependence plots showing non-linear associations between selected features (x-axis) and their SHAP values (y-axis), with vertical green dashed lines indicating critical threshold values.
For a representative participant with a predicted diabetes probability of 0.72 (Figure 5(c)), the force plot demonstrated how specific risk factors influenced this prediction. Elevated AIPcum (1.37), high uric acid (4.69 mg/dL), reduced hand grip strength (25.0 kg), increased BMI (29.23 kg/m²), and enlarged waist circumference (110.9 cm) collectively elevated diabetes risk, while lower LDL-C (86.6 mg/dL) and moderately elevated glucose (103.14 mg/dL) exerted protective effects.
The dependence plots (Figure 5(d)) revealed clinically relevant threshold effects across multiple predictors. BMI demonstrated a threshold at ∼25.85 kg/m², below which SHAP values became increasingly negative, indicating protection. Glucose exhibited a positive relationship with diabetes risk that accelerated above 107 mg/dL. AIPcum showed a biphasic pattern, with values below 0.89 being protective and values above being detrimental. Hand grip strength conferred protection most substantially above 30 kg, while waist circumference exhibited increased risk above 86 cm. UA demonstrated a threshold effect near 4.2 mg/dL, and LDL-C showed a protective effect at values below 110 mg/dL.
To investigate interactions between key predictors, we generated two-dimensional heatmaps (Figure 6) revealing how combinations of AIPcum with other risk factors synergistically influenced diabetes risk. The interaction between BMI and AIPcum (Figure 6(a)) demonstrated that the combination of high BMI and elevated AIPcum substantially increased diabetes risk (indicated by dark red regions), while low values of both parameters conferred protection (dark blue regions). Notably, even with normal BMI, increasing AIPcum raised diabetes risk, suggesting that unfavorable lipid profiles could counteract the benefits of normal weight. For glucose and AIPcum (Figure 6(b)), the highest risk occurred with elevated levels of both parameters, particularly when glucose exceeded 107 mg/dL and AIPcum exceeded 0.7. Interestingly, at intermediate AIPcum levels (1.0–1.5), glucose showed a stronger influence on risk, while at higher AIPcum values, the effect became more pronounced. The interaction between hand grip strength and AIPcum (Figure 6(c)) revealed that higher hand grip strength (>30 kg) provided protection against diabetes risk even at moderately elevated AIPcum levels, while the combination of reduced hand grip strength (<30 kg) and elevated AIPcum (>0.7) was associated with substantially increased diabetes risk. Waist circumference and AIPcum showed a strong synergistic effect (Figure 6(d)), with the highest risk observed when both parameters were elevated (waist >90 cm and AIPcum >1.0). Similarly, the UA and AIPcum interaction (Figure 6(e)) demonstrated increased risk with elevated levels of both markers, particularly when uric acid exceeded 4 mg/dL and AIPcum exceeded 0.7. The LDL-C and AIPcum interaction (Figure 6(f)) showed a more complex pattern, with the highest risk observed at moderate LDL-C levels (125–170 mg/dL) combined with elevated AIPcum (0.7–1.5), while both very low and very high LDL-C levels showed different interaction patterns with AIPcum.

Interaction heatmaps between AIPcum and other key risk factors for diabetes conversion in adults with prediabetes. Two-dimensional heatmaps showing diabetes conversion probability (blue: low risk and red: high risk) across combinations of AIPcum (y-axis) and other predictors (x-axis). (a) BMI and AIPcum interaction; (b) glucose and AIPcum interaction; (c) hand grip strength and AIPcum interaction; (d) waist circumference and AIPcum interaction; (e) uric acid and AIPcum interaction; and (f) LDL-C and AIPcum interaction.
Incremental value
Adding AIPcum to the base model increased AUROC from 0.695 to 0.708 (ΔAUROC = 0.013, DeLong P = 0.337), representing the largest (though modest) gain among the indices examined (TyG Δ0.009, P = 0.298; LAP Δ0.004, P = 0.546; VAI Δ0.006, P = 0.451; METS-IR Δ0.011, P = 0.334). Calibration was acceptable by reliability plots (intercept ∼0 and slope ∼1). Decision-curve analysis indicated slightly higher net benefit for base + AIPcum compared with base and with models including TyG/LAP/VAI/METS-IR across 5%–20% risk thresholds (Supplemental Table S3 and Figure S1). Together, these results support AIPcum as a parsimonious and interpretable enhancer to standard covariates, performing at least as well as competing indices.
Sensitivity analyses
In the baseline-only analysis (2011–2012 AIP only), higher baseline AIP remained associated with conversion to diabetes: per-SD OR = 1.79 (95% CI: 1.16–2.77) and Q4 versus Q1 OR = 1.52 (95% CI: 1.03–2.26), consistent with the main findings (Table 2). For the primary dynamic contrast (AIPcum Q4 vs. Q1), the E-values were 4.17 for the point estimate and 2.58 for the lower 95% CI bound; for baseline AIP, E-values were 2.98 (per-SD point), 1.59 (per-SD lower CI), 2.41 (Q4 vs. Q1 point), and 1.21 (Q4 vs. Q1 lower CI) (Supplemental Table S4).
Discussion
In this large, nationally representative cohort of middle-aged and older Chinese adults with prediabetes, we investigated the relationship between dynamic measures of AIP and progression to diabetes. AIPcum was independently associated with diabetes development, with individuals in the highest quartile exhibiting a 2.37-fold increased risk compared to those in the lowest quartile after adjusting for established risk factors. We identified four distinct AIP change patterns, with “Persistently High” and “Increasing” patterns conferring ∼2.5-fold higher diabetes risk compared to the “Persistently Low” pattern. ML analysis identified glucose as the primary predictor of diabetes development, with hand grip strength and AIPcum as secondary yet critical contributors.
Our findings extend previous cross-sectional studies linking elevated AIP with prevalent diabetes8,33 and prospective studies identifying associations between baseline AIP and incident diabetes. 18 However, our study uniquely assesses AIP dynamics and their relationship with diabetes progression, specifically in prediabetic individuals. The strong independent associations observed with AIPcum and change patterns suggest that dynamic AIP measures provide additional prognostic information beyond conventional assessments.
The clinical utility of dynamic AIP measures extends beyond traditional risk factors through several mechanisms. While conventional diabetes risk factors such as age, BMI, and fasting glucose are well-established predictors, our findings demonstrate that AIP dynamics capture distinct pathophysiological processes related to atherogenic dyslipidemia that are not fully captured by these traditional markers. The stronger association observed with cumulative AIP exposure (OR = 2.37 for the highest vs. the lowest quartile) compared to single-point measurements underscores the importance of sustained lipid dysregulation in diabetes pathogenesis. This finding is particularly clinically relevant because AIP can be easily calculated from routine lipid panels without additional cost, yet provides prognostic information that complements rather than merely duplicates existing risk assessment tools.
The stronger association between AIPcum and diabetes risk, compared to single-time-point measurements, underscores the role of sustained lipid dysregulation in diabetes pathogenesis. AIP, calculated as the log-transformed ratio of TGs to HDL-C, serves as a surrogate marker for an atherogenic lipid profile characterized by elevated TGs, decreased HDL-C, and a higher proportion of small, dense LDL particles.6,34 Persistent elevation in AIP indicates prolonged exposure to an atherogenic lipid environment, potentially contributing to insulin resistance through multiple biological pathways. 35
Elevated TGs and their metabolites can accumulate in non-adipose tissues, inducing lipotoxicity and impairing insulin signaling,36,37 while reduced HDL-C levels compromise anti-inflammatory and antioxidant functions that normally protect against insulin resistance. 38 When sustained, these effects can lead to progressive β-cell dysfunction and impaired glucose homeostasis. 39 Chronic lipid dysregulation also contributes to low-grade inflammation and endothelial dysfunction, further exacerbating insulin resistance. 40 The cumulative nature of these processes may explain why AIPcum demonstrates stronger associations with diabetes development than single-point measurements.
The identification of distinct AIP change patterns provides insights into the heterogeneous nature of lipid dysregulation over time. The “Persistently High” pattern conferred significant risk increase, supporting the notion that chronic exposure to atherogenic lipid profiles promotes diabetes development. Interestingly, the “Increasing” pattern demonstrated similarly elevated risk, suggesting that deteriorating lipid profiles may rapidly accelerate diabetes pathogenesis. Conversely, the “Decreasing” pattern showed no significant association with diabetes risk compared to the “Persistently Low” pattern, suggesting that improvements in AIP may attenuate diabetes risk even among individuals with prediabetes.
Our ML analysis identified a combination of metabolic, anthropometric, and lipid parameters as key predictors of diabetes development. While glucose emerged as the strongest predictor, the high ranking of hand grip strength and AIPcum represents a novel finding. SHAP analysis revealed clinically relevant threshold effects: fasting glucose demonstrated an accelerated positive relationship with diabetes risk above 107 mg/dL, while AIPcum values below 0.89 exhibited protective effects. BMI showed a threshold effect around 25.85 kg/m², aligning with established clinical definitions of overweight status. 41 These thresholds could serve as valuable reference points for clinicians developing personalized preventive strategies.
Interaction analyses revealed complex interrelationships between AIPcum and other metabolic factors. The synergistic effect between AIPcum and BMI suggests that lipid abnormalities may amplify the diabetogenic effects of excess adiposity. 42 The interaction between AIPcum and glucose indicates that atherogenic dyslipidemia may lower the threshold at which glycemic abnormalities progress to diabetes. Notably, elevated AIPcum could counteract the benefits of normal BMI, suggesting that “metabolically unhealthy normal weight” individuals might benefit from lipid-focused interventions. 43
One of the most intriguing findings was the identification of hand grip strength as the second most important predictor of diabetes development. This finding adds to growing evidence suggesting muscular strength plays a significant role in metabolic health.44,45 Several mechanisms might explain this association: decreased muscle strength often reflects sarcopenia, which is associated with impaired glucose disposal 46 ; myokines secreted during muscle contraction improve insulin sensitivity 47 ; and muscle-adipose tissue crosstalk plays a critical role in metabolic homeostasis. 48
These findings align with recent longitudinal studies linking grip strength to diabetes risk.49,50 Our study extends these findings by demonstrating that hand grip strength remains a strong predictor even after accounting for AIP and other metabolic factors, specifically in individuals with prediabetes. Higher hand grip strength may provide protection against diabetes development even with elevated AIPcum, suggesting that interventions to improve muscular strength might mitigate the adverse effects of atherogenic dyslipidemia on glucose metabolism.
Hand grip strength assessment offers several advantages in clinical settings: it is inexpensive, non-invasive, and easily measured. Unlike some risk factors, grip strength is modifiable through targeted interventions such as resistance training. 51 These findings highlight the importance of including physical function parameters in diabetes risk evaluation and suggest that resistance training should be an integral component of diabetes prevention strategies, particularly for individuals with prediabetes and unfavorable lipid profiles.
Our interpretable ML approach demonstrates clinically meaningful predictive capability (AUROC = 0.760) comparable to established diabetes risk scores,52,53 while offering several distinct advantages over traditional risk assessment methods. Beyond capturing complex non-linear relationships and interactions that conventional models miss, our SHAP-enhanced methodology provides transparent, actionable insights that can be readily translated into clinical decision support tools. The analysis revealed clinically relevant thresholds and factor interactions that enable personalized risk stratification, while SHAP force plots allow clinicians to visualize individual risk contributions and explain to patients why they are at high risk and which specific factors drive their risk profile.
This interpretability has significant implications for clinical practice and patient engagement. Clinicians can develop targeted intervention strategies based on each patient's dominant risk factors—for instance, directing patients with elevated AIPcum but normal BMI toward lipid-focused interventions, while recommending resistance training programs for those with reduced hand grip strength. This personalized approach, enabled by transparent AI explanations, enhances patient understanding and engagement while informing more precise, individualized prevention strategies that address each patient's specific risk determinants rather than applying generic interventions.
In head-to-head comparisons against TyG, LAP, VAI, and METS-IR, AIPcum delivered the largest—albeit modest—increment in discrimination with acceptable calibration and slightly higher clinical net benefit on decision curves. Given the similar magnitude of improvements across indices, the parsimony and interpretability of AIPcum favor its practical use.
Despite its strengths, our study has several limitations. First, we did not include oral glucose tolerance testing (OGTT) in baseline assessments. While OGTT is the gold standard for diagnosing impaired glucose tolerance (IGT), our use of FPG and HbA1c reflects standard practice in large-scale epidemiological studies and routine clinical screening. The absence of OGTT may have resulted in misclassification of some participants with undiagnosed diabetes as prediabetic or exclusion of individuals with isolated IGT, potentially influencing the observed AIP-diabetes associations. This limitation was imposed by the CHARLS study design, which prioritized feasibility in large-scale population screening. Future studies should incorporate the OGTT to provide more precise prediabetes classification. Second, the relatively short follow-up period may not fully capture long-term AIP dynamics and diabetes development. We were limited to only two time points for AIP measurements, constraining our ability to characterize more complex trajectories. Third, despite comprehensive confounder adjustment, residual confounding remains a concern, particularly regarding lifestyle factors. We had limited capacity to account for lifestyle interventions that significantly influence diabetes development. While we collected data on smoking, alcohol consumption, and physical activity (IPAQ), several limitations affected the comprehensive incorporation of these factors. Notably, detailed dietary information was unavailable in the CHARLS database, preventing adjustment for nutritional patterns that directly influence TG and HDL-C levels—the key AIP components. Additionally, physical activity data exceeded our 30% missing data threshold and was excluded from ML models to maintain analytical rigor. Given that dietary patterns and physical activity are established modifiers of lipid metabolism and diabetes risk, their incomplete assessment represents potential unmeasured confounding that could influence observed associations between AIP dynamics and diabetes progression.
Fourth, generalizability may be limited to Chinese adults aged ≥45 years, and—critically—medication data in CHARLS are available only as self-reported broad categories without drug class, dose, or duration. As a result, we could not adjust for or exclude specific glucose- or lipid-affecting agents (e.g. statins/fibrates, glucocorticoids, thiazides, β-blockers, atypical antipsychotics, calcineurin inhibitors, and selected antiretrovirals), and we did not exclude participants based on medication use. We state this explicitly as a major limitation. Such incomplete medication detail can plausibly introduce residual confounding in both directions, for example, statins/fibrates may lower TG and/or raise HDL-C and thereby reduce AIP (biasing our associations toward the null), whereas glucocorticoids or some antihypertensives may increase diabetes risk (biasing away from the null). Future studies should stratify analyses by medication use or exclude users of relevant pharmacologic interventions when detailed drug information is available.
Fifth, our machine learning models demonstrated notable performance decline from training to test sets, with the RF model AUROC declining from 0.877 to 0.760 (13.3% decrease). While test set performance still represents good discriminative ability comparable to published diabetes risk prediction models, this performance gap raises concerns about generalizability to external populations. This limitation may reflect the inherent complexity of predicting diabetes conversion in prediabetic populations, modest sample size, and class imbalance (15.0% conversion rate). Despite implementing rigorous cross-validation, regularization, and class weighting strategies, external validation in independent cohorts remains essential.
Future studies should extend follow-up periods beyond 5–10 years with regular AIP assessments to elucidate the temporal dynamics between atherogenic dyslipidemia and diabetes development. Validation across diverse populations is necessary as AIP-diabetes relationships likely vary by ethnicity, age, and geography. Interventional studies examining AIP reduction through targeted lifestyle modifications and pharmacological approaches in prediabetic individuals would establish causality and inform preventive strategies. Most importantly, external validation of our ML models in independent cohorts is crucial to assess true generalizability and clinical utility beyond the current study population.
Conclusions
Cumulative AIP exposure and unfavorable AIP change patterns independently predict prediabetes-to-diabetes progression. Our interpretable ML approach not only enhances predictive accuracy compared to traditional methods but also provides clinically actionable insights through individual-level risk explanations and identification of key interaction effects. Integrating these ML-derived insights into clinical decision support systems may revolutionize diabetes risk assessment by enabling more precise, personalized prevention strategies and improving patient engagement through transparent risk communication.
Supplemental Material
sj-xlsx-1-dhj-10.1177_20552076251390574 - Supplemental material for Dynamics of the atherogenic index of plasma and diabetes conversion: Insights from machine learning and longitudinal pattern analysis in middle-aged and older Chinese adults with prediabetes
Supplemental material, sj-xlsx-1-dhj-10.1177_20552076251390574 for Dynamics of the atherogenic index of plasma and diabetes conversion: Insights from machine learning and longitudinal pattern analysis in middle-aged and older Chinese adults with prediabetes by Zhan Chen, Yue Zhang and Liming Wang in DIGITAL HEALTH
Supplemental Material
sj-xlsx-2-dhj-10.1177_20552076251390574 - Supplemental material for Dynamics of the atherogenic index of plasma and diabetes conversion: Insights from machine learning and longitudinal pattern analysis in middle-aged and older Chinese adults with prediabetes
Supplemental material, sj-xlsx-2-dhj-10.1177_20552076251390574 for Dynamics of the atherogenic index of plasma and diabetes conversion: Insights from machine learning and longitudinal pattern analysis in middle-aged and older Chinese adults with prediabetes by Zhan Chen, Yue Zhang and Liming Wang in DIGITAL HEALTH
Supplemental Material
sj-xlsx-3-dhj-10.1177_20552076251390574 - Supplemental material for Dynamics of the atherogenic index of plasma and diabetes conversion: Insights from machine learning and longitudinal pattern analysis in middle-aged and older Chinese adults with prediabetes
Supplemental material, sj-xlsx-3-dhj-10.1177_20552076251390574 for Dynamics of the atherogenic index of plasma and diabetes conversion: Insights from machine learning and longitudinal pattern analysis in middle-aged and older Chinese adults with prediabetes by Zhan Chen, Yue Zhang and Liming Wang in DIGITAL HEALTH
Supplemental Material
sj-xlsx-4-dhj-10.1177_20552076251390574 - Supplemental material for Dynamics of the atherogenic index of plasma and diabetes conversion: Insights from machine learning and longitudinal pattern analysis in middle-aged and older Chinese adults with prediabetes
Supplemental material, sj-xlsx-4-dhj-10.1177_20552076251390574 for Dynamics of the atherogenic index of plasma and diabetes conversion: Insights from machine learning and longitudinal pattern analysis in middle-aged and older Chinese adults with prediabetes by Zhan Chen, Yue Zhang and Liming Wang in DIGITAL HEALTH
Supplemental Material
sj-docx-5-dhj-10.1177_20552076251390574 - Supplemental material for Dynamics of the atherogenic index of plasma and diabetes conversion: Insights from machine learning and longitudinal pattern analysis in middle-aged and older Chinese adults with prediabetes
Supplemental material, sj-docx-5-dhj-10.1177_20552076251390574 for Dynamics of the atherogenic index of plasma and diabetes conversion: Insights from machine learning and longitudinal pattern analysis in middle-aged and older Chinese adults with prediabetes by Zhan Chen, Yue Zhang and Liming Wang in DIGITAL HEALTH
Footnotes
Abbreviations
Acknowledgements
The authors express their sincere gratitude to the participants of the CHARLS for their valuable contributions. We thank the research team at the National School of Development, Peking University, for their meticulous data collection and management.
Ethics approval and consent to participate
The study protocol was reviewed and approved by the Institutional Review Board of Peking University (IRB00001052-11015). Written informed consent was obtained from all participants prior to their inclusion in the CHARLS.
Consent for publication
Not applicable.
Authors’ contributions
YZ, LW, and ZC conceived the study design and conceptualization. YZ and ZC performed data analysis and statistical interpretation. ZC drafted the initial manuscript. YZ and LW critically revised the manuscript for important intellectual content. All authors read and approved the final manuscript.
Funding
The authors received no financial support for the research, authorship, and/or publication of this article.
Declaration of conflicting interests
The authors declared no potential conflicts of interest with respect to the research, authorship, and/or publication of this article.
Data availability statement
Supplemental material
Supplemental material for this article is available online.
References
Supplementary Material
Please find the following supplemental material available below.
For Open Access articles published under a Creative Commons License, all supplemental material carries the same license as the article it is associated with.
For non-Open Access articles published, all supplemental material carries a non-exclusive license, and permission requests for re-use of supplemental material or any part of supplemental material shall be sent directly to the copyright owner as specified in the copyright notice associated with the article.