
Abstract
Introduction
Identifying factors that increase the risk of hospital readmission will help determine high-risk patients and decrease the socioeconomic burden. Pneumonia is associated with high readmission rates. Although residential greenness has been reported to have beneficial health effects, no studies have investigated its importance in predicting readmission in patients with pneumonia. This study aimed to build prediction models for 30-day readmission in patients with pneumonia and to analyze the importance of risk factors for readmission, mainly residential greenness.
Methods
Data on 47 risk factors were collected from 22,600 patients diagnosed with pneumonia. Residential greenness was quantified as the mean of normalized difference vegetation index of the district in which the patient resides. Prediction models were built using logistic regression, support vector machine, random forest, and extreme gradient boosting.
Results
Residential greenness was selected from the top 21 risk factors after feature selection. The area under the curves of the four models were 0.6919, 0.6931, 0.7117, and 0.7044. Age, red blood cell distribution width, and history of cancer were the top three risk factors affecting readmission prediction. Residential greenness was the 15th important factor.
Discussion
We constructed prediction models for 30-day readmission of patients with pneumonia by incorporating residential greenness as a risk factor. The models demonstrated sufficient performance, and residential greenness was significant in predicting readmission. Incorporating residential greenness into the identification of groups at high risk for readmission can complement the possible loss of information when using data from electronic health records.
Introduction
Unplanned 30-day readmission rate is a measure of the success of inpatient treatment, 1 and its increase poses a socioeconomic burden, making it an important parameter in public health. 2 According to the 2008 report by Medicare Payment Advisory Commission, Medicare can use approximately 12 billion dollars annually on preventable readmissions. 3 Accordingly, the Centers for Medicare and Medicaid Services (CMS) Hospital Readmission Reduction Program (HRRP) has been tracking readmission rates for certain conditions and penalizing hospitals. Pneumonia has a readmission rate of 15–20% and is the third leading cause among tracked conditions. 4 Therefore, predicting readmission risk of patients with pneumonia is important to allocate limited resources to high-risk patients, thereby reducing readmission rates.
Residential greenness promotes human health through outdoor activities.5–7 High residential greenness is associated with a lower risk of cardiovascular conditions, including acute myocardial infarction and heart failure (HF),8,9 diabetes mellitus,10–12 and mental conditions including depression and anxiety disorders.13–15 It has also been shown to alleviate the effect of air pollution on the human body.16–18 In this regard, the association between chronic obstructive pulmonary disease (COPD), asthma, and rhinitis is being actively researched, and the risks of such respiratory diseases have been shown to decrease.18,19
The effects of residential greenness and pneumonia risk have recently been examined; however, data are scarce. To our knowledge, there have only been a cross-sectional and a cohort study.17,20 No studies have associated the readmission risks of patients with pneumonia with residential greenness, and nor have any presented prediction models incorporated residential greenness information.
Machine-learning models for predicting readmission of pneumonia patients have been presented in numerous studies,21–23 with demographic information and clinical information collectible from electronic medical records (EMR). Among the factors proven by the majority of studies to be significant in predicting readmission are clinical factors, including previous emergency room (ER) or outpatient visits and serum albumin concentration, which represents the severity of the condition during index hospitalization. 24
However, not all variables and data are sufficient for readmission prediction. Globally, as described by Wells et al., data available in clinical data warehouses (CDW) or EMR are not initially collected for clinical research, leading to a high chance of missing values. Failure to deal with them properly results in errors in data analysis. 25 Therefore, it is essential to identify the different factors that can complement possible missing values and simplify collection. Specifically, machine-learning models that utilize only previous test results, demographic information, or other information not collected for the sole purpose of prediction minimize invasive procedures, making them highly useful. 26 Thus far, machine-learning models built for the prediction of readmission have only included data on air pollution and weather information among the environmental factors. 27 However, a model that includes residential greenness as a factor predicting readmission in patients with pneumonia has not yet been reported. If proven significant, residential greenness could serve as a novel, non-invasive predictor, enhancing prediction accuracy even when certain values are difficult to collect.
This study aimed to build prediction models of the 30-day readmission of patients with pneumonia including factors such as residential greenness. We hypothesized that residential greenness is significant in predicting readmission and attempted to develop prediction models with acceptable performance including the factor.
Materials and methods
Research environment
We used a processor with an 8-core CPU running at 2.90 GHz, with 32 GB RAM. The algorithms were executed using Python (version 3.8.0) on a 64-bit CPU. Model training was performed using a framework based on Scikit-learn (version 1.3.2).
Residential greenness
Residential greenness was quantified using the normalized difference vegetation index (NDVI). NDVI is the most commonly used index for analyzing green life and is based on the fact that areas with healthy greenness reflect infrared radiation and absorb red wavelengths better than areas with poor greenness.28,29 The NDVI was calculated using the reflectance levels of near-infrared and red radiation detected by the satellite, according to the following formula:

Assuming that the distribution of NDVI in a particular space does not change significantly over time, 28 we used the NDVI image of the Republic of Korea calculated using spectral data captured in 2019 from NASA's Landsat 8. The data were provided by the Korean Institute of Geoscience and Mineral Resources and downloaded from the Environmental Big Data Platform. 30 The NDVI values were restricted to >0 to minimize the impact of water bodies. 31 The downloaded data were processed using open-source software QGIS 3.36.3-Maidenhead. The NDVI images corresponding to Incheon Metropolitan City were divided by administrative district boundaries (Eup, Myeon, and Dong), and the average NDVI for each district was calculated. The boundaries of the legal administrative districts were obtained from the Ministry of Land, Infrastructure, and Transport's Spatial Information Industry Promotion Agency's open platform (V-World). 32 Figure 1 presents an NDVI image of Incheon Metropolitan City divided by these legal district boundaries.

NDVI image of South Korea (top) and near Incheon Metropolitan City (bottom) viewed via QGIS 3.36.3-Maidenhead. Green color indicates the Incheon Metropolitan City. Dark green lines indicate boundaries of the districts of Incheon Metropolitan City. Brighter colors represent high values (near 1), which indicates rich greenness. Used with permission from Korean Institute of Geoscience and Mineral Resources 30 and V-World. 32 NDVI: normalized difference vegetation index.
Study population, data pre-processing, and statistical analysis
This study was conducted at Gachon University Gil Medical Center in Incheon, South Korea, with data collected retrospectively on patients. The inclusion criteria were male and female patients hospitalized at the Gachon University Gil Medical Center between 1 January 2014 and 30 June 2024, diagnosed with pneumonia (ICD-10 codes J12–J18), and residing in Incheon Metropolitan City at the time of hospitalization. Only patients with a hospital stay of one or more days were included. Patients who died during the study period, were transferred to another hospital or hospice after discharge, or had unclear discharge types (e.g., absconded) were excluded, as a subsequent rehospitalization cannot follow such cases. The first hospitalization of a patient during the study period was considered as an index hospitalization. The data have been accessed for research purposes since 1 September 2024, and were fully anonymized to ensure that individuals cannot be identified.
All clinical and non-clinical data, excluding residential greenness data, were collected from the Clinical Research Data Warehouse (CRDW). The clinical factors included demographic factors, patient history or status, physical measures, and other measurements or test results obtained during hospitalization. The clinical factors included in this study were sex, age at admission, duration of hospital stay, body mass index (BMI), vital signs, laboratory test results, and medical history. Conditions for which medical history was collected were identified according to the Charlson comorbidity index, 33 based on full or abbreviated disease names in the nursing records. Residential greenness was quantified as the mean NDVI of residential districts. The residential district was collected at the administrative district level (Eup, Myeon, and Dong) to align with the NDVI values but was not used in the prediction model. Detailed data are presented in Table 1. All procedures were approved by the Institutional Review Board (GBIRB2024-252). Because of the retrospective nature of the study, the need to obtain informed consent was waived for the individual participants by the Ethical Committee.
Clinical and non-clinical factors of data collected in this study.
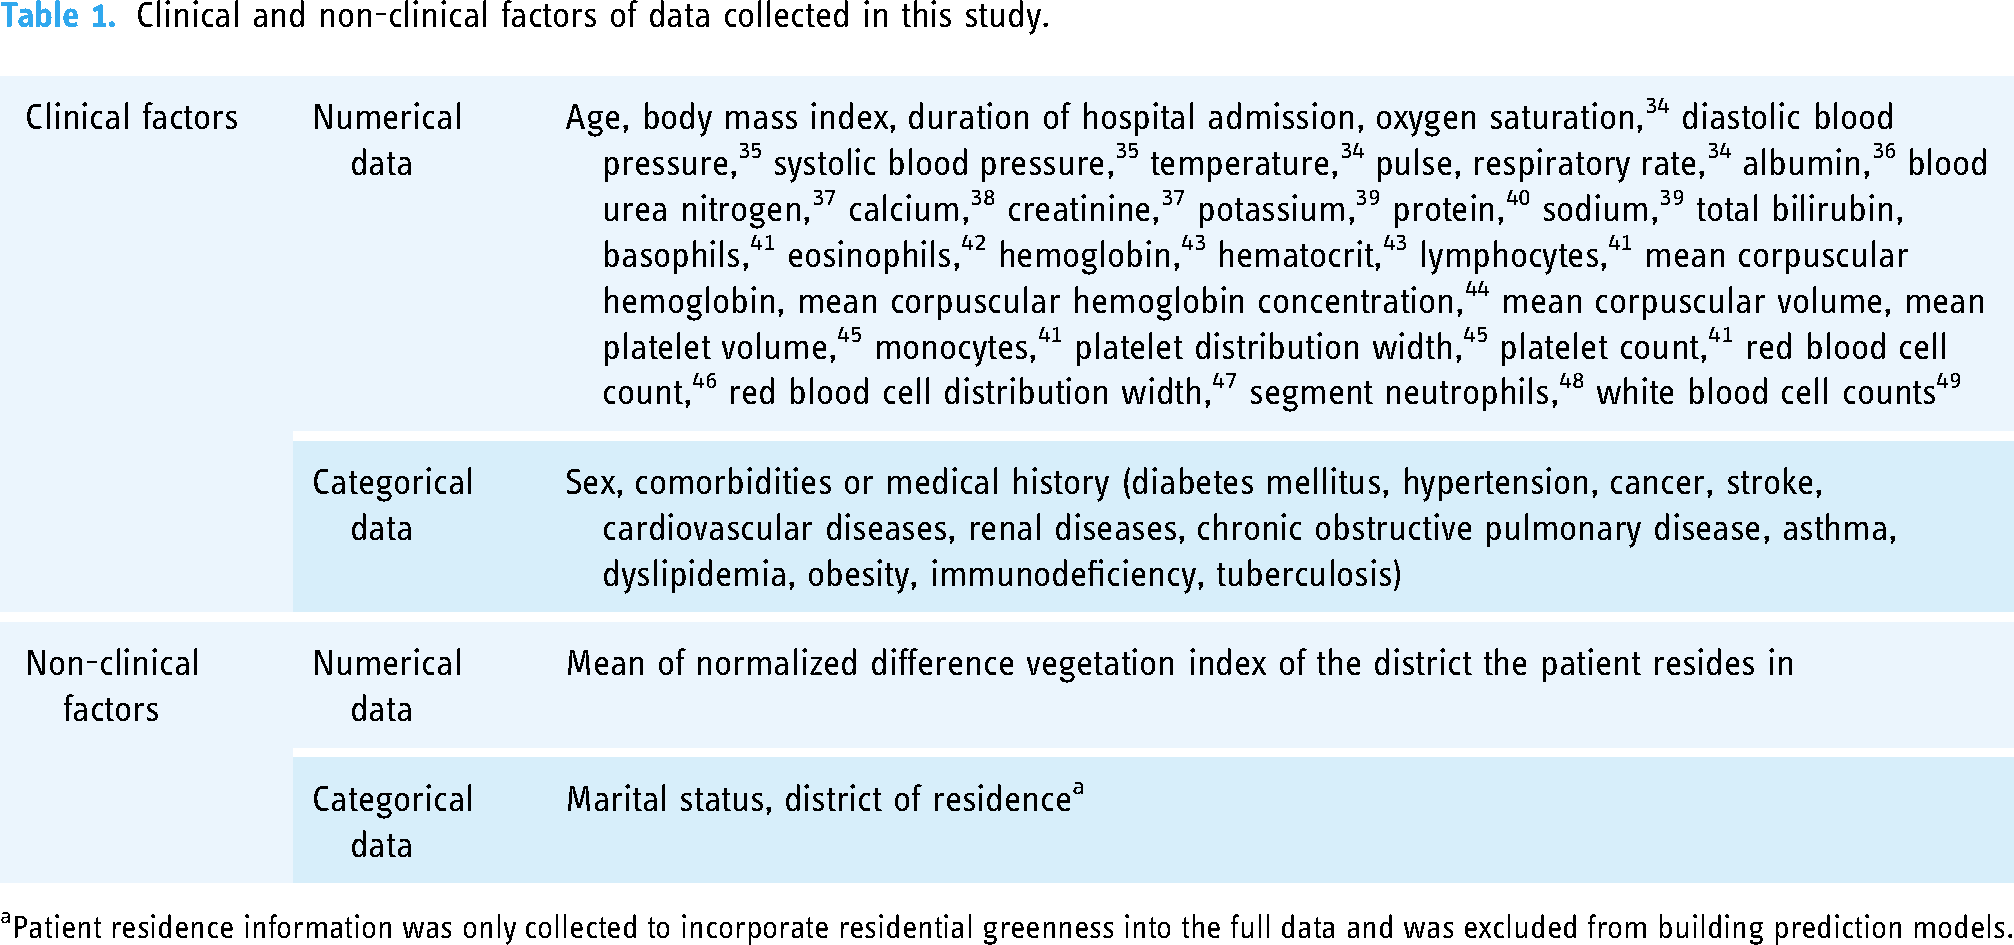
aPatient residence information was only collected to incorporate residential greenness into the full data and was excluded from building prediction models.
The final dataset, consisting of patient information collected from the CRDW and the mean NDVI of residential districts, contained missing values of 2.3%, and attributes including missing values of over 80% were not collected. 50 For attributes with missing values, the mean of the entire dataset for the attribute was used for imputation. All continuous variables were normalized to values between 0 and 1 using a min–max scaler (Scikit-learn).
Patients who were diagnosed with pneumonia as a primary or secondary condition during their index hospitalization and who (1) were re-hospitalized within 30 days and (2) were diagnosed with pneumonia again as the primary or secondary condition during readmission were considered readmitted. Patients who were re-hospitalized within 30 days but were not diagnosed with pneumonia during the re-hospitalization period were not considered readmitted.
Statistical analysis
Collected numerical data were statistically analyzed using an independent sample t-test. All statistical analysis was done using Python 3.8.0. (Pandas, Statsmodels).
Construction and verification of prediction model
Feature selection is the process of selecting a subset of important features to be included in the model construction, thereby increasing the model performance. Decreasing the number of features reduces model complexity, making the model easier to interpret and shortening the training time. In this study, we sequentially applied the filter and wrapper methods to 47 variables collected during the data collection phase.
First, we calculated Pearson's correlation coefficients among the variables. To reduce redundancy, variables with a correlation coefficient greater than 0.8 were compared, and the variable more highly correlated with 30-day readmission was retained. Next, multicollinearity was decreased by calculating the variance inflation factor. Among the wrapper methods, backward elimination was used, and the model with the highest adjusted R2 coefficient was selected for optimal performance.
The dataset was randomly split into training (n = 40,000) and test (n = 10,000) sets at a ratio of 80:20. Scaling, undersampling, and feature selection processes were performed on the training set and subsequently applied to the test set.
Four machine-learning algorithms were employed to achieve the optimal predictive performance: logistic regression (LR), support vector machine (SVM), random forest (RF), and extreme gradient boosting (XGB). LR is used to analyze and predict the relationship between one or more independent variables and a single binary dependent variable. Because it is utilized when the dependent variable is binary, it is useful for predicting the probability of a certain event occurring in clinical and non-clinical fields. 51 SVM is a method for finding a hyperplane for classification and is useful when there are evident classes. It is used in various fields including neurology. 52 RF generates numerous decision trees and combines the results of each tree to retrieve the final classification result. In the clinical field, they are used for disease prediction and classification. 53 Its robustness to missing data and outliers makes it particularly valuable for datasets with such characteristics. 54 XGB is another type of tree-learning algorithm that is a type of gradient boosting. It is less time-consuming and more effective in handling missing data. 55
The hyperparameters were optimized using a Grid Search and five-fold cross-validation on each model. Model performance was evaluated using area under the curve (AUC), precision, recall, accuracy, and the F1 index. Table 2 summarizes the hyperparameters used in each model.
Summary of parameter values in each model.
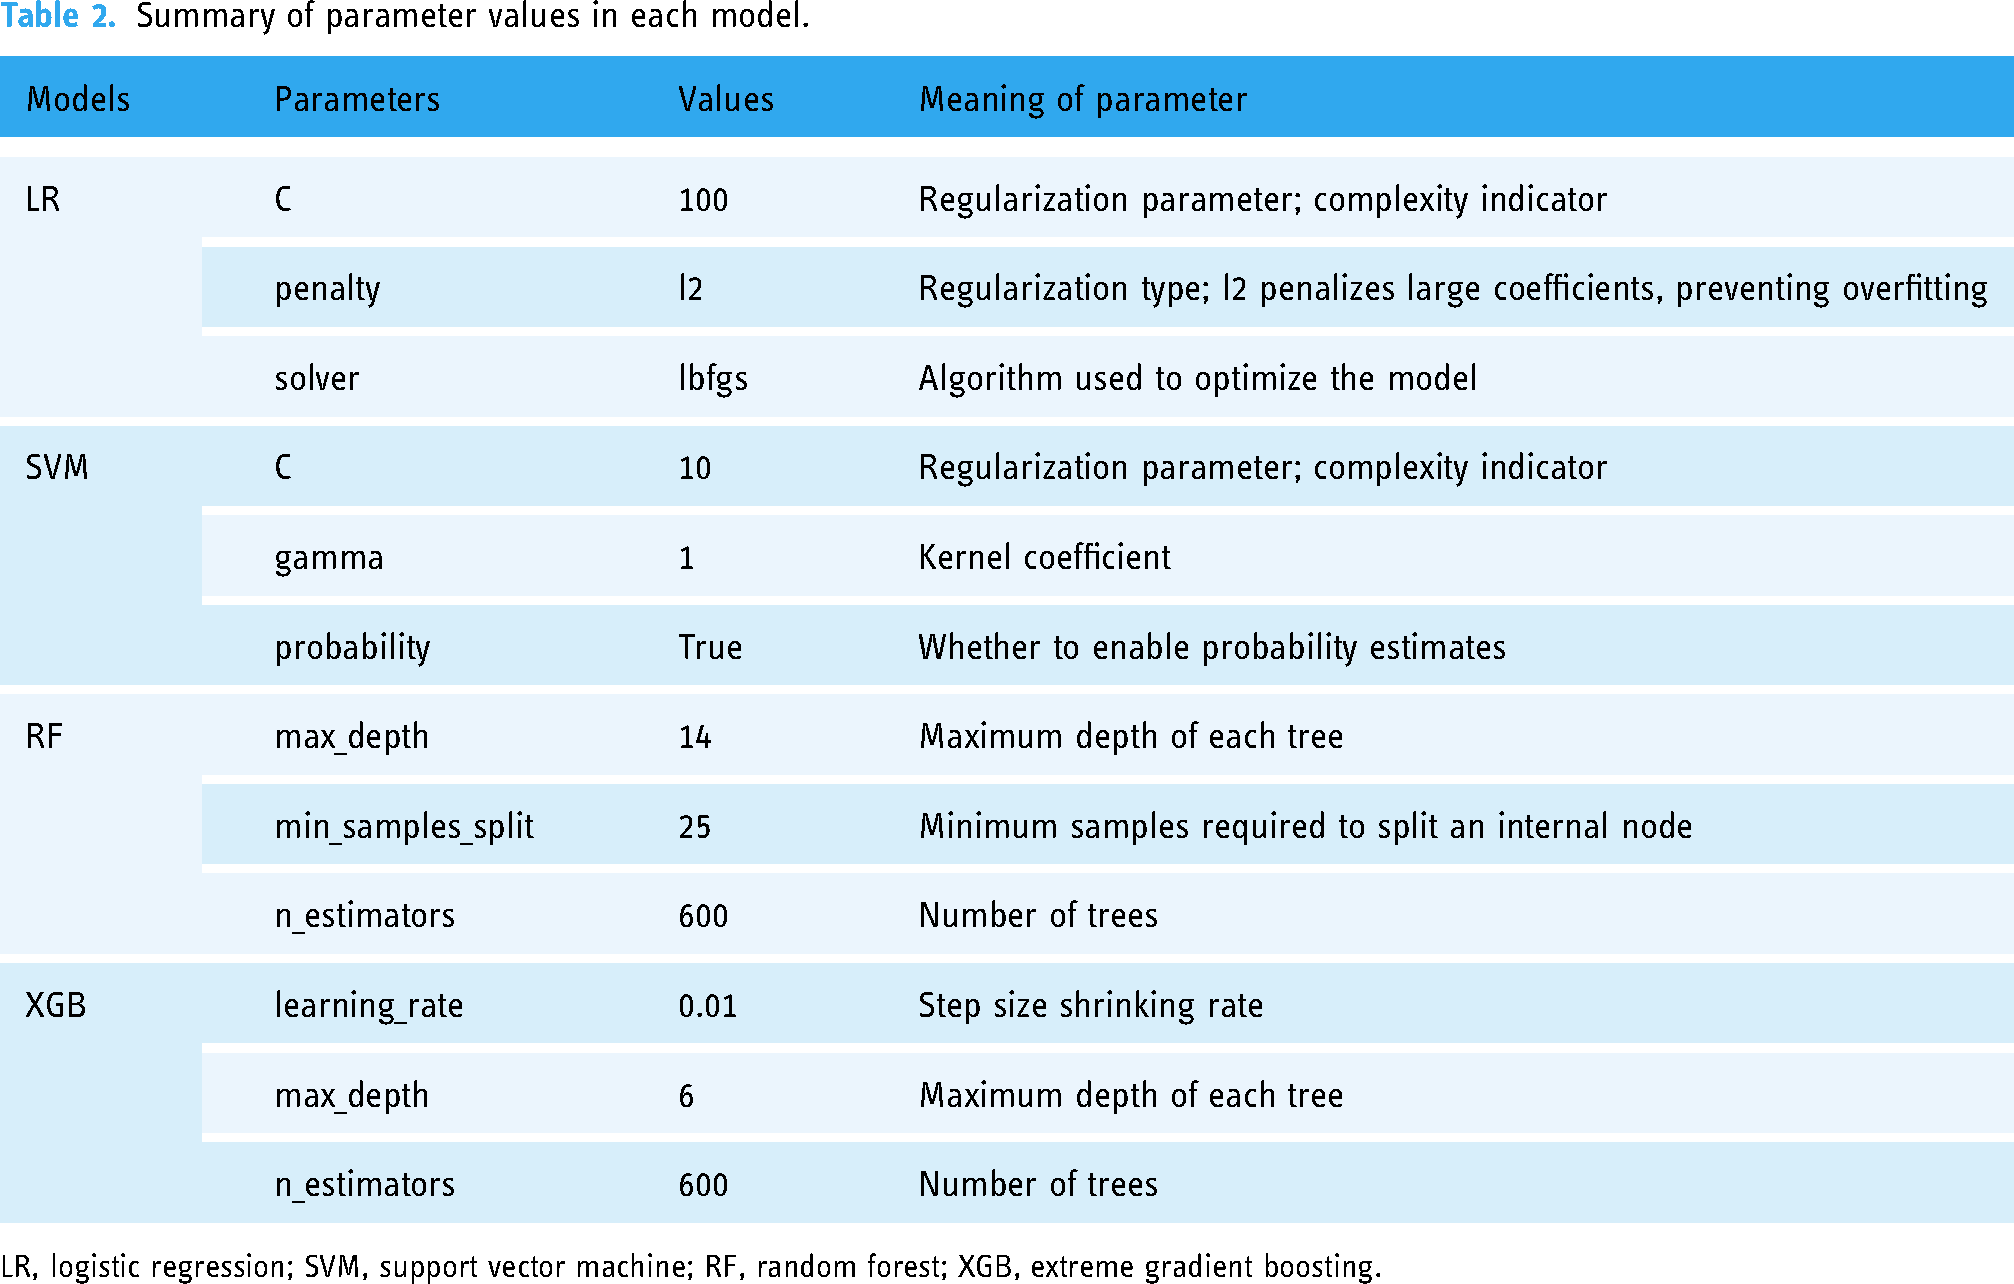
LR, logistic regression; SVM, support vector machine; RF, random forest; XGB, extreme gradient boosting.
Results
Subjects
The study population included 22,600 patients who were admitted after a diagnosis of pneumonia. Of them, 8961 cases among the index hospitalizations resulted in 30-day readmission for pneumonia, comprising 17.9% of all admission cases. Table 3 summarizes the clinical and non-clinical factors of the study population.
Unweighted, baseline summary statistics of the study population.

BMI: body mass index; BP: blood pressure; BUN, blood urea nitrogen; Hb: hemoglobin; Hct: hematocrit; MCH: mean corpuscular hemoglobin; MCHC: mean corpuscular hemoglobin concentration; MCV: mean corpuscular volume; MPV: mean platelet volume; PDW: platelet distribution width; PLT: platelet count; RBC: red blood cell count; RDW: red blood cell distribution width; WBC: white blood cell count; NDVI: normalized difference vegetation index; COPD: chronic obstructive pulmonary disease.
The NDVI was divided based on 166 legal administrative districts (Eup, Myeon, and Dong) in Incheon Metropolitan City, and the average NDVI for each district was calculated. Statistical analysis of the NDVI data segmented by district is presented in Table 4.
Statistical analysis of NDVI segmented into districts of Incheon metropolitan city

NDVI: normalized difference vegetation index; SD, standard deviation; IQR, interquartile range.
Construction and verification of prediction model
Among the 47 variables collected, pairs with Pearson correlation coefficients greater than 0.8 were evaluated. Three variables with a lower correlation with 30-day readmission were excluded. Sixteen additional variables were removed to reduce multicollinearity. The remaining 28 variables were analyzed using a backward regression method, and the combination with the highest adjusted R2 was selected. The final model consisted of 21 variables including NDVI, laboratory test results, sex, age, comorbidities, and medical history.
The performance of each model is represented by the area under the receiver operating characteristic (ROC) curve (AUC), precision, recall, accuracy, and F1-score and compared. Figure 2 shows the ROC curves and AUC of the models, and Table 5 presents the precision, recall, accuracy, and F1 index of the models. Among models, RF demonstrated best performances with an AUC of 0.7117 ± 0.0036 with a statistically significant difference compared to LR (p = 0.0083).

Receiver operating characteristic (ROC) curves and area under ROC with standard deviation for each model. LR: logistic regression; SVM: support vector machine; RF: random forest; XGB: extreme gradient boosting.
Performance metrics according to the models.

LR: logistic regression; SVM: support vector machine; RF: random forest; XGB: extreme gradient boosting; AUROC: area under the receiver operating characteristic curve.
Figure 3 shows the permutation importance of variables. Age, red blood cell distribution width (RDW), and cancer history were shown to be the most significant factors for readmission prediction, and NDVI ranked fifteenth among the 21 selected variables in terms of permutation importance. Table 6 shows the permutation importance in each model of the top three variables and NDVI.

Visualization of mean permutation importance of 21 features. RDW: red blood cell distribution width; BUN: blood urea nitrogen; WBC: white blood cell counts; PDW: platelet distribution width; NDVI: mean normalized difference vegetation index of patient residential district; CVD: cardiovascular disease.
Mean permutation importance of top three features and NDVI.

LR: logistic regression; SVM: support vector machine; RF: random forest; XGB: extreme gradient boosting; RDW: red blood cell distribution width; NDVI: normalized difference vegetation index.
Discussion
CMS defines hospital readmissions under the “all-cause” standard, meaning the reasons for readmission do not need to be related to the cause of index hospitalization. 56 However, many studies argue that this definition may not fully reflect the hospital's treatment capability or the severity of the condition and therefore should be used with caution.57–59
In cases where a patient who was diagnosed with pneumonia was readmitted due to a cause unrelated to pneumonia or other respiratory diseases, it cannot be assumed that (a) environmental factors influenced readmission and (b) the readmission was of any kind related to the index hospitalization. Therefore, this study only considered readmissions when pneumonia was diagnosed during both initial and subsequent hospitalizations. In this study, 8961 (17.9%) of the 50,000 hospital admissions were 30-day readmissions. In a systematic review, Weinreich et al. reported that all-cause readmission rates for patients with pneumonia ranged from 11.8 to 20.8%, with a median of 17.3%. 23 An observational study by Jang and Ahn showed that 8.4% of patients with community-acquired pneumonia (CAP) were readmitted within 30 days, with 37.5% readmitted for reasons related to pneumonia. 60 Considering that previous studies defined readmission using an all-cause definition, this study did not show subjectively high readmission rates. This is likely due to the increased readmission rates during the COVID-19 pandemic and varying access to hospital care.
Thirty-day readmission risks are higher in males and patients with diabetes mellitus, chronic respiratory diseases, chronic kidney diseases, cardiovascular diseases, and cancer. 21 Patient readmissions cause financial problems, including increased expenses and the use of resources by hospitals and patients. Therefore, this study aimed to build a predictive model for 30-day readmission using data available on CRDW and residential greenness, thereby selecting NDVI as a significant factor in predicting readmission. Four models (LR, SVM, RF, and XGB) were used to predict the 30-day readmission of patients with pneumonia. Data including 47 variables were collected, and 21 variables were selected for inclusion in the prediction models. The variables were selected using the filter and backward elimination methods and included sex, age, BMI, admission duration, 10 types of laboratory test results, 6 types of comorbidities or medical history, and mean NDVI of the residential district. All four models exhibited stable performance, with AUC ranging from 0.69 to 0.71.
Among the four models, RF showed the best performance with an AUC of 0.7117 ± 0.0036 and an F1-score of 0.4504 ± 0.0046. This aligns with the results of Michailidis et al., who compared SVMs and RFs to predict patient readmissions. 61 RF is superior to other types of models in predicting patient readmissions.54,62 Owing to its robustness, RF does not have its performance diminished owing to outliers or missing values, making it valuable for analyzing datasets that include such values.63,64 Therefore, it is well suited for machine-learning applications based on data collected from clinical settings.
The adoption of EMR has been promoted owing to advantages such as efficiency, support for large hospitals, simplicity in the data approach, and convenience in patient information transfer. 65 In the United States, the CMS has implemented financial penalties for hospitals that fail to meet specific readmission rate criteria, further encouraging nationwide EMR implementation. 66 Although the analysis of data collected from CRDW or EMR is being actively researched, there are limitations to its preprocessing and usage. Because the data are recorded by humans, some values are absent or lack accuracy, leading to missing values and outliers that must be preprocessed meticulously. In particular, information in free-text format is highly unstructured, making its preprocessing and handling complex. 67 Therefore, it is necessary to identify data that can improve predictive performance when used in combination with data collected from CDW or EMR. Previous studies have incorporated environmental data, which are known to interact with human health, into predictive machine learning.
Ryu et al. designed four models to predict patient readmission, including five environmental factors: PM10, rainfall, humidity, minimum temperature, and maximum temperature. 27 The gradient boosting model showed importance values of 0.0038, 0.0032, 0.0005, 0.0012, and 0.0036, respectively. In this study, the permutation importance of residential greenness in the XGB model is 0.0026, indicating a similar level of importance. While PM10 ranked 19th, the highest among environmental factors, among the 20 variables selected in Ryu et al.'s study, residential greenness ranked 15th among the 21 variables selected in this study. In addition, the AUC of the gradient boosting model was 0.704 in this study, slightly outperforming the value of 0.675 in a previous study. These differences are likely due to the smaller study population size and different definitions of readmission in the previous study, which considered all-cause readmissions, whereas this study focused on pneumonia-related readmissions.
Air quality data are highly subject to seasonal changes owing to natural phenomena and can also be influenced by human activities. 68 Furthermore, environmental policies in specific regions may cause variations in the annual data. 69 Because air quality data are calculated at specific observation points, they have limited granularity. 27 In contrast, residential greenness is less likely to change over time owing to natural or human causes. 28 Moreover, NDVI can be easily collected and processed through satellite images, offering flexible granularity and a low risk of missing data, making it highly suitable for use in predictive models, alongside clinical data from EMR.
Among clinical factors, age, RDW, and cancer history were the most significant. Hatipoğlu et al. identified age as a key factor in predicting 30-day readmission rates in patients with pneumonia. 22 In contrast, Fang et al. found no significant age-based differences in readmission rates for pneumonia after analyzing three studies. 21 However, the analyzed studies only included patients aged 65 and older, which likely explains the different results from this study, which considered patients of all ages. RDW, a laboratory test result, is a coefficient that indicates the variation in red blood cell size. It is often used to diagnose conditions such as anemia, and its association with the risk and prognosis of diseases such as cancer, diabetes mellitus, COPD, and CAP has been reported. 70 Notably, an increase in RDW is strongly correlated with increases in C-reactive protein (CRP) level and erythrocyte sedimentation rate (ESR), which are markers of inflammation. 71 Therefore, it is reasonable to conclude that RDW is one of the most significant laboratory test parameters for predicting readmission in patients with pneumonia. Cancer history has been demonstrated to be important in readmission prediction for pneumonia in various studies.60,72,73 Cancer history is more frequently reported in readmitted patients60,74 and the time between index hospitalization and readmission was shorter in patients with cancer history than in patients without it. 75
This study had some limitations. First, the model was built using the average NDVI for each region instead of units with smaller granularity. Many studies on the relationship between NDVI and health outcomes use the full address of the patient and calculate the average NDVI within 300, 500, or 1000 m of the residence. However, this study did not process the NDVI to be specific to the patient's full address, resulting in less precision in residential greenness compared to previous studies. Notably, the use of personal information at a level that can identify individuals for medical or research purposes is legally restricted depending on the nation. Therefore, it is not always possible to collect detailed addresses. Previous studies have calculated the average NDVI at the city or census level, and have reported that NDVI with this level of granularity is also sufficiently meaningful.76–78 Similarly, in the present study, the adjusted R2 was maximized in the model that included the average NDVI by district, suggesting that this was a significant variable for predicting readmission. Therefore, this study is valuable because it used the most specific data available to derive optimal results, even when the information was not fully available. Nonetheless, there is a possibility of improvement if finer granularity of NDVI data can be obtained. Second, while the overall performance of AUC between 0.69 and 0.71 is acceptable, it is not superior compared to other predictive studies. This is likely due to the lack of precision in the residential greenness data, which was our first limitation, and the exclusion of some variables, such as alcohol consumption and smoking status, due to incomplete nursing records. However, RF is suitable for data with missing values, making it appropriate for identifying high-risk patients. Finally, the effects of COVID-19 were not considered in this analysis. Rich residential greenness is known to mitigate the effect of air pollution on the human body.16–18 Therefore, the restriction of outdoor activities during the pandemic possibly reduced the impact of residential greenness on the incidence and readmission rates of pneumonia. Public health measures could also have affected pneumonia incidence and patient readmission. Subsequent research incorporating factors such as outdoor exposure in predictive models can demonstrate better accuracy.
Conclusion
We used residential greenness data and data from the CRDW to predict 30-day readmission rates of patients with pneumonia. Residential greenness, quantified as NDVI and averaged at the administrative district level, had significant permutation importance. The machine-learning model, which included vital signs, laboratory test results, demographic variables from the CRDW, and greenness data, achieved an AUC of 0.69–0.71, demonstrating acceptable performance. The RF recorded the highest AUC and F1-score, demonstrating its robustness in handling missing values. NDVI, which is collected and processed from satellite images, is highly applicable to machine learning. Its non-invasive nature makes it an efficient factor in predictive models. The readmission prediction model using residential greenness and CRDW data presented in this study is expected to improve the accuracy of identifying groups at high risk for readmission, thus aiding in the efficient allocation of research and expenses during hospitalization.
Footnotes
Contributorship
Kwang Gi Kim contributed to the study conception and design. Material preparation, data collection, and analysis were performed by Seohyun Choi, Young Jae Kim, and Seon Min Lee. The first draft of the manuscript was written by Seohyun Choi and all authors commented on the previous versions of the manuscript. All authors read and approved the final manuscript.
Declaration of conflicting interests
The authors declared no potential conflicts of interest with respect to the research, authorship, and/or publication of this article.
Ethical approval
This study was conducted in accordance with the principles of the Declaration of Helsinki. This study was approved by the Institutional Review Board of Gachon University Gil Medical Center (GBIRB2024-252). Because of the retrospective nature of the study, the need to obtain informed consent was waived for the individual participants by the Ethical Committee.
Funding
The authors disclosed receipt of the following financial support for the research, authorship, and/or publication of this article: This work was supported by the GRRC program of Gyeonggi province [GRRC-Gachon2023 (B01), Development of AI-based medical imaging technology].
Guarantor
Kwang Gi Kim.