
Abstract
Objectives
The high rate of rehospitalization following catheter ablation in atrial fibrillation (AF) patients remains a significant clinical challenge. This study aimed to develop a novel prediction model based on Kolmogorov-Arnold Networks (KANs) for postoperative rehospitalization and explore its clinical potential. Additionally, interpretability methods were employed to identify key risk factors.
Methods
Real-world clinical data from 430 AF patients who underwent catheter ablation were collected. Core predictors were selected through feature engineering. A KANs-based prediction model was constructed and compared with seven traditional machine learning models, including Support Vector Machines and Random Forests. Model performance was systematically evaluated using metrics such as accuracy and recall. The SHapley Additive exPlanations framework was applied to interpret feature contributions and conduct individual case analyses.
Results
The KANs model demonstrated superior predictive performance, achieving an area under the curve of 0.85, representing a 12% improvement over the suboptimal model. Key predictors included Low-Density Lipoprotein Cholesterol and Total Cholesterol. Individual case analyses revealed that the model effectively identified high-risk patients through biochemical indicator patterns, enhancing its interpretability.
Conclusions
This study is the first to validate KANs in predicting postablation rehospitalization, enabling precise predictions and identifying critical biomarkers, thereby laying the foundation for improved postoperative management.
Keywords
Introduction
Atrial fibrillation (AF) is one of the most prevalent arrhythmias globally, and it is linked to increased stroke, heart failure and all-cause mortality.1,2 Catheter ablation is a standard treatment for recurrent AF, particularly for patients who have poor responses to or cannot tolerate antiarrhythmic drugs.3–5 Although catheter ablation provides significant benefits in improving patients’ quality of life and reducing arrhythmia burden, postprocedural recurrence and complications may still lead to readmission.6,7 Postoperative readmission not only exacerbates patients’ health burden but also strains medical resources.8–10 Furthermore, known health disparities and clinical vulnerabilities exist within this population; for instance, female patients, as well as those with comorbidities such as diabetes and chronic pulmonary disease, are disproportionately more vulnerable to postprocedural readmission. 6 Therefore, accurately predicting the risk of postoperative readmission in AF patients is crucial for optimizing treatment plans and improving patient prognosis.
Previous studies have primarily identified risk factors associated with recurrence and complications after catheter ablation in patients with AF using statistical models,11,12 rather than developing predictive models. For instance, RU et al. 13 applied multivariate logistic regression to identify predictors of postoperative complications and 30-day readmission, while Freeman et al. 14 explored predictors of postablation complications, 30-day readmission and emergency room evaluations, indicating that readmission risk is closely linked to postoperative complications. Although these studies demonstrate the correlation between various risk factors and readmission, their predictive power remains limited in terms of objectivity and accuracy, as they depend heavily on clinicians’ empirical judgment and subjective assessment.
With the ongoing advancement of machine learning technology, researchers have increasingly utilized machine learning algorithms to develop disease prediction models using multimodal data, particularly to address complex nonlinear relationships.15,16 Machine learning techniques have become crucial tools in addressing medical problems.17–19 These algorithms can automatically learn nonlinear relationships between variables from data and perform better in modeling complex interactions.20,21 For instance, Man et al.22,23 applied various machine learning methods to predict the 30- and 90-day postoperative readmission of AF patients, achieving favorable results. Zhou et al. 24 introduced CNNSurv, a deep Convolutional Neural Network (CNN)-based model, to predict the recurrence of AF. However, due to the high heterogeneity of clinical data and growing complexity of clinical demands, current machine learning methods remain insufficient to meet medical requirements. In terms of interpretability, the “black-box” nature of these models, especially in the medical field, complicates clinicians’ understanding of the decision-making process, thereby hindering the model's application and acceptance.25,26
Accordingly, the primary objective of this study is to develop and validate a prediction model using Kolmogorov–Arnold Networks (KANs) for hospital readmission following AF surgery. KANs is a neural network structure based on the Kolmogorov-Arnold representation theorem, capable of automatically learning higher-order nonlinear interactions among features with strong generalization ability. Experimental results demonstrate that the proposed model provides accurate readmission predictions and performs comparably to traditional machine learning models across several evaluation metrics, using only six readily available clinical features. To further improve the model's interpretability, this study employs SHapley Additive exPlanations (SHAP) to quantify the contribution of each feature to prediction outcomes,
27
revealing the relative importance of each feature in predicting readmission risk after AF. SHAP analysis not only enhances model transparency but also provides clinicians with clearer decision support. Specifically, the contributions of this study are as follows:
This study is the first to apply the KANs model to the prediction of readmission following AF ablation. Its superiority was confirmed by comparing performance across multiple evaluation metrics with traditional machine learning models. SHAP analysis enhanced the model's interpretability and provided insights into the relative importance of each feature. Case-specific interpretations further illustrated how these features affected the model's predictive outcomes. A supplementary experiment was conducted using a reduced training dataset. Despite the smaller sample size, the KANs model maintained comparable or better overall performance than the other models, indicating its potential for effective application in small-sample clinical settings.
Methods
Study design
This study aimed to develop a predictive model based on the KANs to identify outcomes in patients with AF following catheter ablation, and to evaluate its performance against several conventional machine learning models.
The experimental design consisted of the following stages: First, a structured dataset was constructed using real-world retrospective clinical data, with routine postprocedure examination indicators selected as input features. Second, the KANs model was adopted as the primary model, while several traditional machine learning models were used as comparators to assess predictive performance under identical data conditions. To ensure objectivity and robustness, multiple evaluation metrics were applied, including accuracy, recall, F1-score and area under the curve (AUC). Finally, the interpretability of the KANs model was assessed using SHAP analysis to verify its clinical transparency and applicability.
Data acquisition
This study was a retrospective analysis spanning from 2023 to 2024, and patient data were obtained from The First Affiliated Hospital of University of Science and Technology of China (Anhui Provincial Hospital). All data were obtained through the hospital's electronic medical record system, including relevant clinical data of each patient. These data were used for model development and internal validation. Readmission labels were tracked using the patient's electronic medical record ID and were denoted as 0 and 1, where 1 indicates readmission and 0 indicates no readmission.
The primary objective of this study was to predict postprocedure readmission in AF patients. Readmission was defined as having at least one recorded readmission within three months after discharge following the initial catheter ablation. To eliminate confounding factors, the following patients were excluded from the study:
Patients who had recently undergone other major procedures; Patients with psychiatric or cognitive disorders interfering with treatment compliance; Patients under eighteen years of age; Patients with severe hepatic or renal insufficiency, or malignant tumors; Patients with acute or severe infections.
Data were ultimately collected on 430 patients who met the requirements of the trial, of which 46 patients met the criteria for readmission. This study was approved by the Medical Ethics Committee of the First Affiliated Hospital of University of Science and Technology of China (Anhui Provincial Hospital), with approval number 2024-RE-399. Informed consent was waived due to the retrospective nature of the study.
Data preparation
In this experiment, data on 13 characteristics and readmission labels for 430 patients were collected from the electronic medical record system, with all characteristics complete. The characteristic data for each patient included a broad range of laboratory test results, forming the basis for subsequent disease prediction analysis. The readmission label accurately indicates whether a patient experienced a readmission event and serves as the target variable for model training. The completeness of the data simplifies processing and eliminates bias from missing values, thereby enhancing the reliability of the analysis results.
As shown in Table 1, baseline characteristics were organized and counted for 430 patients who were readmitted and not readmitted after undergoing catheter ablation. Results for all continuous variables are presented as median and interquartile range (IQR).
Baseline data for analysis.

Note. TC: Total Cholesterol; LDL-C: Low-Density Lipoprotein Cholesterol; HDL-C: High-Density Lipoprotein Cholesterol; AST/ALT: Ratio of Aspartate Aminotransferase to Alanine Aminotransferase; K: Potassium; Na: Sodium; Ca: Calcium; Mg: Magnesium; Cr: Creatinine; BUN: Blood Urea Nitrogen; BG: Blood Glucose; cTn: Cardiac Troponin; WBC: White Blood Cell Count.
Feature selection is a crucial step in machine learning model development. 28 Based on previous studies12,29–31 and consultations with clinical experts, the six characteristics selected for the study were TC, HDL-C, LDL-C, AST/ALT, K, and Na.
Considering the imbalance in readmitted and nonreadmitted patients, the dataset imbalance may cause the model to be biased toward learning features for the majority class, affecting prediction performance for the minority class. To address this, the study employed resampling methods: Dataset I uses an undersampling method, where 46 samples are randomly selected from the nonreadmitted patients and combined with the readmitted patient samples to create a balanced dataset. A random division of Dataset I was performed, where 80% (n = 73) was used as a training set and 20% (n = 19) was used for model testing, thereby ensuring identical healthcare settings, eligibility criteria and variable definitions across both sets. Additionally, continuous features were standardized prior to model training. All data were derived from real clinical datasets to ensure the authenticity and reliability of the data. By including all available readmitted cases, the resulting sample size is sufficient to address the research question, as overfitting is effectively mitigated by the concise six-feature input and the robust generalization of KANs.
To further validate the potential of the KANs model on small sample datasets, the training set was reduced to 40% (n = 36), resulting in Dataset II, which was then used for model training and testing. The data processing flow is illustrated in Figure 1.

The data preparation process includes the collection and delineation of data.
Model construction
Kolmogorov-Arnold networks
In the evolution of neural networks, the Multi-Layer Perceptrons (MLPs), as a foundational architecture, has been widely used in fundamental machine learning tasks, such as image recognition and data classification, due to its fully connected topology. However, KANs construct their network structure based on a unique mathematical theoretical framework. KANs may outperform MLPs in specific application areas in the future and become a key model for solving complex problems, potentially driving breakthroughs and innovations in neural network technology. 32
KANs, as an innovative neural network, are inspired by the Kolmogorov-Arnold representation theorem, which states that any multidimensional continuous function can be represented as a combination of multiple univariate continuous functions.
Unlike MLPs, which set fixed activation functions at nodes, KANs introduce learnable activation functions on weights (edges). In contrast to traditional linear weights, each weight parameter is replaced by a univariate function (parameterized as a spline function), which enhances the network's flexibility in processing data, allows it to dynamically adjust the activation method based on different data features, and improves the model's representational capacity. Specifically, KANs perform nonlinear transformations of the inputs at each layer, with the activation function being dynamically adjusted based on the training process. 33 The general modeling framework is shown in Figure 2.

The basic model architecture of the Kolmogorov-Arnold networks.
Selection of comparison models
To validate the effectiveness of the methodology in this study, several comparison models were selected, including traditional machine learning models such as Logistic Regression (LR), Support Vector Machines (SVM), Random Forest (RF), Decision Tree (DT), K-nearest Neighbors (KNN), eXtreme Gradient Boosting (XGBoost), and Naive Bayes (NB). The LR classifier was implemented using the LogisticRegression class in the scikit-learn library; the SVM classifier was implemented using the SVC class; the RF classifier was implemented using the RandomForestClassifier class; the DT model was implemented using the DecisionTreeClassifier class; the KNN classifier was implemented using the KNeighborsClassifier class; and the XGBoost classifier was implemented using the XGBClassifier class in the XGBoost library. The NB model was implemented using the GaussianNB class in the scikit-learn library. By comparing these models, we focus on analyzing the advantages of this method in terms of classification performance, adaptability, and generalization ability, providing support for its potential in clinical applications. Hyperparameter optimization for the selected machine learning models was performed using stochastic search. 34
Results
Experimental setup
Hyperparameter settings
The model is trained and tested, and the machine learning model is tuned using hyperparameters to ensure the stability of model training and optimization of performance, and the specific settings for hyperparameter selection regarding the KANs model are shown in Table 2.
Hyperparameter value set for Kolmogorov-Arnold Networks.

Evaluation metrics
To comprehensively assess the model's performance on the test set, the following evaluation metrics were selected: AUC, accuracy, precision, recall, F1 score, and specificity.
35
The formulas are as follows:


TP: a readmitted patient correctly classified as readmitted; FP: a nonreadmitted patient incorrectly classified as readmitted; TN: a nonreadmitted patient correctly classified as nonreadmitted; and FN: a readmitted patient incorrectly classified as nonreadmitted. 36
Model performance comparison
Results of dataset
After training and debugging, Figure 3(a) shows the AUC values for KANs and other machine learning models on the test set, reflecting each model's ability to predict readmission after patient ablation. To comprehensively evaluate model performance, we also plotted the Precision-Recall (PR) curve, as shown in Figure 3(b). The performance of the eight models varied significantly, with KANs achieving excellent results on the test set (AUC = 0.85, AP = 0.91), demonstrating its superior ability to predict readmission risk. XGBoost followed closely (AUC = 0.76, AP = 0.82). The other models performed poorly, particularly SVM (AUC = 0.45, AP = 0.67). The credibility of the predictive models was quantitatively assessed by visualizing the relationship between the predicted probabilities and the frequency of real events. As shown in Figure 4, the ideal calibration model would lie along the diagonal.
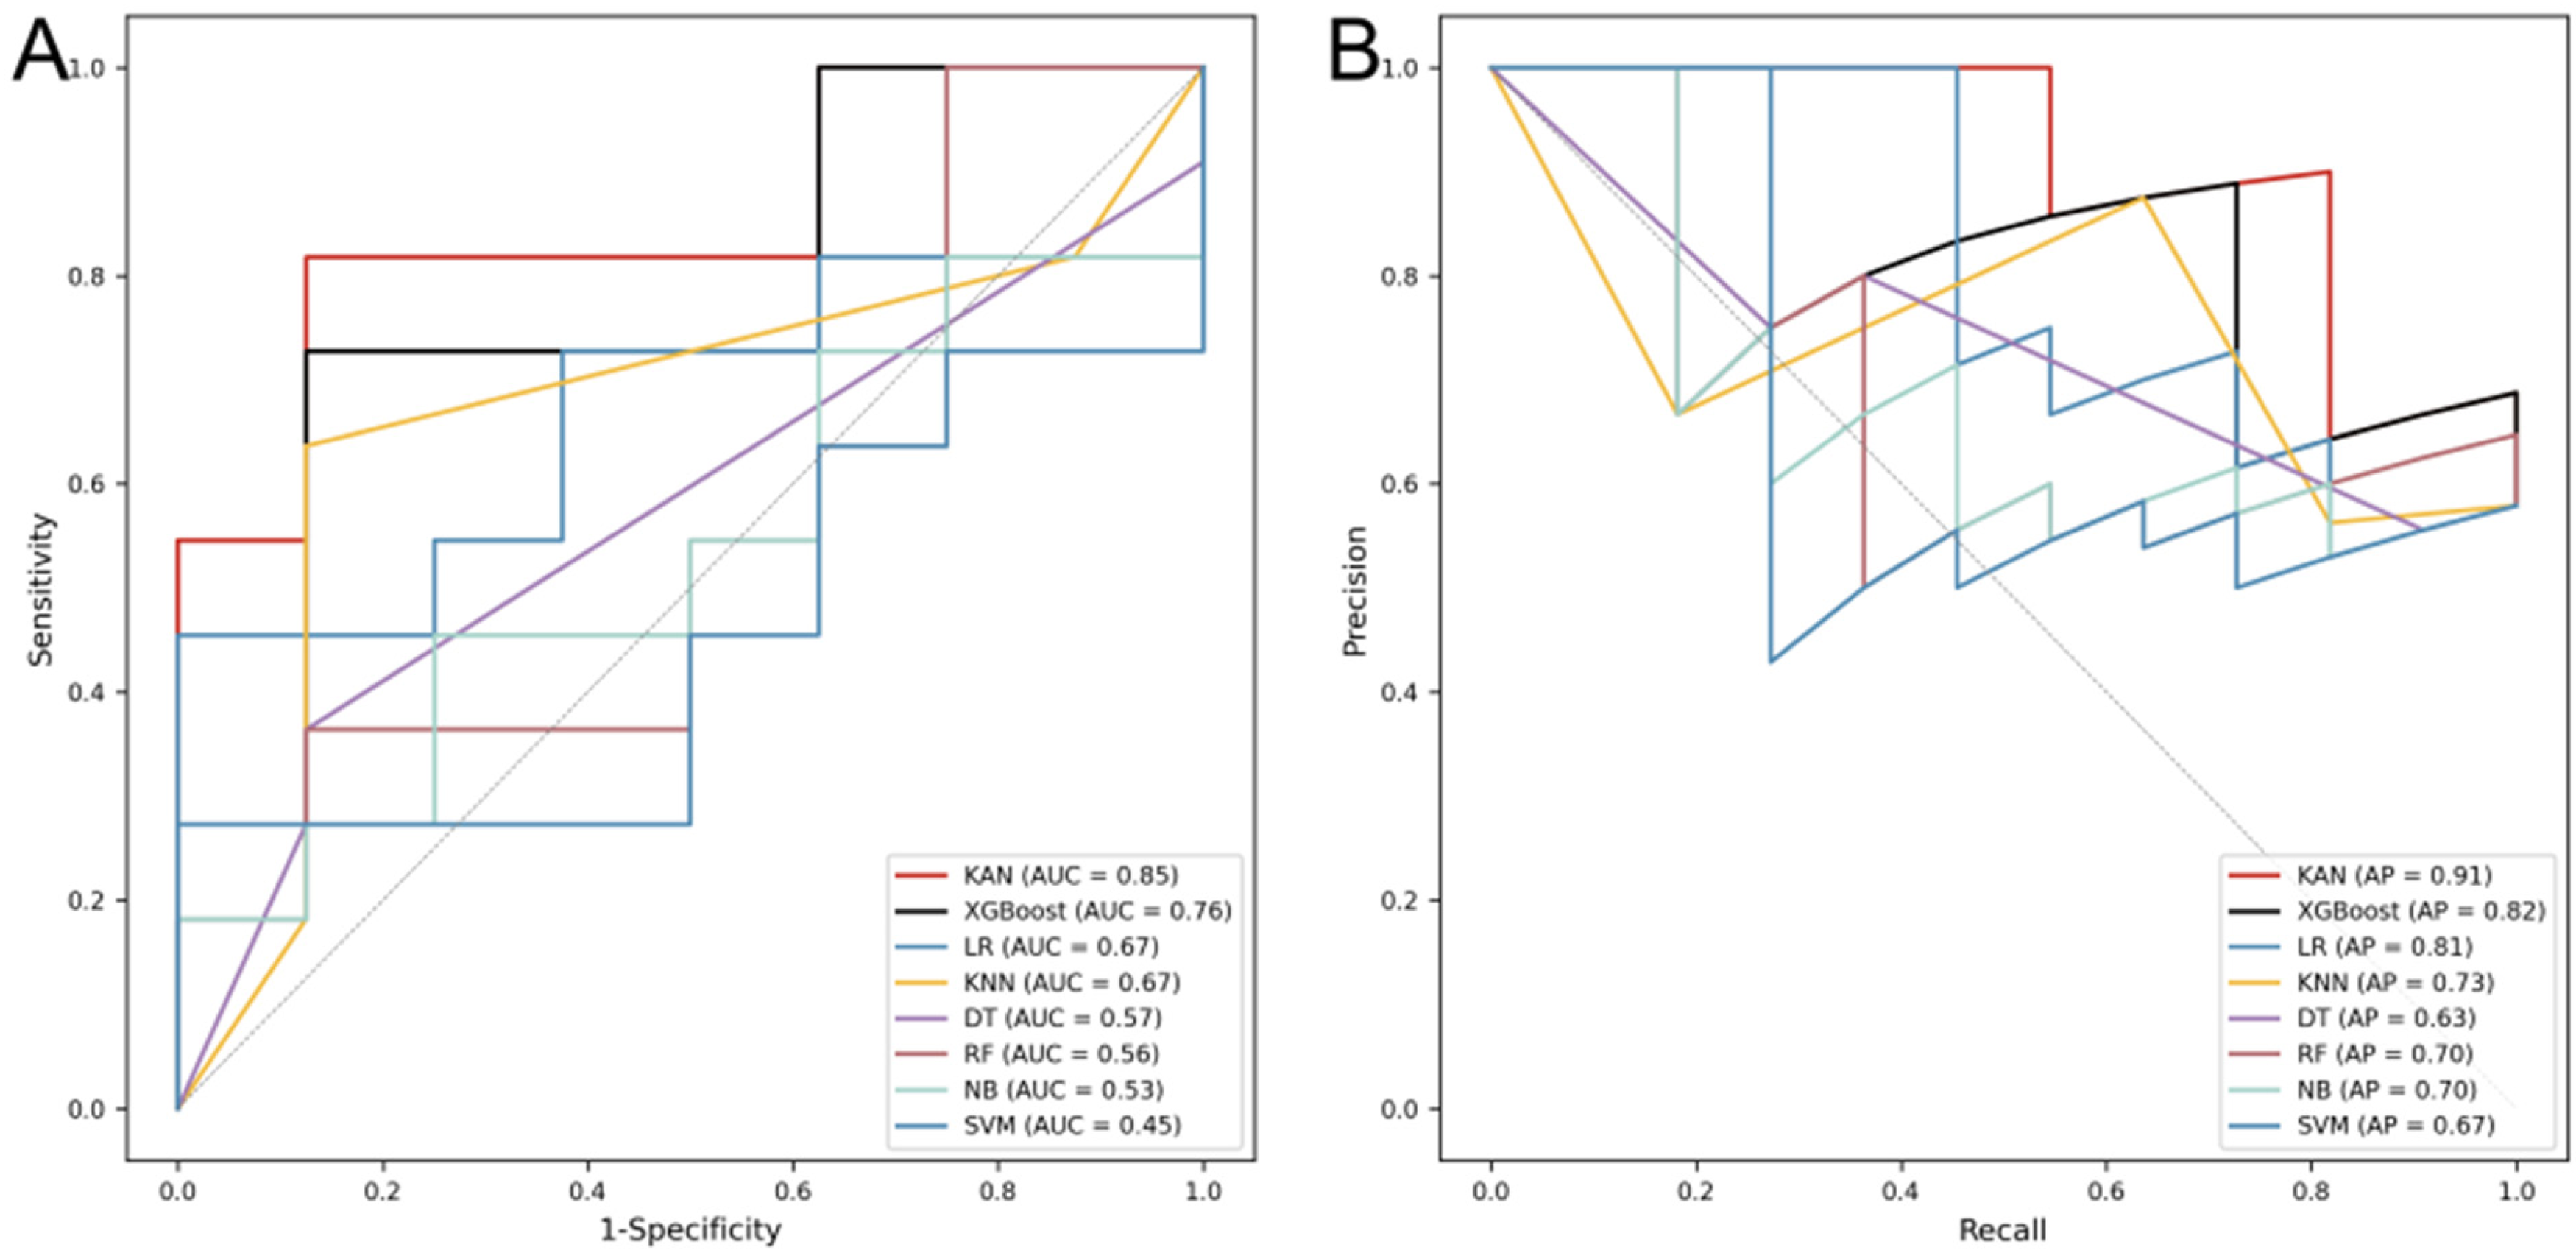
AUC and PR values for Dataset I on different models.
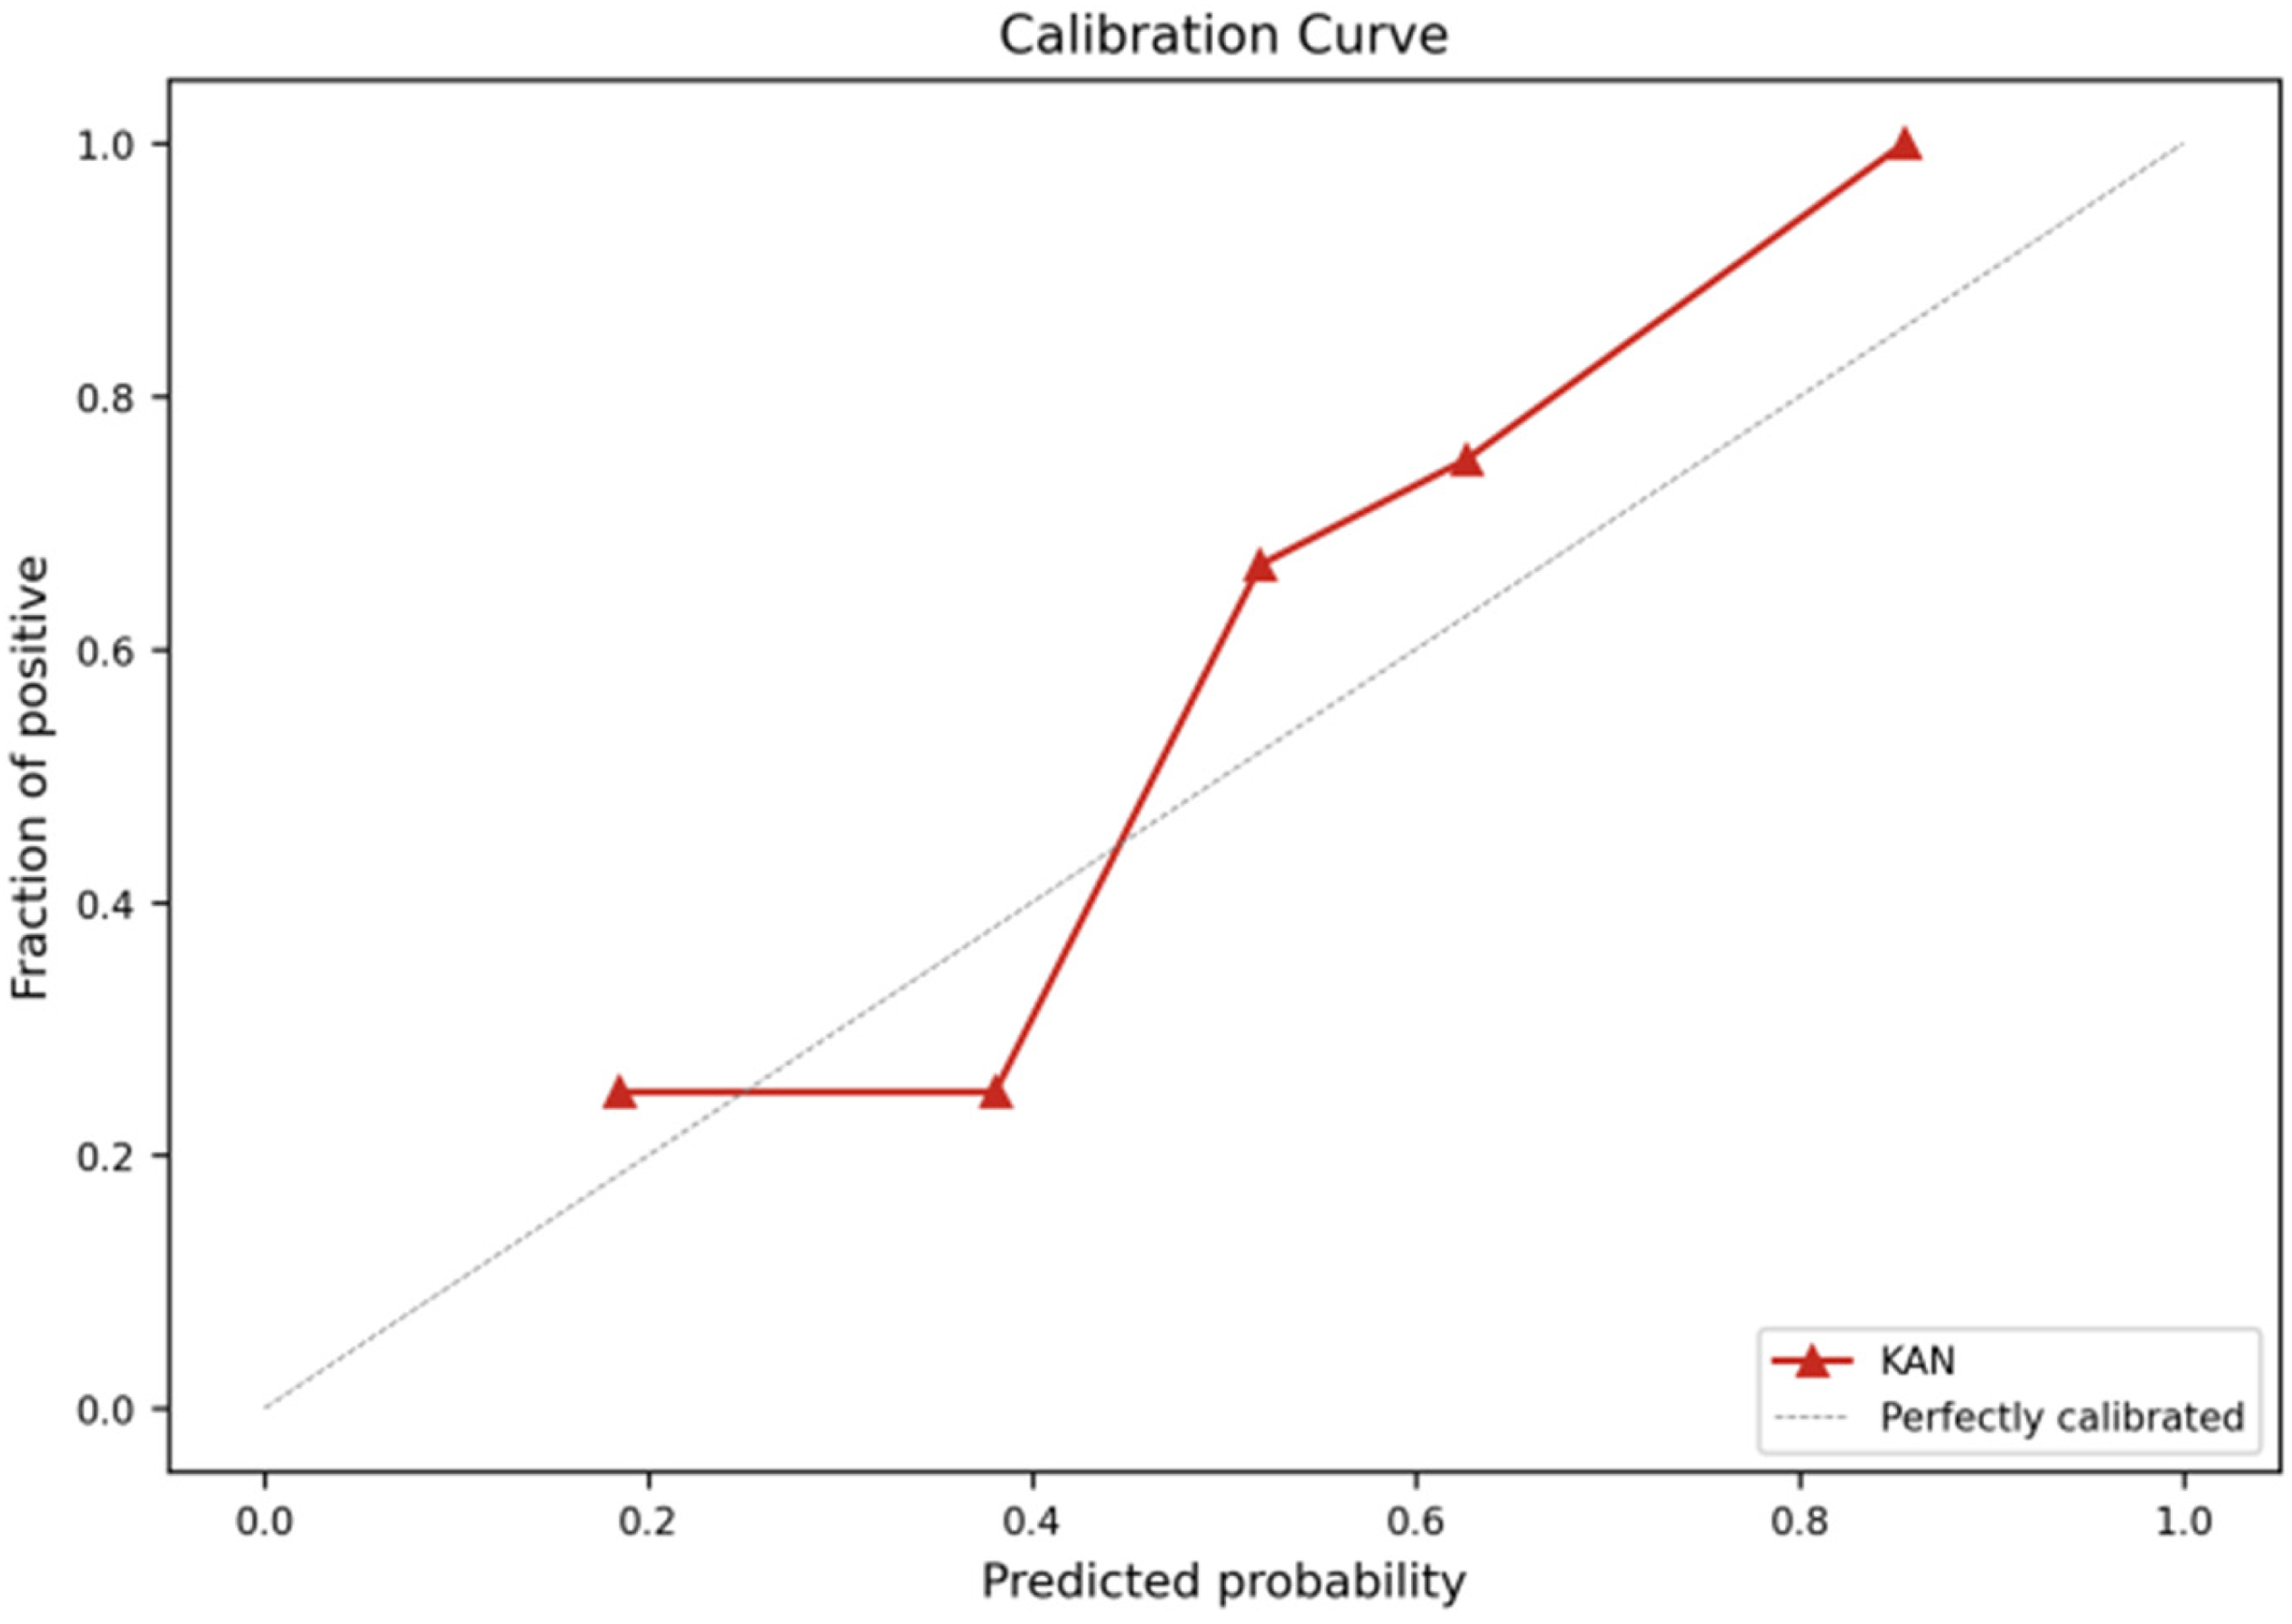
The probability calibration curve of a model.
Table 3 presents the performance of the eight models on the test set across each metric. Compared to other machine learning models, the KANs model demonstrates consistently strong performance across all evaluated metrics. Specifically, the KANs model achieves high scores in accuracy (0.842, 95% CI: 0.624–0.945), precision (0.900, 95% CI: 0.596–0.982), recall (0.818, 95% CI: 0.523–0.949), F1 score (0.857, 95% CI: 0.640–0.950), and specificity (0.875, 95% CI: 0.529–0.978), generally exceeding those of the other models. The metrics bar chart in Figure 5 shows that XGBoost's performance closely follows that of KANs, and it matches KANs in terms of specificity. In contrast, the performance of KNN, SVM, NB, and DT is relatively weaker overall, although KNN achieves a specificity of 0.875.

The visualization of performance metrics for Dataset I across different models.
Detailed metrics for Dataset I on different models.

To further evaluate the performance of KANs and XGBoost, we employed five-fold cross-validation using F1 scores as the evaluation metric. Figure 6 shows the distribution of F1 scores for KANs and XGBoost across the five folds. As shown, the F1 scores of both models are presented as box plots, reflecting the variability in performance across different data partitions. KANs demonstrates a favorable balance between precision and recall.

Comparison of KANs and XGBoost based on five-fold cross-validation results.
Results of Dataset II
In the previous experiments, we first used Dataset I for training and predicting with various machine learning models. The initial configuration of Dataset I was 80% (n = 73) for training and 20% (n = 19) for testing, with the model performing well under this setup. To further assess the model's performance on a small sample dataset, we reduced the training set size to 40% (n = 36) while keeping 20% (19) of the data for testing. The resulting AUC curves from training and testing with this data configuration are shown in Figure 7.
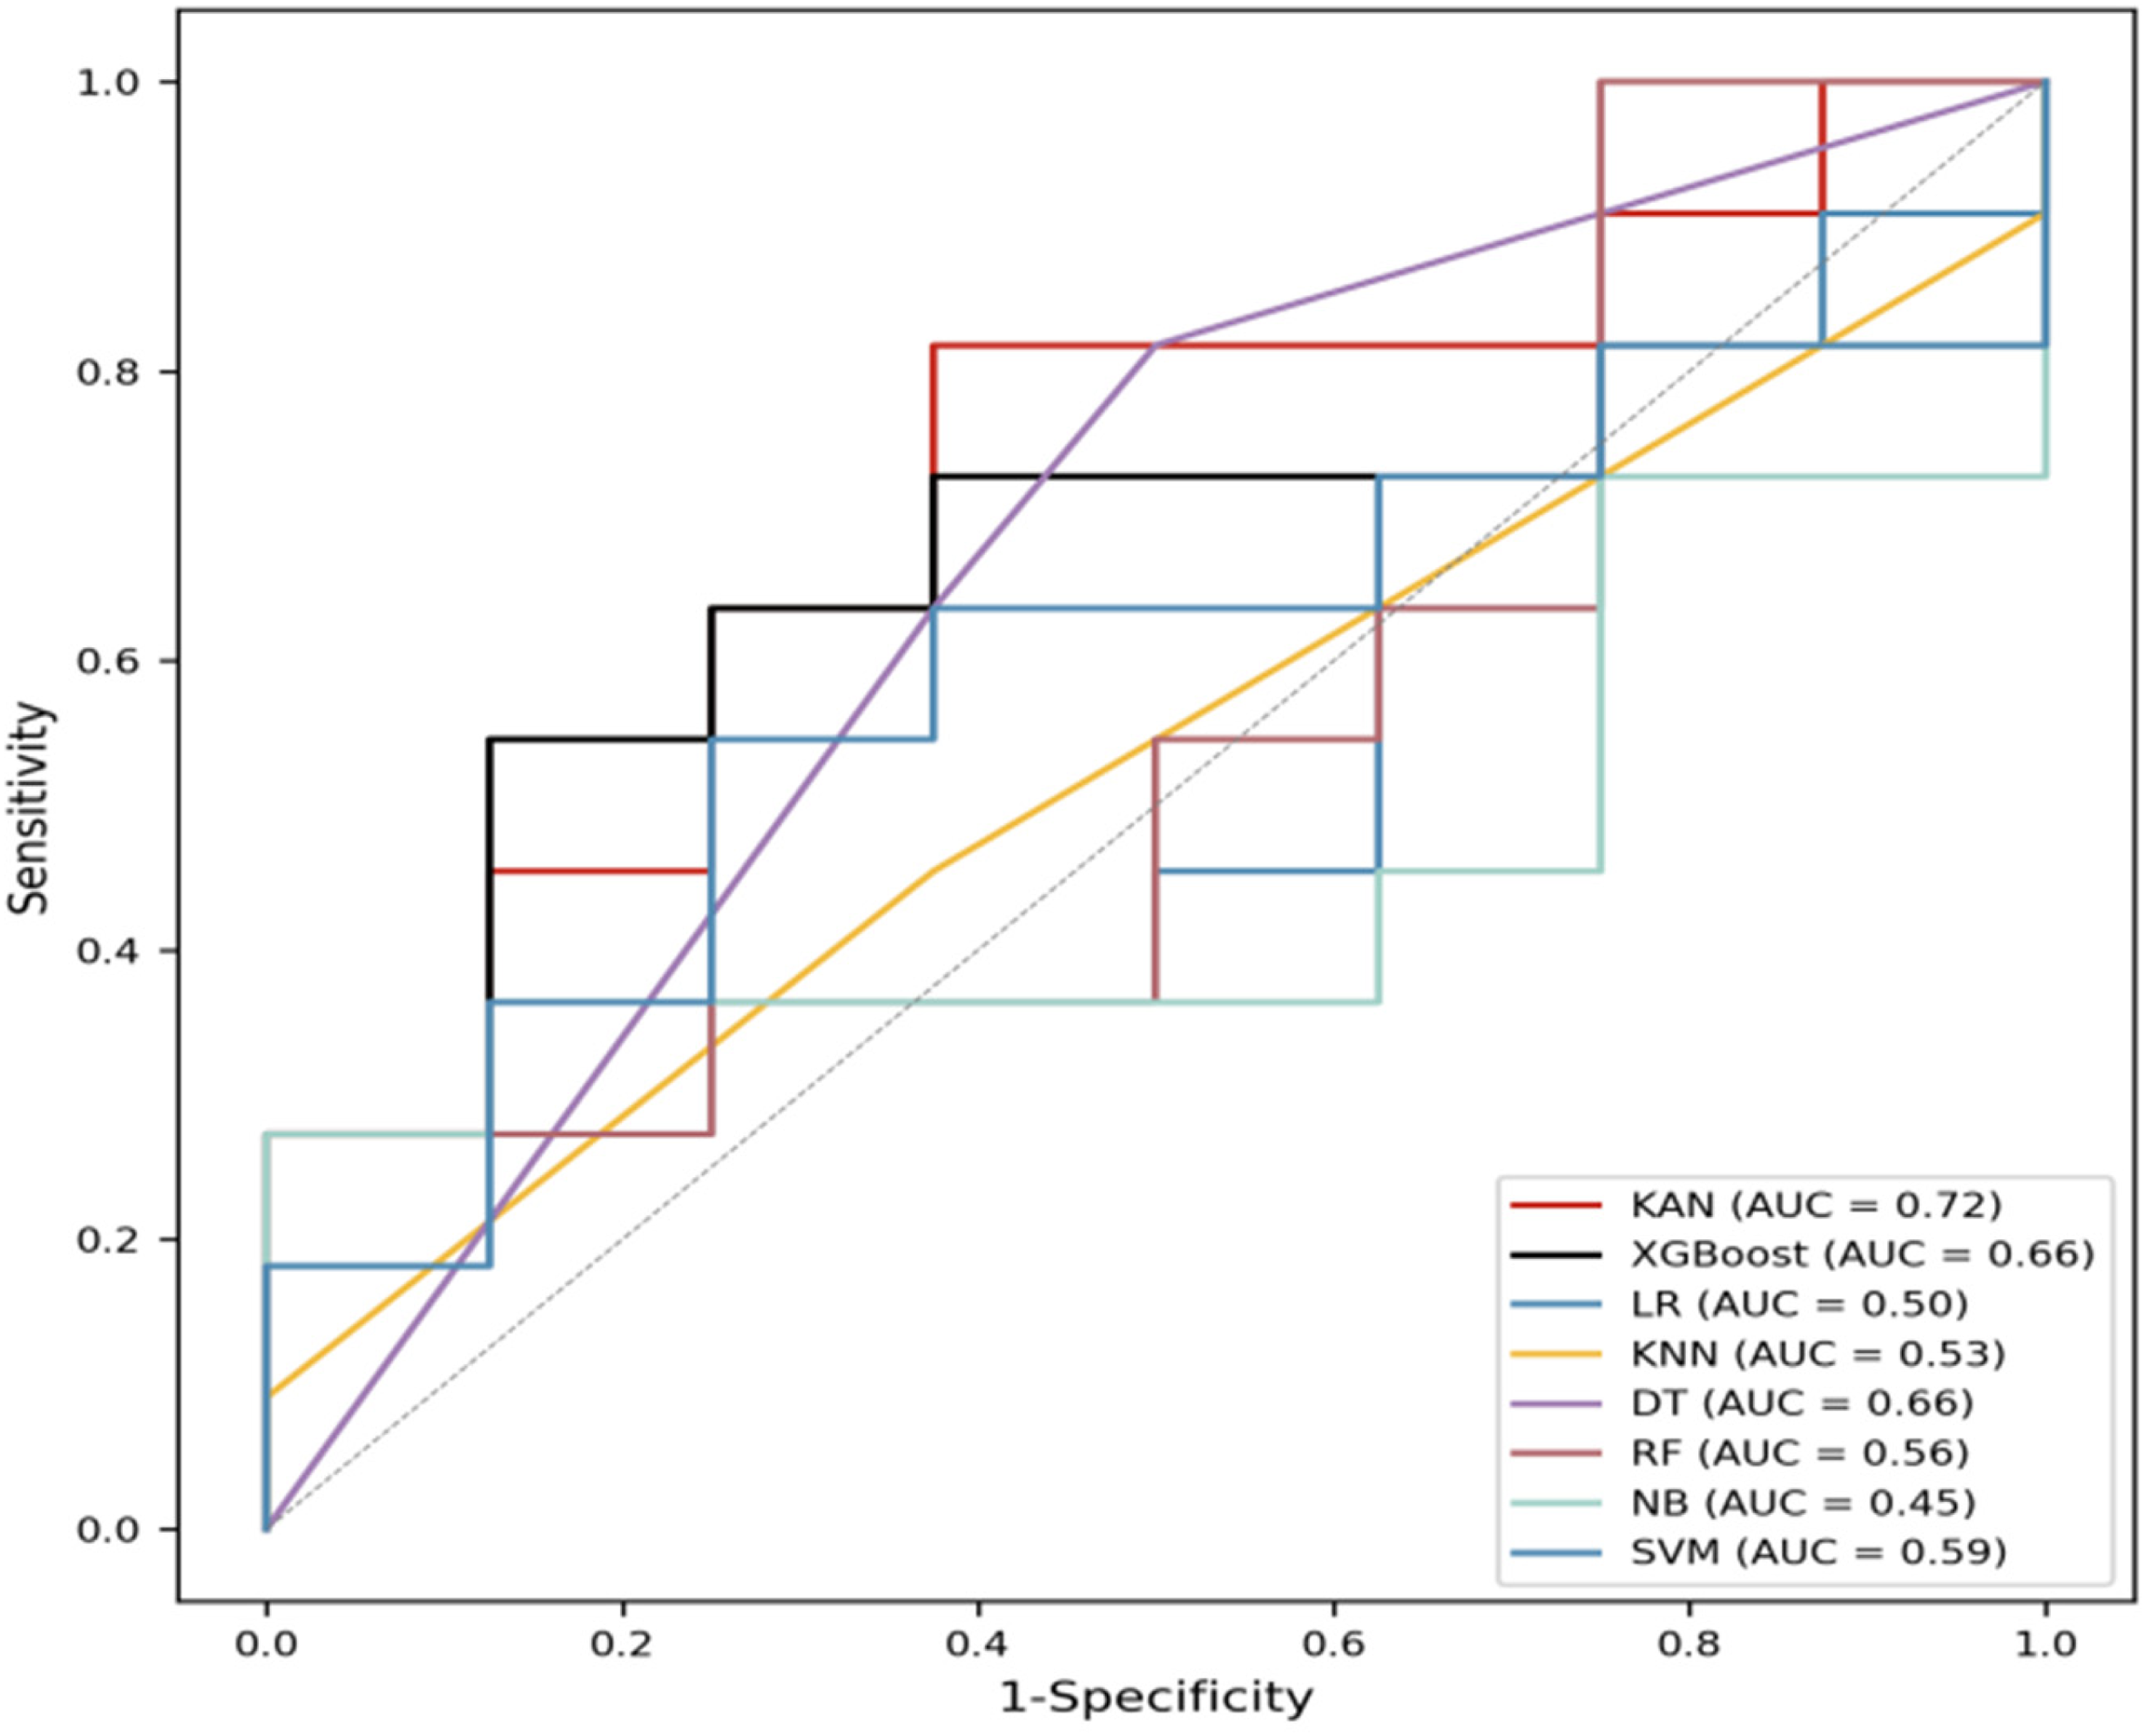
AUC values for Dataset II on different models.
As the training set size decreases, the performance of models declines. The AUC value of the KAN model is 0.72, while the other models have lower AUC values on the same dataset. For example, the AUC value of XGBoost is 0.66, DT has an AUC value of 0.66, and SVM has an AUC value of 0.59. Notably, the AUC value of the NB model is the lowest at 0.45. These results suggest that the KAN model retains relatively strong predictive capability under limited data conditions compared to the other models.
Results of the SHAP analysis
The mean absolute SHAP value for each feature, representing the average magnitude of its influence on the model output, is presented in Figure 8(a). The LDL-C feature has the largest mean absolute SHAP value, indicating it exerts the most significant influence on the model output. This suggests that changes in LDL-C levels may play a key role in the model's prediction results. Following closely is the TC feature, which also demonstrates a relatively high mean absolute SHAP value, indicating that total cholesterol levels significantly influence the model's output. In contrast, Na, HDL-C, AST/ALT, and K exhibit sequentially decreasing mean absolute SHAP values, suggesting their comparatively smaller impacts on the model's predictions. This difference in feature influence provides insight into the model's decision-making process and helps identify factors critical to the model's results. Figure 8(b) presents a specific case result, using the model's predicted value for a label of 1 as the baseline. The red identifier indicates that the feature contributes to the model's prediction of readmission, while the blue identifier indicates an inhibitory effect. Due to the inhibitory effects of LDL-C, HDL-C, AST/ALT, and NA, the KANs model predicts a lower readmission risk for this patient compared to the baseline.
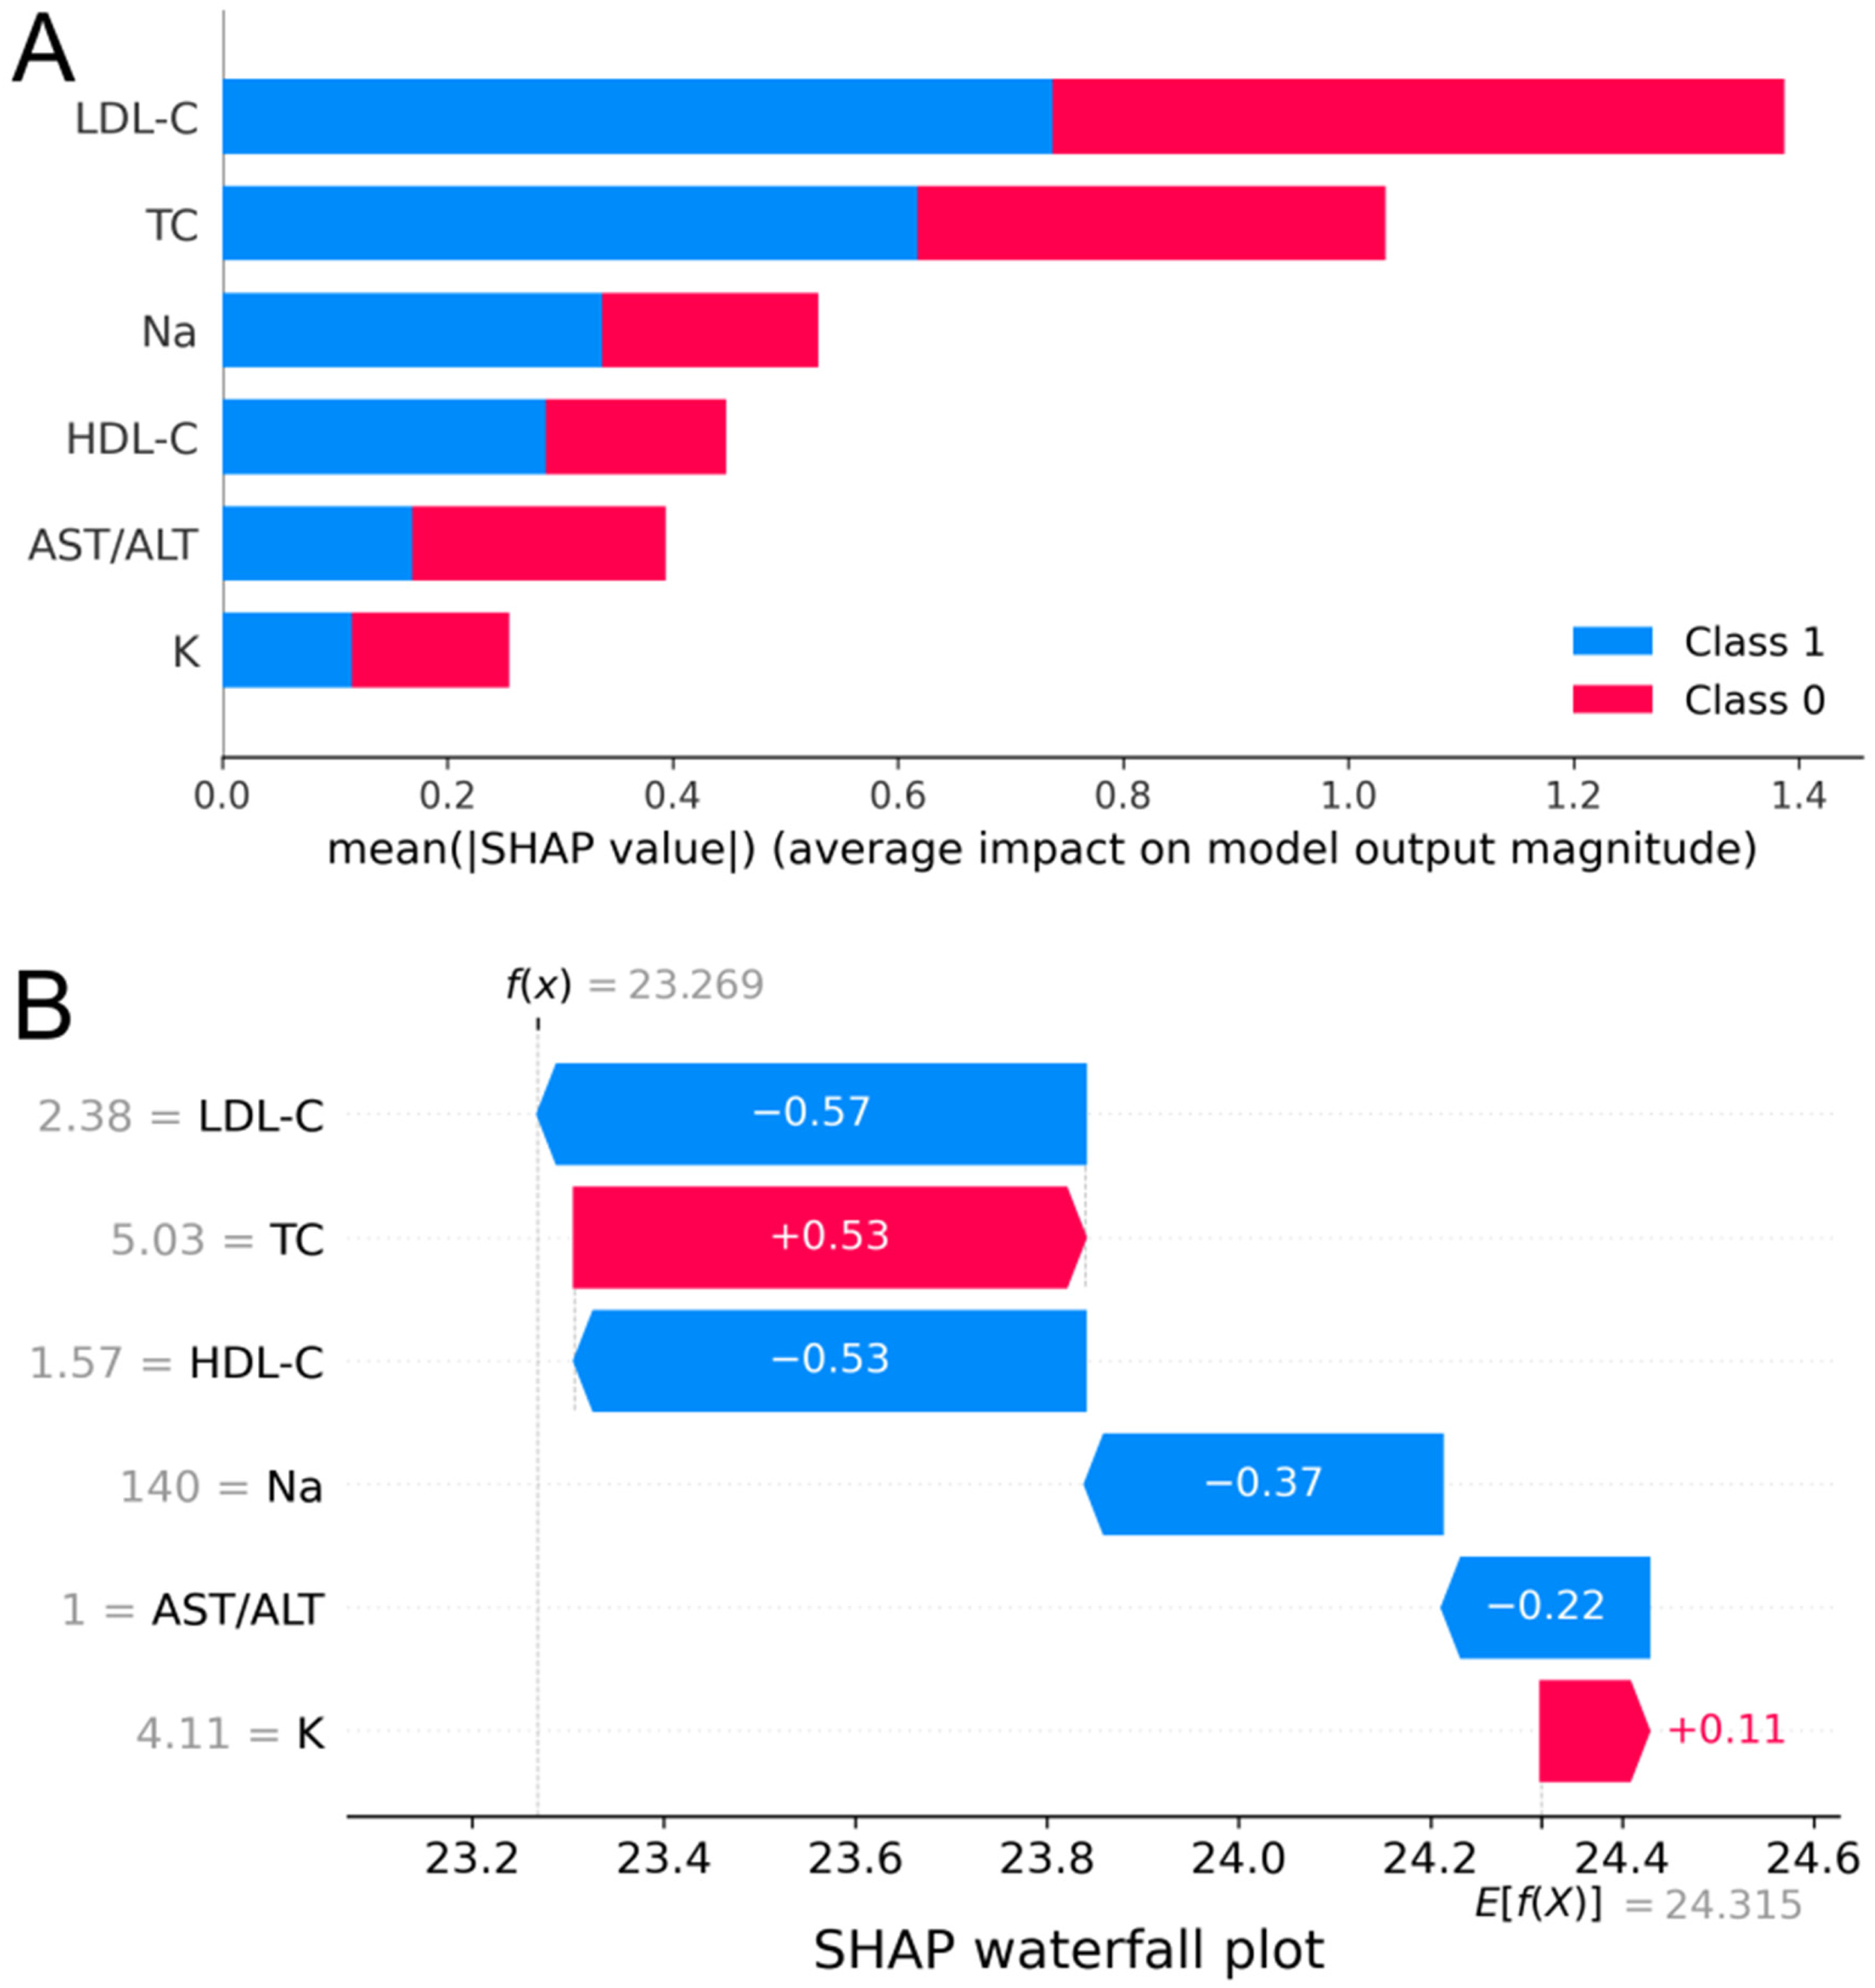
Mean absolute SHAP values for different features and display by case.
Discussion
Discussion of model performance
In this study, we developed a postoperative readmission prediction model for AF based on KANs, and compared its performance with various traditional machine learning models using Dataset I. The results demonstrate that KANs effectively predict readmission after AF surgery. Experimental results indicate that KANs perform well across key evaluation metrics, including accuracy, recall, and F1 score. Notably, it achieves significant improvements in recall and F1 score, highlighting its strong capability in identifying patients at high risk of readmission. In contrast, traditional machine learning models exhibit limitations in capturing complex nonlinear relationships. Although ensemble methods improve overall predictive performance, they still fall short in recall, often failing to identify some readmitted patients. For the high-performing XGBoost model, five-fold cross-validation and box plot analysis reveal that while its average predictive performance is comparable to that of KANs, its results exhibit significantly higher variability, as indicated by wider whiskers and greater dispersion. This suggests that KANs offer superior consistency and stability in prediction outcomes, despite similar overall performance.
We observed a decline in the performance of most models when the amount of data was reduced. The reduction in training data may prevent the models from adequately learning complex patterns, thereby affecting their predictive performance. However, compared to other traditional models, the KAN model introduced in this study demonstrates better AUC performance, making it promising for application tasks with limited samples. KNN, LR, and NB perform particularly poorly with reduced datasets. KNN relies on distance calculations to determine categories, and when the dataset is reduced, the representation of neighboring samples weakens, causing the distance metric to become inaccurate, which affects prediction performance. LR, a linear model that assumes a linear relationship between features and output, may fail to accurately estimate parameters with reduced data and performs poorly, especially with complex nonlinear relationships. NB assumes that features are conditionally independent, an assumption that often does not hold in practical scenarios, resulting in models that fail to capture dependencies between features. Furthermore, with a limited sample size, the estimated conditional probabilities may be inaccurate, which reduces the model's predictive performance and causes the results to deviate from the true distribution.
Discussion of the results of the SHAP analysis
In this study, SHAP analysis was used to visualize the influence of each feature on the KANs model output, providing valuable insights for clinical and research applications. The LDL-C feature had the highest absolute mean SHAP value, indicating its greatest impact on the model output. This aligns with previous findings by Li et al., 37 who showed that LDL-C levels were negatively associated with AF events in a prospective cohort study. This was closely followed by TC, with Roh et al. 38 showing that high TC variability was associated with an increased risk of AF. LDL-C may be a crucial driver of model predictions when assessing a patient's postoperative health status and readmission risk due to its key role in cardiovascular disease development. As an important risk indicator for cardiovascular disease, TC levels play a significant role in model prediction, suggesting the importance of monitoring patients’ lipid levels in clinical practice to assess postoperative risk. In contrast, the mean SHAP values for the AST/ALT, Na, HDL-C, and K features were small, having a relatively weak effect on model output. However, since previous studies have identified fluid and electrolyte disturbances as key predictors of 30-day readmission, 12 these characteristics, despite their limited influence, should not be overlooked in the comprehensive assessment of patient status and may significantly impact model predictions in certain clinical contexts.
Additionally, although the SHAP analysis demonstrated the individual influence of each feature, significant interaction effects between the features may be crucial to the model's strong predictive performance. While this interaction is not directly shown in the figure, the underlying mechanism warrants further exploration, which could guide optimization of the model and improve prediction accuracy.
Application potential of KANs
KANs have shown strong performance in fields such as mechanics39,40 and physics,33,39,41 which has encouraged researchers to explore their use in the medical domain. This study extends the application of KANs to clinical prediction tasks and complements the existing literature. For instance, Dong et al. 42 proposed the TCKANs model to handle multimodal ICU data for predicting sepsis-related mortality. Although the model performed well, it was structurally complex and costly to deploy. Yadalam et al. 43 used KANs to predict drug-gene associations involving HDAC1 inhibitors and gingivitis-related genes. While their model achieved high accuracy, it relied heavily on static, high-dimensional molecular features. In contrast, our study focused on readily available, low-dimensional laboratory indicators. Using only six features, we achieved an AUC of 0.85 with a minimalist model, demonstrating KANs’ strong generalization ability and suitability for lightweight deployment. Cherednichenko et al. 44 also applied KANs to genome sequence classification, emphasizing their interpretability and generalization as an alternative to traditional MLPs. Our results further confirm that KANs can maintain high performance and transparency when applied to real-world structured clinical data. Moreover, SHAP analysis helped us identify the relative importance of each feature, enhancing the clinical interpretability of the model. Overall, this study highlights the potential of KANs for efficient and interpretable prediction in clinical settings.
Limitations and future work
However, the limitations of this study must also be acknowledged. First, the sample size may have limited the effectiveness of model training due to challenges in data collection. Additionally, the features used in this study were derived from laboratory examination indicators, potentially overlooking factors that could significantly impact outcomes. Therefore, future multicenter data collection and large-scale prospective studies are required to validate the model's generalizability. Consideration should also be given to including demographic information and intraoperative metrics to enhance the model's comprehensiveness.
Conclusion
The KANs model proposed in this study demonstrated excellent performance in predicting postoperative readmission risk in atrial fibrillation patients. Validated with clinical data, the model outperformed traditional machine learning algorithms using only six features, highlighting its potential in clinical data processing. In the future, the dataset will be expanded, and additional clinical factors will be explored to enhance the model's predictive accuracy. The model is expected to provide a more accurate and reliable tool for readmission prediction and showcase its potential across a broader range of healthcare scenarios.
Supplemental Material
sj-pdf-1-dhj-10.1177_20552076261435856 - Supplemental material for A Kolmogorov-Arnold network-based approach to predict readmission in patients with atrial fibrillation undergoing catheter ablation
Supplemental material, sj-pdf-1-dhj-10.1177_20552076261435856 for A Kolmogorov-Arnold network-based approach to predict readmission in patients with atrial fibrillation undergoing catheter ablation by Mengfei Wu, Weimin Zhang, Luyao Zhou, Xingye Chen, Hao Su and Yu Wang in DIGITAL HEALTH
Footnotes
Acknowledgments
The authors would like to thank all stakeholders who took the time to participate in this study. Special thanks are extended to the Department of Cardiology, the First Affiliated Hospital of University of Science and Technology of China, for their valuable support and collaboration.
Ethical considerations
The study protocol was approved by the research ethics board of our institution. The performance of this study conformed to the Declaration of Helsinki.
Consent to participate
Not applicable.
Consent for publication
Not applicable.
Author contributions
All authors contributed to the conception and design of the study. Mengfei Wu was responsible for writing the manuscript and designing the experiment. Weimin Zhang handled data processing. Luyao Zhou was responsible for analyzing the results. Xingye Chen contributed to data curation and validation. Hao Su contributed to data collection. Yu Wang contributed to material preparation and assisted in manuscript revision. All authors read and approved the final manuscript.
Funding
The authors disclosed receipt of the following financial support for the research, authorship, and/or publication of this article: This work was supported by the Anhui Provincial Key Project of Natural Science for Universities, Special Fund for Clinical Medical Research and Transformation of Anhui Province, Special Fund for Scientific Research of Central Universities of China (Grant Numbers 1401039202, 202304295107020054, YD9110002056).
Declaration of conflicting interests
The authors declared no potential conflicts of interest with respect to the research, authorship, and/or publication of this article.
Guarantor
Mengfei Wu is the guarantor.
Data availability statement
The data are not publicly available due to patient privacy considerations and hospital data protection policies.
Supplemental material
Supplemental material for this article is available online.