
Abstract
Objective
Vectors that cause infectious lung diseases encompass viral, bacterial, fungal, and parasitic agents. Early detection of these infections is critical for timely diagnosis and effective treatment. Several studies have created solutions for early detection with varying performance, but with limitations such as image type specificity, lack of generalizability, potential overfitting, and bias problems. Our model effectively addresses these problems by using diverse image types, enhancing robustness, and generalizability across various contexts that aim for effective performance.
Methods
This study creates an early detection model that works with both CT scans and X-ray images. We applied a convolutional neural network (CNN) model trained on diverse and large augmented datasets with fewer parameters. We then used a generative adversarial network (GAN) to validate our CNN model and create generalized synthetic images. The proposed model was trained primarily on COVID-19, pneumonia, and tuberculosis (TB) cases (n = 432,533 total augmented cases).
Results
The proposed model is a lightweight and explainable model that assists with real-time detection, resulting in a better performance with an average accuracy of 97.93% with a standard deviation of 0.97%, average area under the curve (AUC) of 98.07%, average sensitivity of 98.46%, average specificity of 97.03%, average precision of 97.45%, and average F1 score of 97.95%.
Conclusion
The proposed CNN model offers a validation and generalization capability for diverse image types in real-time. We conducted a comparative analysis of our model with the most advanced research. The integration of our approach with other clinical systems and internet of things (IoT) devices is feasible.
Keywords
Introduction
There were approximately 344 million incidents of lower respiratory infections (LRIs) and 2.18 million fatalities worldwide. This global burden of incidence and mortality from LRIs highlights the need for increased vaccine coverage, robust pathogen surveillance, and early detection approaches. 1 According to the American Lung Association, most lung infections are transmitted between people through either direct or indirect contact with infected individuals. Infectious lung disease can be either acute, caused by a single infection caught from person to person, or chronic, identified by recurrent infections (e.g., (A) chronic obstructive pulmonary disease (COPD) or another chronic condition characterized by chronic mucus retention and subsequent infections from one or more agents, or (B) immunocompromised, resulting in chronic infectious lung disease). 2
The lungs are essential organs. COVID-19, tuberculosis, and pneumonia are among the most common lung infections. 3 In November 2024, the WHO received reports of 201,454 COVID-19 cases and 3071 deaths. 4 In 2023, an estimated 10.8 million individuals worldwide suffered tuberculosis, up from 10.7 million in 2022. 5 In 2021, pneumonia claimed the lives of 2.2 million individuals, including 502,000 children aged less than five years and 152,000 newborns. 6 Severe cases can lead to hospitalization, complications, and death. Early detection and accurate treatment limit the severity of these diseases—particularly in patients with high-risk conditions.
Several traditional detection methods have been developed for the diagnosis of these lung infections in addition to clinical evaluations, namely a full medical history and physical evaluation, including chest auscultation using a stethoscope. The objective value added by CT and chest X-rays in providing additional insights plus opportunities for longitudinal studies warrants emphasis on the key advantages offered by these radiological modalities.
Detection methods include laboratory testing such as molecular testing, sputum testing, the tuberculin skin test (TST), and blood tests. Computed tomography (CT) scans and chest X-rays are also used to detect these infections. 7 However, manual detection via CT scans and X-ray images is time consuming and may be incorrect. Therefore, using modern and automated detection methods is preferable. Diverse, standardized, and large image datasets are required to make the proposed model more robust and generalizable.
Artificial intelligence (AI) enhances the detection accuracy of abnormalities for several lung infections and supports clinicians in the early diagnosis and precise treatment of these infections. 8 Neural networks and machine learning (ML) techniques have been implemented in various studies to detect and analyze infectious diseases such as COVID-19 and other chronic diseases such as heart disease, kidney disease, diabetes, breast cancer, Alzheimer disease, and Parkinson disease (PD).9,10
Radiologists may give incorrect diagnoses of lung diseases, particularly when interpreting vague X-ray images. 11 Various AI models, ML algorithms, and image-processing techniques have been used to detect and classify lung diseases, 12 which can facilitate early diagnosis and treatment. Such tools can support diagnosis—particularly in low-resource countries.
Several studies have implemented chest imaging along with AI techniques to detect infectious diseases. Automatic detection of COVID-1913,14 using transfer learning techniques with convolutional neural networks (CNNs) on chest CT images has been reported. In addition, a high-resolution network (HRNet) approach used X-ray images. 15 Authors in 16 applied CNN model and a transformer architecture with a self-attention mechanism for early detection of COVID-19 from X-ray images.
A novel learning by teaching (LBT) framework was developed 17 to detect three types of pneumonia through the neural architecture search (NAS) method to find the best convolutional architecture. Other work 18 applied the MobileNetV2 model to detect pneumonia from chest X-ray images. PulmoNet was developed 19 to classify COVID-19, bacterial pneumonia, and viral pneumonia. It shows high performance in binary classification with COVID-19.
An iterative enhancement fusion-based cascaded model was developed 20 to detect and localize multiple diseases from chest X-ray images. COVID-19, tuberculosis, and pneumonia were then studied in various studies. Other work 21 used the knowledge distillation technique where knowledge was transformed from a large and complex model to a smaller and simpler one via a deep convolutional neural network (DCNN). A lightweight deep neural network (DNN) was implemented to detect pulmonary abnormalities in the lung from infectious diseases using x-ray images. 22
This paper has the following contributions:
The proposed study creates a generalized method that is based on diverse and large datasets for various infectious diseases. It provides a real-time model for the early detection and classification of infectious diseases from either CT or X-ray images. It enhances the performance of the gold-standard model. It is a simple method to assist clinicians in decision-making. The proposed model is lightweight with reduced number of parameters, layers, and epochs. It can differentiate between various infections and can be integrated with other clinical systems. The deep learning model is verified and validated using synthetic data. The system provides an explainable AI model that is understandable, transparent, and trusted by clinicians.
This paper is organized as follows: Next section explains the methodology of this study. Section 3 describes the results and discussion. The final section presents conclusions arising from this work.
Methods
Dataset description
This study involves the use of six different datasets for infectious lung diseases named: COVID-19, tuberculosis, and pneumonia. These heterogeneous datasets represent several populations with different characteristics. We concentrated on datasets that previous publications have explored. We use a combination of x-ray images and CT scans to ensure the generalizability of our approach; to the best of our knowledge, no other related studies have used this combination to detect these lung diseases.
COVID-19
C1 dataset: This dataset is from CT-scan images. 23 The dataset includes 2482 CT scan images from 120 patients. It has 1252 CT scans of 60 patients infected with COVID-19, and 1230 CT scan images from 60 non-infected patients with other pulmonary diseases. These images have different sizes.
C2 dataset: This dataset was collected 24 from 338 subjects with confirmed cases with high quality images (1024 × 851 pixels).
C3 dataset: This dataset was collected and studied25,26 to differentiate between COVID-19 and pneumonia. It has 1626 images for COVID-19, 1802 images for normal cases, and 1800 images for pneumonia.
Pneumonia
P1 dataset: This dataset contains 5863 X-ray images for both normal and pneumonia infections. 27 Of these images, there are 4273 pneumonia images, and 1583 are normal chest X-ray images. We combined this dataset with pneumonia images from the C3 dataset.
Tuberculosis (TB)
T1 dataset: This is the first dataset collected 28 with 700 TB X-ray images for infected cases that are publicly available and 3500 normal images. Based on these datasets, we synthesized an extra dataset for CT scans and X-ray images for COVID-19. We used this dataset for validation purposes.
Images preprocessing
We used images from multiple sources and with diverse infection types. We preprocessed the images to ensure consistency: Steps included image resizing, ensuring that all are on a common color space (grayscale), image normalization, image augmentation, and data splitting. We followed prior work 29 for steps on processing the datasets.
Images normalization
In digital images, pixel values are represented as integers ranging from 0 to 255. Where 0 is the minimum intensity and 255 is the maximum intensity. In this step, our goal was to adjust the pixel values of each image to a standard scale between 0 and 1. Normalizing the pixel values is very useful when feeding image data into our AI model. This step also allows gradient stability during training and ensures that all features are on a similar scale. 30 For each pixel value, we applied a pixel-wise operation where each pixel of the image in the training and testing sets is divided by 255 to be in a range of 0.0 to 0.99 for the deep learning model. For the lite model used with IoT devices, we transferred the size of the images to 96.
We adopted an approach that combined the following two main steps:
Pixel-wise operation through the following equation: Z-score normalization (standardization) is used to normalize data when the range is not known with certainty. The formula for z-score standardization involves the following steps:
Find the mean of the pixel values by: Find standard deviation of the pixel values in the image: Apply Z-score formula:
We thus scaled the images to range from 0 to 1 and then calculated the mean and standard deviation to perform z-score standardization.


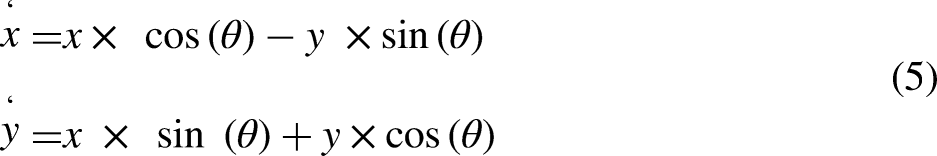
Image transformation
The next goal was to improve the performance of the model and avoid overfitting because of the imbalanced class distribution of images and variations in images. We thus, applied a transformation via augmentation. To maintain transparency, we adopted a method that relies on the concept of model-free image augmentation,31,32 which modifies the spatial relationship between pixels. To ensure diversity and generalization of the dataset, we created an offline image data generator class by focusing on the geometric transformations: rotation, shearing, and shifting of images in the training set. The transformation used the following equations, and, for each pixel coordinate (x, y) in the original image, we obtained (x’, y’)—new transformation pixel coordinates.
Rotation formula: Shearing formula: Shifting images formula:

Convolutional neural network (CNN) to classify images
The proposed CNN model is built from scratch and trained on the specified datasets to classify different types of images either infected or not infected. CNNs33,34 are extensively utilized in deep learning for the extraction of image features due to their inherent capability to autonomously acquire hierarchical representations. CNNs are composed of various layers, such as convolutional layers, pooling layers, and fully connected layers. We trained the proposed DL model on the images by selecting regions of interest (ROIs) on images.
Convolutional Layers: Convolutional layers effectively employ a collection of trainable filters (sometimes referred to as kernels) to the input image. Every filter executes a convolution operation by smoothly moving across the input image and calculating dot products at every position. This procedure effectively captures local patterns and provides feature maps that prominently emphasize significant visual traits. Activation Functions: Non-linear activation functions (such as ReLU, sigmoid, or tanh) are expertly applied elementwise to the feature maps, thus introducing non-linearity and empowering CNNs to adeptly model intricate correlations in the data. Pooling Layers: Pooling layers effectively down-sample the feature maps, hence decreasing their spatial dimensions. This facilitates the establishment of spatial invariance and reduces the computational complexity of future layers. Typical pooling operations encompass max pooling (choosing the maximum value within each pooling zone) or average pooling (calculating the average value) for values of Fully Connected Layers: Following a series of convolutional and pooling layers, the feature maps are transformed into a vector and then inputted into fully connected layers. These layers effectively execute high-level feature integration and conversion, thus adeptly gathering comprehensive information and acquiring intricate relationships between features. Activation and output Layers: The completely connected layers are commonly accompanied by activation functions and an output layer that are contingent upon the task at hand. Activation functions introduce non-linearity, whereas the output layer is responsible for producing the required format for the given job such as softmax for classification or linear activation for regression. Deep learning architectures like VGGNet, ResNet, Inception, and EfficientNet have exhibited impressive capabilities in extracting picture features.
The function f (i, j) is the input feature map, g is the convolution kernel (filter), and (x, y) are the spatial coordinates of the output feature map.
W represents the weight matrix, and b is the bias vector. Term f is the activation function (sigmoid) because we used binary classification.
These designs frequently comprise multiple layers and utilize a range of techniques such as skip connections, residual blocks, and attention mechanisms to enhance feature representation and optimize model performance. Importantly, in the context of transfer learning, pre-trained models that have been trained on extensive picture datasets, such as ImageNet, are frequently employed as feature extractors. These models can be effectively fine-tuned or utilized as fixed feature extractors on new tasks or datasets, thus enabling the seamless transfer of acquired representations from a source domain to a target domain. The following figure shows our simple classification model. The model should be sigmoid for binary classification. We used Adam optimizer, and the loss function is binary cross entropy. Figure 1 shows our proposed CNN model and the approach with two combined models: the first is the GAN model to generate synthetic images and the other is the main CNN model fed with all real and synthetic datasets. Table 1 shows more details about the proposed CNN model.


Proposed method with CNN model.
Layers and parameters in the proposed CNN model.

Generative adversarial network (GAN)
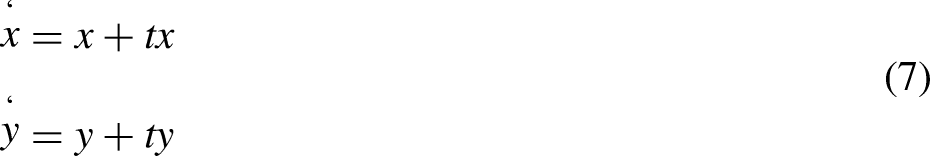
We applied a generative adversarial network (GAN) assist in generating similar images for validation purpose in this study. The GAN consists of two main neural networks components: generator (G) and the discriminator (D).35,36
The objective function is as follows: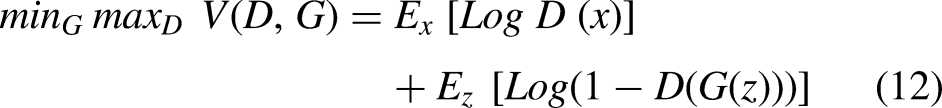
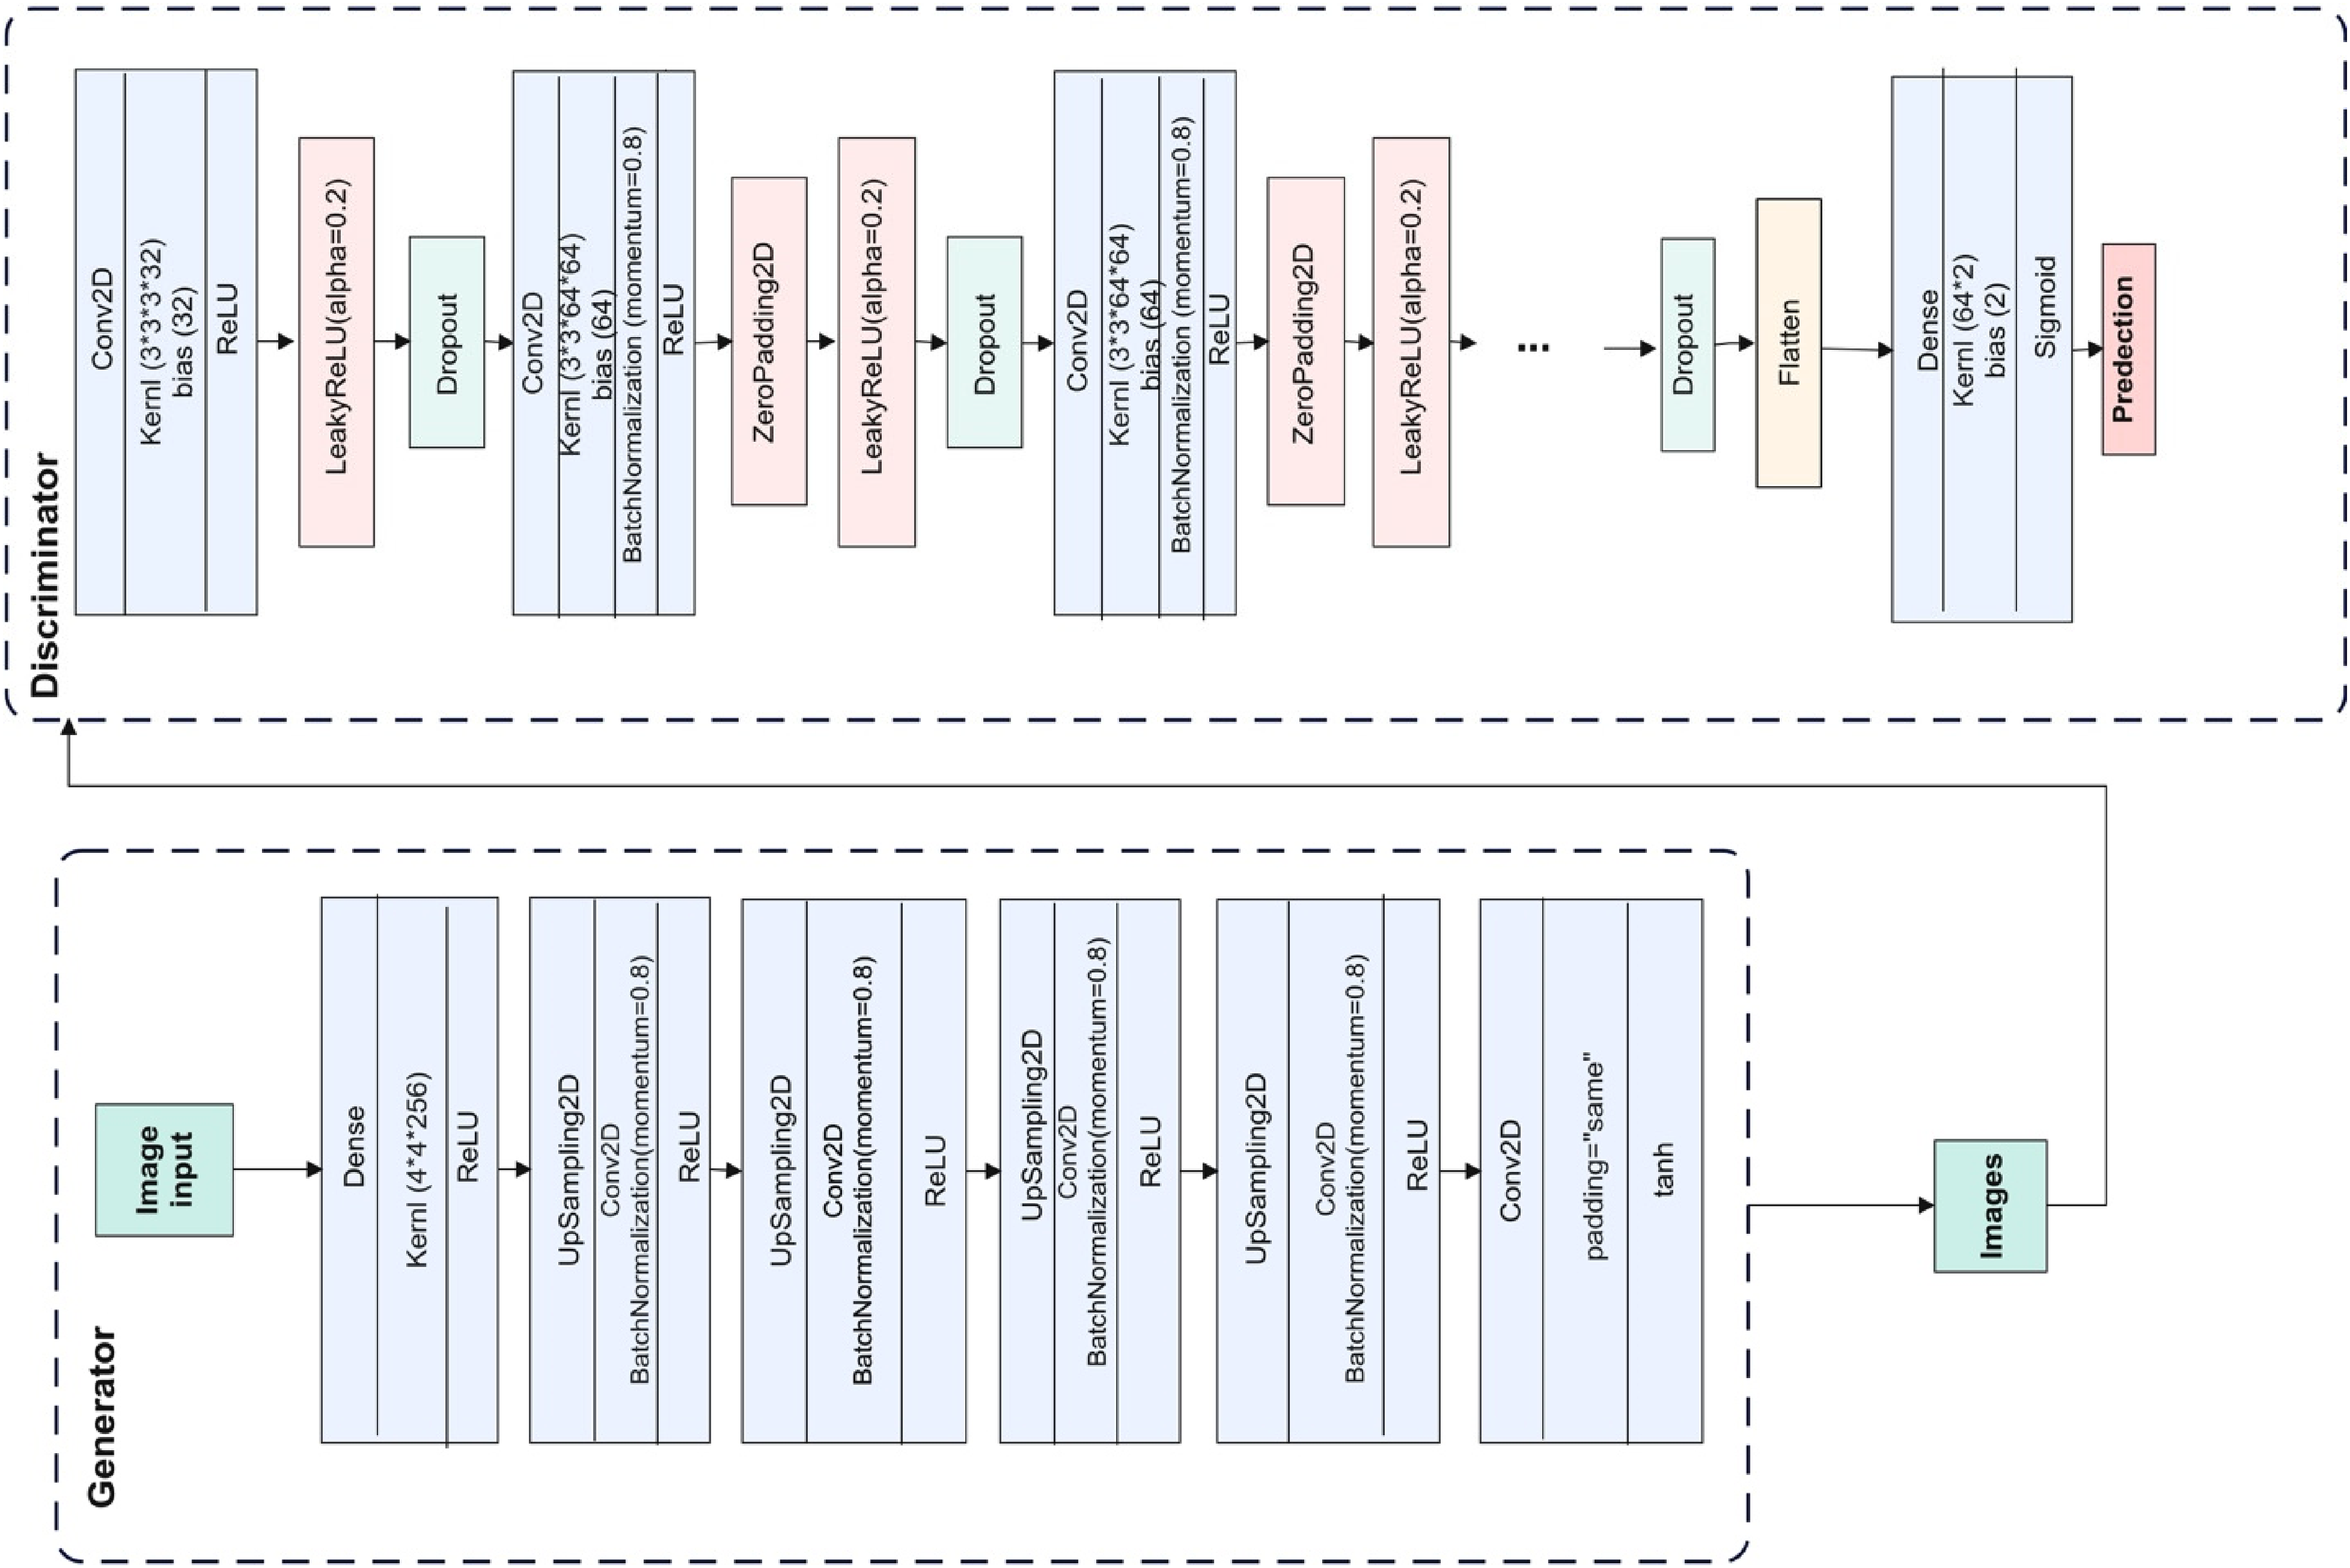
The proposed GAN model.
Layers and parameters in the proposed generator

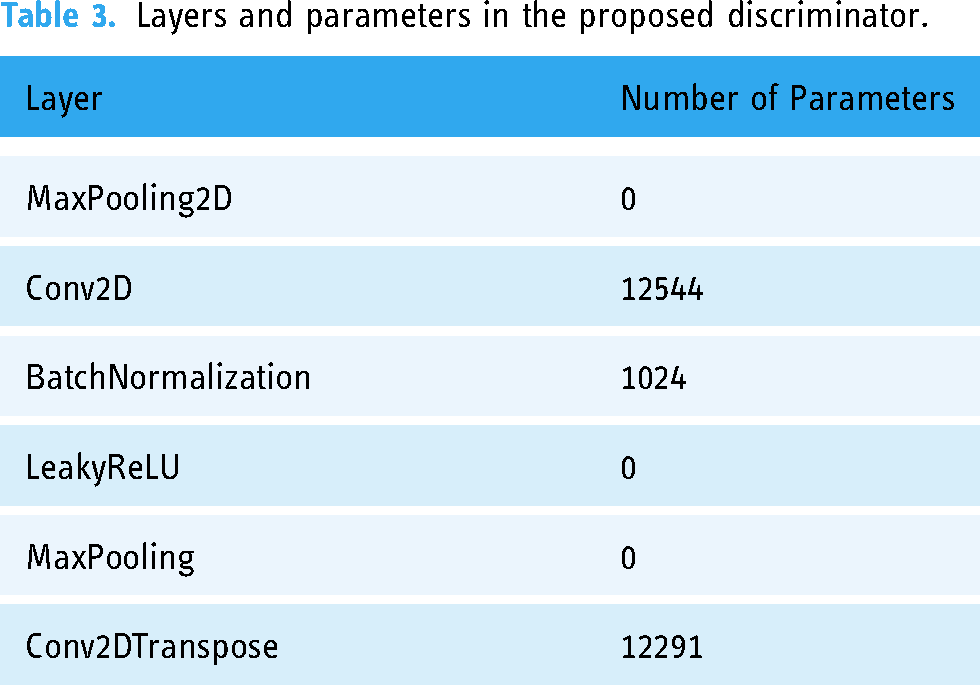
Layers and parameters in the proposed discriminator.
Results
We applied the proposed CNN and GAN models on real datasets using GPU A100 with 500 compute units in Google Colab services, and we measured accuracy, area under the curve (AUC), sensitivity, precision, specificity, F1-score, receiver operating characteristic (ROC) curve, and Matthews correlation coefficient (MCC). We applied false positive rate, false discovery rate, and false negative rate for validation. 37 We split datasets in a 60:20:20 ratio for training, testing, and validation respectively. Moreover, we measured the confusion matrix for the testing datasets. We had a large set of images from different sources and different diseases, and thus we performed simple random sampling combined with the augmented data. The rate of random sampling is 0.5 for all datasets. Because we got big dataset for C3 and P1 datasets, we selected more than 0.5 sampling for training, testing, and validation parts. Table 4 lists all parameters for the CNN, generator, and discriminator models. Table 5 lists the sizes of the datasets and the fixed parameters for each. Table 6 lists performance metrics for each dataset.
Parameters of the proposed models.

Real and augmented data size.

Performance metrics for each dataset.
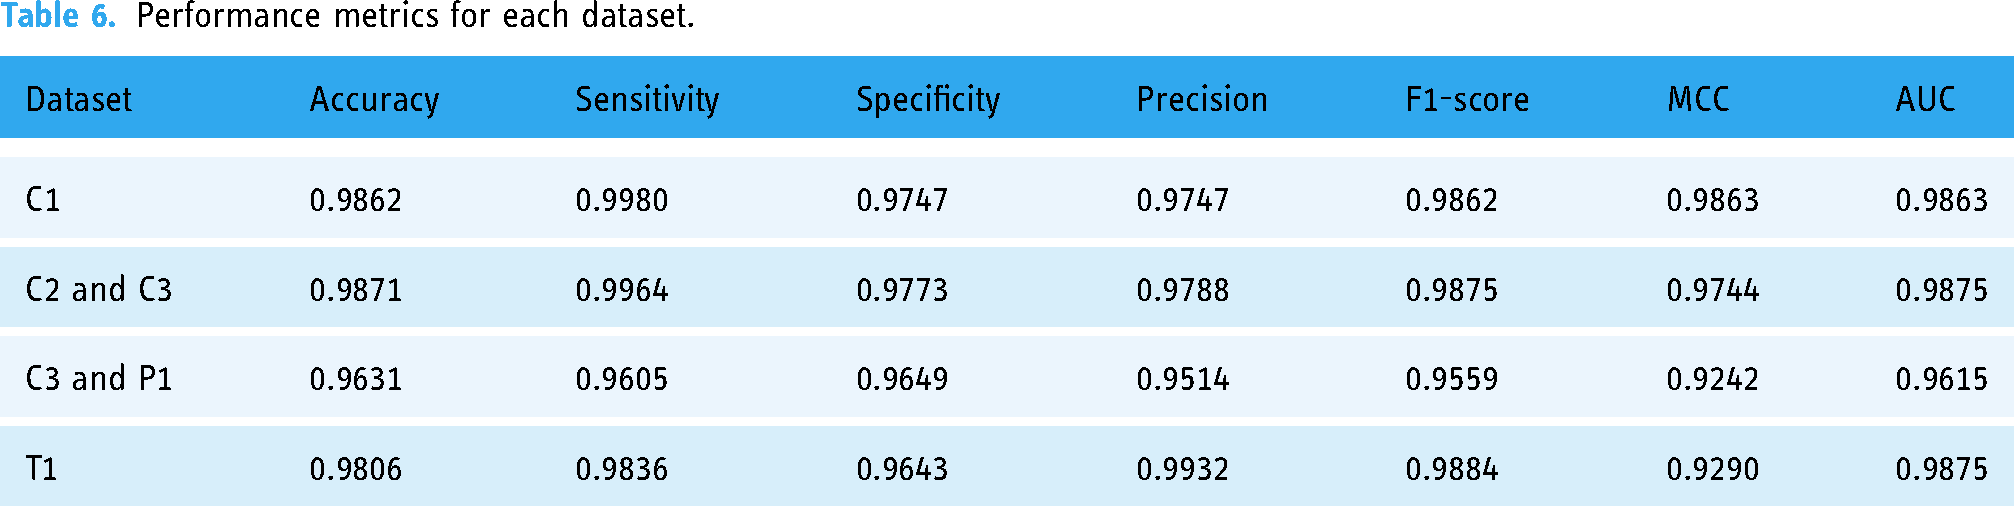
Figure 3 shows the balanced datasets after augmentation. This step is very important before training to prevent bias, improve model performance, avoid overfitting, and allow the proposed model to accurately learn data patterns. Moreover, Figure 4 demonstrates the training and validation accuracy, their loss, and the confusion matrix for each dataset.
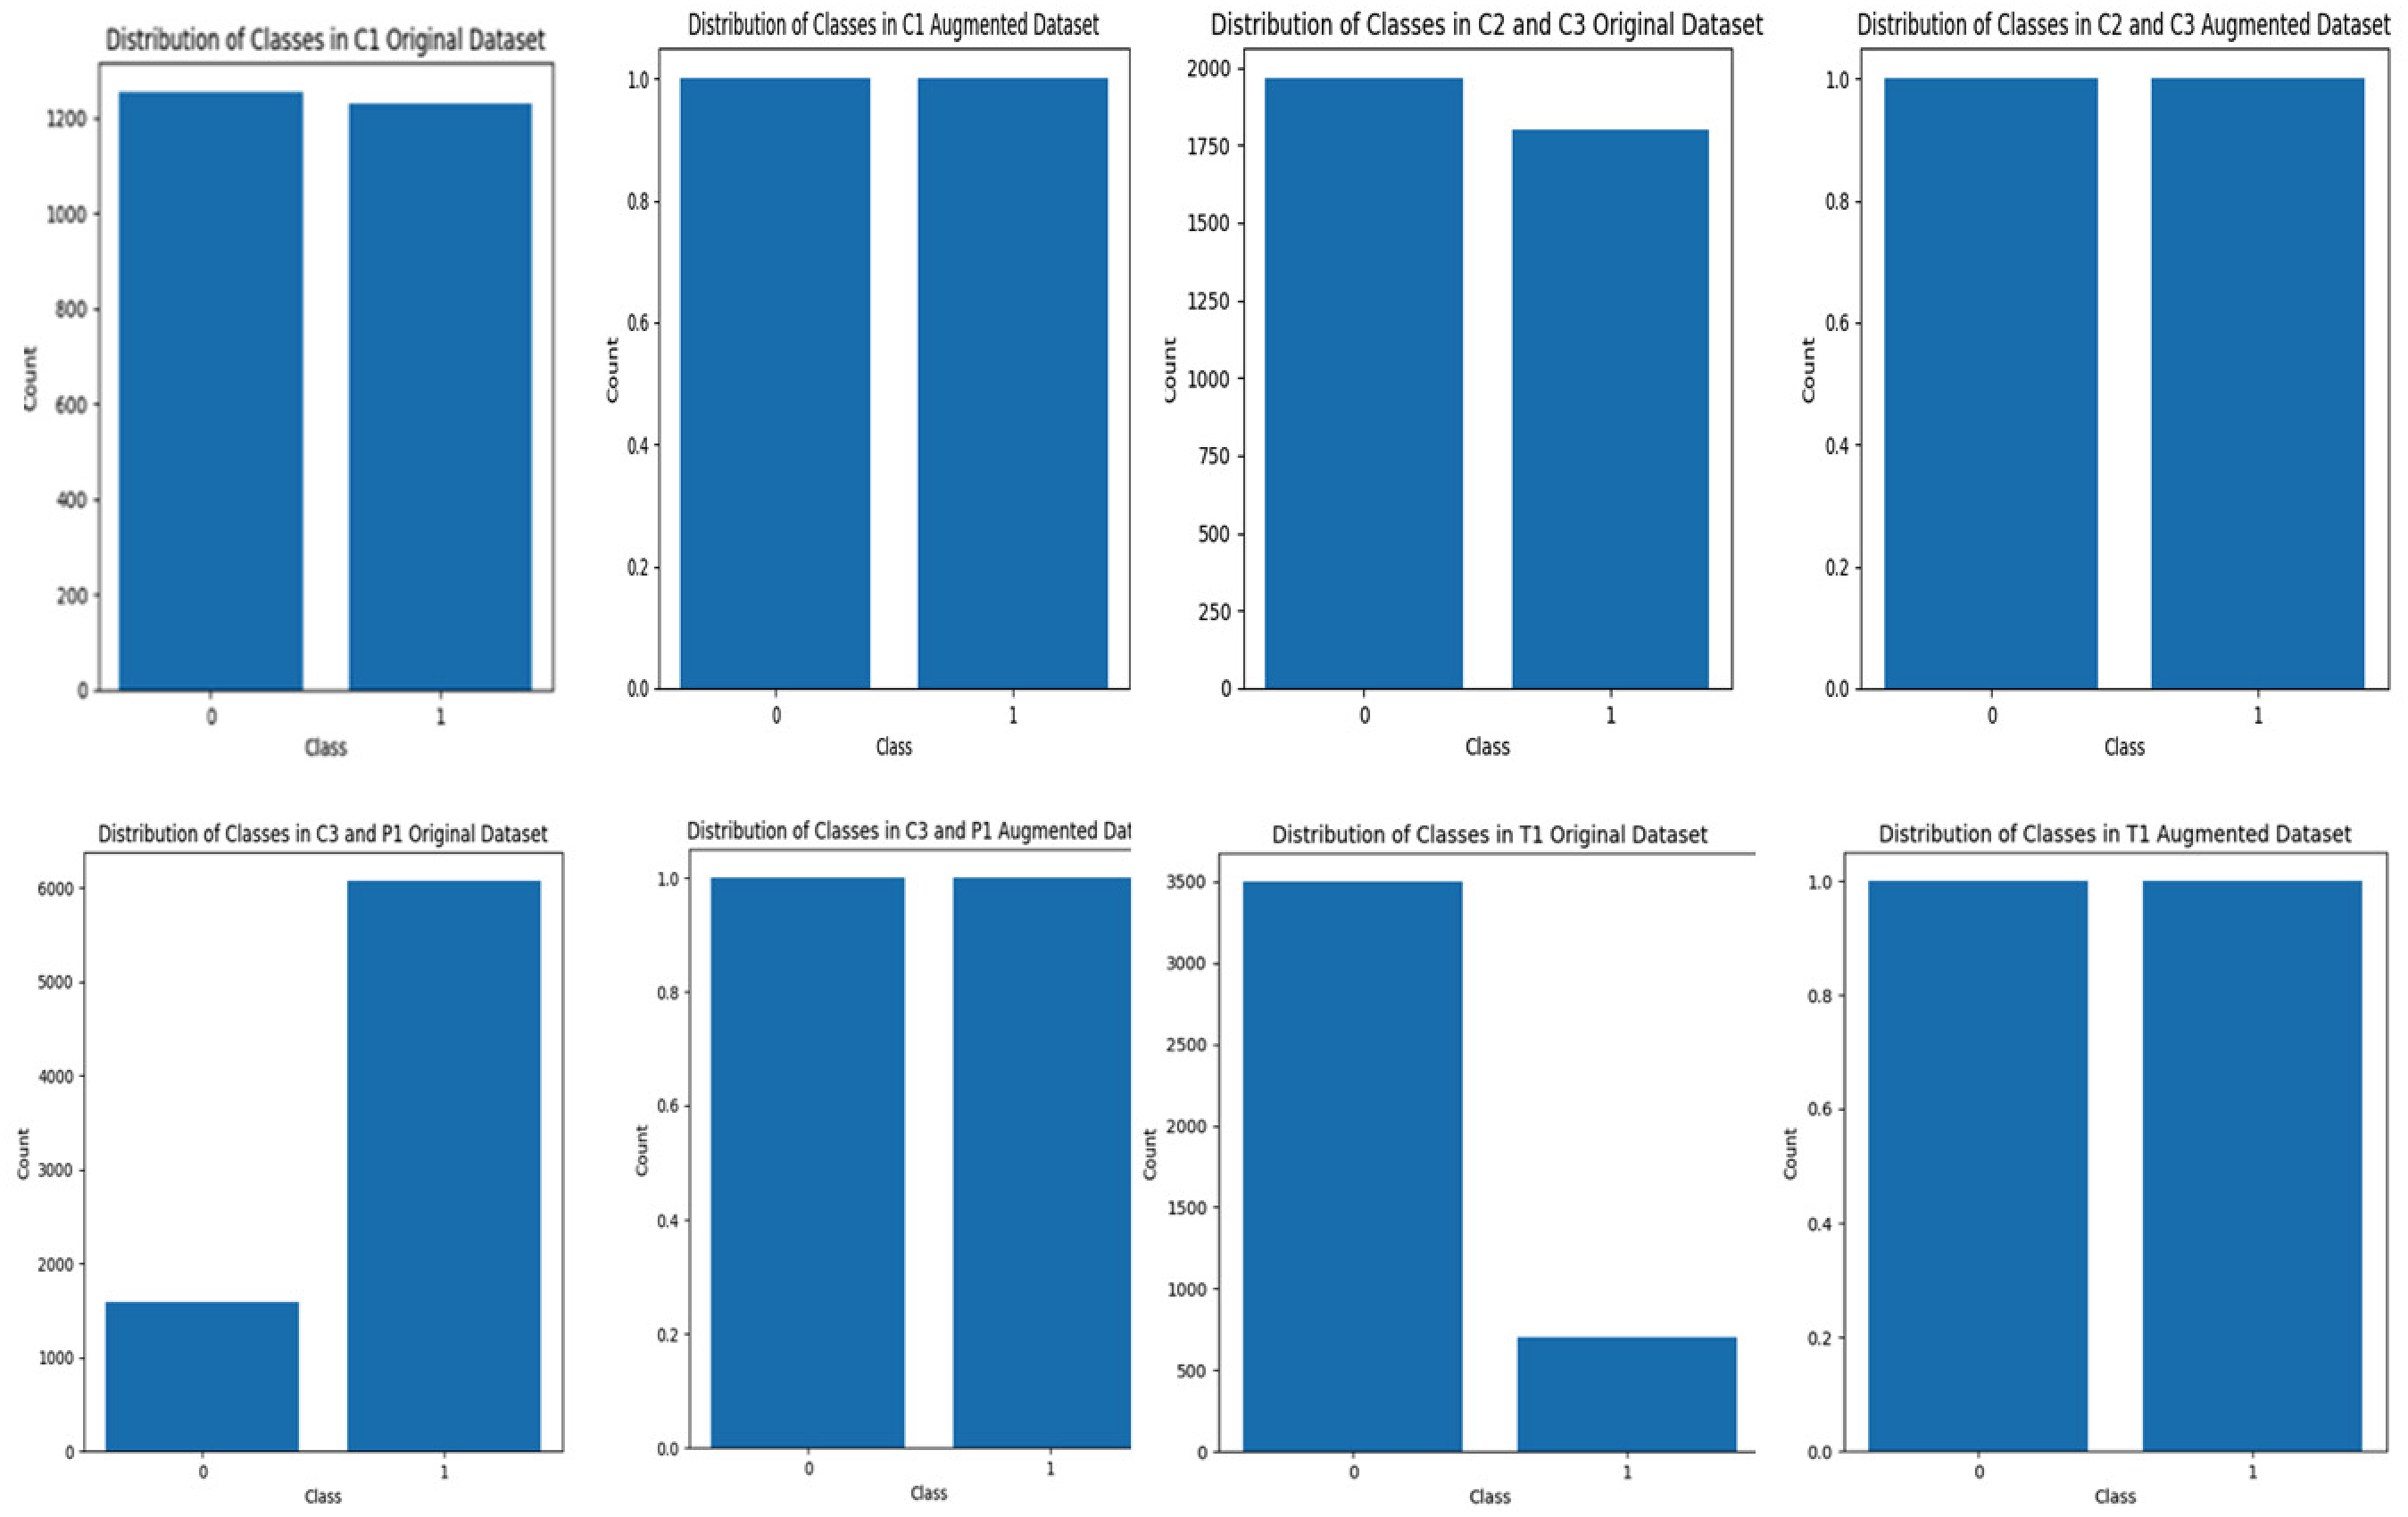
Distribution of classes in original and augmented datasets.

Results of the proposed CNN model on CT scan and X-ray datasets, training accuracy and loss (left), and confusion matrix for testing parts (right).
Discussion
To avoid the problem of the black box of deep learning model and to provide a simple and interpretable model that increase transparency, several techniques were presented such as bootstrap simulation and SHapely Additive Explanations (SHAP), and Local Interpretable Model-Agnostic Explanations (LIME).38,39 We interpreted the results using (LIME) to explain a prediction. LIME approximates the local behavior of the prediction model for a specific instance. The results of classification for all datasets are explained using LIME for the following optimization formula:

The visualization of the explainer displays a plot that shows the top important features in the image that contribute the most to the classification. Figure 5 illustrates the top 10 most important features in the images. The top gray images show the important features and hide others when the class is infected with COVID-19. The images below show the critical features with colors when the class is not positive for COVID-19.

Explaining the 10 most important features in (a) from C1 dataset, (b) C2 and C3 dataset, (c) C3 and P1 dataset, and (d) T1 dataset.
Figure 5 shows that the positive infections are explained by the proposed model. The gray color shows the important region to be classified as positive cases. The discarded areas in black are not important.
We applied the GAN model to validate our proposed model performance. We randomly selected 499 images from C1 CT scan images and 498 from C2 and C3 X-ray images datasets. We then used the GAN model to generate new images for both COVID-19 and non-COVID-19 infections from each dataset. We got 23,928 augmented images from all datasets. Figure 6 shows the results obtained after 700 epochs for each case. We then used our proposed method to augment these images and then applied our CNN model.

Generated images using GAN model.
We then applied our CNN model on 23,928 augmented images dataset for both real and synthetic images. We divided this new dataset into 0.6 for training, 0.2 for testing, and 0.2 for validation. After training the proposed model, we got the results in Figure 7 as well as the confusion matrix for the testing part. Figure 8 shows 5-fold cross-validation for both synthetic and real datasets. For the synthetic images dataset, we obtained 0.9925 for accuracy, 0.9979 for sensitivity, 0.9872 for specificity, 0.9870 for precision, 0.9924 for F1 score, 0.9850 for MCC, 0.0128 for false positive rate, 0.0130 for false discovery rate, and 0.0021 for false negative rate. For real dataset images, we obtained 0.9846 for accuracy, 0.9807 for sensitivity, 0.9886 for specificity, 0.9888 for precision, 0.9847 for F1 score, 0.9693 for MCC, 0.0114 for false positive rate, 0.0112 for false discovery rate, and 0.0193 for false negative rate. We mixed 1000 CT scan and X-ray images for 250 real images and 250 synthetic images for each class, and we still obtained good performance as shown in Figures 7 and 8. We obtained 0.9693 for accuracy, 0.9533 for sensitivity, 0.9865 for specificity, 0.9870 for precision, 0.9699 for F1 score, 0.9392 for MCC, 0.0135 for false positive rate, 0.0130 for false discovery rate, and 0.0467 for false negative rate.

Results of the proposed CNN model on ct scans and X-ray- synthetic, real, and mixed image datasets.

Results of 5-fold cross validation of the proposed CNN model for synthetic, real, and mixed image datasets.
The three investigations provided the best performance metrics for detecting COVID-19 infection in CT scan and X-ray images, for both real and synthetic data with noise added and for mixed datasets.
To evaluate our proposed CNN model in situations like real-world medical environments, we used a GAN model to generate synthetic images with noise and occlusion. We applied mean squared error (MSE) scores, which give values from 965.84 to 992.35, as in Figure 9. Lower values indicate closer alignment with real images, and higher values indicate differences. The proposed model shows robustness and generalizability in clinical environments where image quality is not always perfect.

Results of MSE for real and synthetic images.
Table 7 shows that DenseNet121 usually does better than VGG16, getting higher F1 scores, accuracy, and precision in most datasets. For instance, DenseNet121 achieved 99.13% accuracy and 99.21% F1-score on the “C2 and C3” dataset, compared to 98.88% accuracy and 98.96% F1-score for VGG16. Similarly, DenseNet121 showed slightly better performance in T1 with a 99.21% F1 score.
Performance metrics for base models.

Our proposed model, on the other hand, has slightly lower average metrics than DenseNet121, but the results are the same across datasets: an F1-score of 97.95%, an average accuracy of 97.93% (standard deviation: 0.97%), and an average sensitivity of 98.46%. DenseNet121 does really well with some datasets, but the proposed model is lightweight and has strong overall performance that makes it suitable for real-time detection.
We compared our results for all datasets for both CT scans and X-ray images in Tables 8 and 9 and noted promising results relative to other related studies. The two benchmark studies 22 applied the same datasets we applied in this study. Our work is also better than Kabir and colleagues’ work that used knowledge distillation. 21 But Mahbub's work that implemented lightweight DNN 22 was comparable. However, unlike our work, both studies focused on smaller datasets and exclusively utilized X-ray images. The study 21 proposed a student model that heavily relies on the teacher model, making it impossible to apply to new data without first retraining it. There is no external validation in both studies and no testing on noisy images, which is common in real-world scenarios. It solely used accuracy, precision, and recall; however, additional important metrics for clinical decision-making are required. These studies employed augmentation techniques that included random rotation, translation, flipping, and zooming 21 while only resizing the images. 22 However, both studies lack dataset diversity and face an overfitting problem. In our study, we incorporated their additional datasets and various augmentation techniques, encompassing a total of 432,533 images from both CT scans and X-rays, to ensure diversity for generalization and to prevent overfitting. We carried out external validation on a newly generated dataset using a GAN model, which included a variety of noisy images.
Comparison between our results and other state-of-the-art studies.

A comparative analysis between our study and other related studies.

Moreover, our model has 1.31 million parameters, striking a balance between both studies. This makes it more robust while still resource efficient. It uses moderate memory compared to the high memory demand of model 21 and the very low memory usage of the lightweight model. 22 This allows it to extract deeper features without being overly resource intensive. Our proposed model has a moderate speed suitable for real-time applications on mid-tier devices. The proposed model has four Conv2D layers, which makes it better at extracting features for complicated tasks than the shallow architectures used in the other two studies. The use of three dropout layers ensures excellent regularization, significantly reducing overfitting compared to the two previous models, which had limited or no dropout layers. The two dense layers, including one with 1.18 million parameters, enhance the model's classification power, outperforming the simpler dense layers of the previous lightweight models.
The proposed model combines its deeper architecture and dropout layers to achieve strong generalization. Our model achieves 97.93% average accuracy, comparable to the previous lightweight models, but with better robustness due to its superior architecture. It is highly adaptable to moderately complex tasks, unlike the Student Model, 21 which is better suited for simpler tasks, or the Lightweight DNN, 22 which balances efficiency but lacks the depth for more demanding datasets. The proposed model is suitable for deployment on IoT devices, offering a practical solution for real-world applications, unlike the Teacher Model, 21 which requires significant computational resources. The proposed CNN model is a flexible solution, offering excellent performance, regularization, and adaptability without excessive computational cost.
We trained, tested, and validated the proposed model on various datasets and modalities for three common infections, and it performs better. This underscores the model's adaptability to training and testing for additional conditions. However, like other models, future studies in the literature should expand it to include other diseases in order to evaluate its performance.
We need to further optimize this model to make it suitable for mobile devices. This can be done by quantization, which shrinks the model, or pruning, which gets rid of the less important weights to make the model smaller and the inference process faster. We will use TensorFlow Lite or ONNX as frameworks for this deployment to create the mobile application. We will use the phone camera and the mobile application as a tool for real-time processing to ensure the application can process input images and return predictions in a timely manner.
AI decision-making in healthcare settings and synthetic data have major ethical implications. We must properly create synthetic data to prevent biases. We applied it in our study to validate the performance of the proposed model in situations similar to real-world settings where there are noises and unclear images. AI decision-making also presents ethical challenges, especially with regard to false positives and negatives. Strict validation, model explainability, and ongoing monitoring are absolutely necessary to help reduce these risks. AI is a tool rather than a replacement, so clinicians must stay essential to the decision-making process. Strong ethical standards will guarantee that artificial intelligence systems give patient safety and fair results first priority.
Conclusions
COVID-19 led to millions of infections and deaths worldwide. Pneumonia causes morbidity and mortality—particularly in children and the elderly. Tuberculosis (TB) remains a global threat in low- and middle-income countries. These are common respiratory infections with social, economic, and public health impacts. Various studies have developed advanced models for early detection of these disease. Our study reports a lightweight, explainable, and real-time CNN model with high performance and a reduced number of parameters. When deploying this model for mobile health applications, it is possible for clinicians to obtain quick and real-time assistance from CT scans or X-ray images to classify each patient's condition. The results can be further integrated with other hospital systems and with electronic health records (EHRs). We could use cloud-based services instead of a GPU to accelerate processing times. Future directions include the creation of standardized benchmark datasets, enhancing model interpretability, as well as utilizing multimodal data (combining chest X-rays, CTs, and patient symptoms).
Footnotes
Acknowledgements
We deeply regret the loss of Dr Ibraheem Assiri, a highly skilled AI expert, whose continuous search for knowledge and unwavering commitment to his students served as a source of inspiration for everyone acquainted with him. He made a significant contribution to the concept of this work. Dr Ibraheem died on June 20, 2024, at the age of 68.
Author contributions statement
Eman is the author of this article and is responsible for all parts.
Consent statement
This study uses publicly available datasets, and no identifiable or private information was collected. Therefore, informed consent was not required.
Data availability
This study utilized publicly available datasets from multiple sources, which were accessed and used in full compliance with their respective terms and conditions. The datasets and their sources are as follows:Covid-19 Dataset C1: Available at https://www.kaggle.com/datasets/plameneduardo/sarscov2-ctscan-dataset, licensed under CC BY-NC-SA 4.0.Covid-19 Dataset C2: Available at https://data.mendeley.com/datasets/xztwjmktrg/2, licensed under CC BY 4.0. Covid-19 Dataset C3: Available at https://www.kaggle.com/pranavraikokte/covid19-image-dataset, licensed under CC BY-SA 4.0. Tuberculosis Dataset: Available at https://www.kaggle.com/tawsifurrahman/tuberculosis-tb-chest-xray-dataset, used in accordance with the requirement to properly cite the authors' article. Pneumonia Dataset: Available at ![]() , licensed under CC BY 4.0. All datasets were accessed and utilized in accordance with their respective licensing agreements and applicable ethical guidelines. The researcher undertook due diligence to ensure compliance with the licensing terms and conditions at the time of use. However, the researcher does not assume responsibility for any future claims, disputes, or ambiguities arising from changes or unclear licensing terms.
, licensed under CC BY 4.0. All datasets were accessed and utilized in accordance with their respective licensing agreements and applicable ethical guidelines. The researcher undertook due diligence to ensure compliance with the licensing terms and conditions at the time of use. However, the researcher does not assume responsibility for any future claims, disputes, or ambiguities arising from changes or unclear licensing terms.
Declaration of conflicting interests
The author declared no potential conflicts of interest with respect to the research, authorship, and/or publication of this article.
Ethical approval
This article does not contain any studies with human participants or animals performed by the author.
Funding
The author received no financial support for the research, authorship, and/or publication of this article.
Guarantor
Eman alqaissi is the guarantor for this article and takes full responsibility for the integrity and accuracy of the research.