
Abstract
Background
Deep learning models assist ophthalmologists in early detection of diseases from retinal images and timely treatment.
Aim
Owing to robust and accurate results from deep learning models, we aim to use convolutional neural network (CNN) to provide a non-invasive method for early detection of eye diseases.
Methodology
We used a hybridized CNN with deep learning (DL) based on two separate CNN blocks, to identify multiple Optic Disc Cupping, Diabetic Retinopathy, Media Haze, and Healthy images. We used the RFMiD dataset, which contains various categories of fundus images representing different eye diseases. Data augmenting, resizing, coping, and one-hot encoding are used among other preprocessing techniques to improve the performance of the proposed model. Color fundus images have been analyzed by CNNs to extract relevant features. Two CCN models that extract deep features are trained in parallel. To obtain more noticeable features, the gathered features are further fused utilizing the Canonical Correlation Analysis fusion approach. To assess the effectiveness, we employed eight classification algorithms: Gradient boosting, support vector machines, voting ensemble, medium KNN, Naive Bayes, COARSE- KNN, random forest, and fine KNN.
Results
With the greatest accuracy of 93.39%, the ensemble learning performed better than the other algorithms.
Conclusion
The accuracy rates suggest that the deep learning model has learned to distinguish between different eye disease categories and healthy images effectively. It contributes to the field of eye disease detection through the analysis of color fundus images by providing a reliable and efficient diagnostic system.
Keywords
Introduction
The human retina, a delicate and intricate neural tissue lining the back of the eye, plays a pivotal role in vision by grasping and interpreting light signals. However, this vital organ is susceptible to various pathologies that, if undetected and untreated, can lead to irreversible vision impairment. Among these, diabetic retinopathy (DR), media haze (MH), and optic disc cupping (ODC) stand out as significant contributors to visual morbidity.
Globally, approximately 2.2 billion individuals experience either near or distance vision impairments. In at least 1 billion of these cases, vision impairment is either preventable or has not yet been addressed. 1 DR, a common complication of diabetes, poses a substantial threat to vision health. The condition manifests as damage to the blood vessels in the retina, leading to leakage and abnormal growth.
DR has the potential to result in various severe eye complications. Over time, approximately 1 in 15 individuals with diabetes will experience diabetic macular edema (DME). DME occurs when blood vessels in the retina release fluid into the macula, a vital region of the retina essential for clear central vision, leading to blurred vision. The progressive and irreversible loss of sight caused by glaucoma is caused by increased pressure within the eyeball. 2 Additionally, DR can stimulate the growth of abnormal blood vessels that extend from the retina, obstructing the drainage of fluid from the eye and giving rise to a form of glaucoma, a group of eye diseases known for causing visual impairment and blindness. 3 The identification of DR through automated means is crucial, given that it stands as the primary contributor to irreversible vision impairment among the working-age populace in developed nations. 4 Figure 1 shows the normal human eye with various parts outlined.

Normal human eye with various parts.
MH, characterized by opacities in the ocular media, can impede the clarity of fundus images, complicating the diagnosis of underlying retinal conditions. The opacity in the eye caused by MH can serve as an indicator for the onset of conditions such as cataracts, corneal swelling, vitreous cloudiness, or constricted pupils. Therefore, it is crucial to promptly and precisely diagnose MH to prevent potential vision loss that may result if the condition is not treated in a timely manner. 5
ODC, often associated with glaucoma, involves the excavation of the optic nerve head, causing progressive damage to the optic nerve fibers. In humans, glaucoma is the second leading cause of blindness, and the number of cases is steadily increasing.6–8 Optic nerve cupping is divided into two primary categories. The initial classification is attributed to injury or trauma, whereas the second arises from diverse medical conditions or diseases.
9
Several medical conditions associated with optic nerve cupping encompass
Optic nerve head drusen Glaucoma Optic nerve atrophy Optic neuritis
The traditional methods of diagnosing retinal diseases have been labor-intensive, and reliant on manual examination by skilled ophthalmologists. However, with the emergence of deep learning (DL) technologies, particularly within the realm of convolutional neural networks (CNNs), there has been a paradigm shift in the approach to retinal disease diagnosis. It is promising that DL models are capable of learning intricate patterns and features automatically based on vast datasets, providing a route to accurate and efficient diagnosis.
Variability in image quality, noise, and low-contrast conditions can impair the ability of models to accurately capture disease-specific features, often limiting their performance in real-world applications. Current methodologies for retinal disease classification primarily rely on single CNN architectures, which, while effective in some cases, may lack robustness across diverse datasets. Existing approaches can struggle with feature extraction, particularly in noisy or low-contrast images, resulting in inconsistent accuracy. Furthermore, models that do not effectively integrate multi-source features may fail to capture the complexity of retinal diseases, reducing their ability to generalize across cases.
To address these challenges, we propose a novel methodology utilizing dual CNNs for feature extraction, followed by canonical correlation analysis (CCA) fusion to enhance feature representation. By employing two CNNs, the proposed model captures a broader range of characteristics within retinal images, and CCA fusion effectively combines these complementary features, creating a comprehensive representation. This study initially focuses on evaluating the efficacy of raw feature extraction and CCA fusion in classifying retinal disease without the use of enhancement techniques such as contrast adjustment or noise handling.
This foundational approach allows for a baseline assessment of model performance under standard imaging conditions, providing a basis for future integration of contrast enhancement and noise-handling methods. Ultimately, the methodology aims to improve the robustness and accuracy of retinal disease classification, contributing to the development of more reliable diagnostic tools for clinical applications.
Research objective
The following are the research objectives of the current study
To design and implement a hybrid CNN architecture for extracting suitable features from retinal fundus. To apply CCA for fusing features extracted by the hybrid CNN. This fusion aims at capturing complementary information from multiple feature spaces. To make use of benchmark datasets RFMiD and RFMiD 2.0 for model training and validation. Testing is to analyze model’s robustness and generalizability across different datasets. To evaluate the proposed model against existing state-of-the-art models to demonstrate its superior performance in terms of classification accuracy. To contribute to automated medical diagnosis by providing a more accurate and reliable tool for the classification of retinal diseases, aiding ophthalmologists in early detection and treatment.
Research contributions
The following key contributions are made in this study.
A novel hybrid CNN architecture is introduced that improves feature extraction from retinal fundus images by capturing low-level and high-level features more effectively than traditional CNN models. The CCA fusion method is utilized in this study for feature fusion. Features extracted using multiple CNN models are combined for enhanced feature representation and improved classification performance. The proposed hybrid CNN model is used for experiments on the latest RFMiD and RFMiD 2.0 datasets for performance evaluation in comparison to existing state-of-the-art approaches. A thorough evaluation of the model is carried out concerning robustness and ability to generalize across different datasets. The proposed model enhances the tools available for the automated classification of retinal diseases, potentially improving clinical workflows and patient outcomes by aiding in the early and accurate diagnosis of retinal conditions.
The rest sections of the article include the following. Section “Overview of existing literature” provides the summary of related work. Section “Materials and methods” presents the suggested method, covering aspects such as image acquisition, preprocessing, data augmentation, feature extraction, and classification. In Section “Results”, the statistics obtained post-training for the customized CNN models are outlined and classified using machine learning models. The study is concluded in Section “Conclusion and future direction”.
Overview of existing literature
In literature, retina disease classification using DL has been extensively explored to improve diagnostic accuracy and efficiency. Numerous studies have demonstrated the efficacy of identifying and differentiating between various retinal conditions. 10
In study by Das et al. 11 the author developed and evaluated a compact CNN using four retinal image datasets: DRD, 12 Messidor-2, 13 IDRiD, 14 and RFMiD, 15 Employing a 12-fold cross-validation technique, the model achieved notable accuracy: 79.96% on DRD, 94.75% on Messidor-2, 96.74% on IDRiD, and 89.10% on RFMiD. These results highlight the model’s effectiveness and adaptability across various datasets, providing a valuable tool for the early detection of retinal diseases and improving patient care in ophthalmology. The study 16 explored the use of various DL models to detect eye diseases using fundus imaging. An automated system was developed to process and enhance a dataset of 4697 images through brightness and contrast adjustments, feature extraction, data augmentation, and image classification using CNN. Among the five models evaluated, ResNet152 proved the most effective, achieving an AUC score of 96.47%. The paper also includes visualizations of model predictions, highlighting confidence scores and heatmaps that indicate focal points, especially where lesions are detected.
The study by Nagamani and Rayachoti 17 aims to develop a DL model using OCT images to enhance the classification and segmentation of retinal diseases. It classifies volumetric OCT images, recognizing conditions such as DME, CNV, AMD, and DN. The research introduces a Modified ResNet-50 approach and uses a Bi-LSTM-based deep recurrent CNN for image segmentation. The model, tested on publicly available datasets, achieves 99.76%. Similarly, 18 introduces the Fundus-DeepNet system, an automated multi-label DL classification system for identifying multiple ocular diseases in fundus images. A comprehensive pre-processing process involves cropping, resizing, enhancing contrast, removing noise, and enhancing data. Deep feature representations are then extracted using High-Resolution Network and Attention Block, further enhanced by SENet Block to consolidate them into a single representation. Finally, a discriminative restricted Boltzmann machine classification model, incorporating a Softmax layer, generates a probability distribution for identifying eight ocular diseases.
The authors address the challenge of automatic detection of retinal diseases, emphasizing the limitations associated with low contrast, illumination inhomogeneity, convergence rates, overfitting, and classification errors. 19 The proposed approach employs ensemble-based DL techniques for enhanced retinal disease prediction, structured into pre-processing, adaptive Gaussian kernel PDF-based matched filtering, and post-processing for segmentation, and classification stages. The classification stage employs three approaches, EfficientNet B0, VGG16, and ResNet-152 20 where the feature vectors are fused through an ensemble approach. The proposed method demonstrates impressive performance metrics, including 99.71% accuracy, 98.63% precision, 98.25% recall, and 99.22% F-measure.
The authors 21 introduce an automated DL-based framework for the non-invasive diagnosis of multiple eye diseases using color fundus images. The study utilizes a multi-class eye disease dataset RFMiD 15 to develop an efficient diagnostic system. The framework involves extracting multi-class fundus images from a multi-label dataset and applying various augmentation techniques to enhance real-time robustness. A multi-layer neural network is developed to train and test images for the diagnosis of different eye problems. The key component extracts relevant features from the input color fundus image dataset, and these processed features are used for prognostic diagnostic determinations.
The study by Pan et al 22 aims to enhance ophthalmic diagnostics through an automated deep-learning system. In total, 1032 fundus images were gathered from 516 patients using a fundus camera. InceptionV3 and ResNet-50 DL models were employed for classification. A 93.81% accuracy was achieved for ResNet-50 and 91.76% accuracy was achieved for Inception V3. The research serves as a reference for clinical diagnosis or screening of DR and other eye diseases. Along the same directions, 23 addresses the challenge of automatically detecting disease states of the retina by developing a model VGG-19 24 architecture. The model utilizes transfer learning and is educated on an extensive dataset comprising 84,568 cases of OCT 25 retinal images, covering four conditions: CNV, DN, DME, and normal retinal form. The proposed model achieves a remarkable classification accuracy of 99.17%, with specificities of 0.995 and sensitivity of 0.99, surpassing existing models.
The research by Pandey et al. 26 endeavors to develop an algorithm for classifying various retinal pathologies in fundus photographs. The researchers utilized a deep convolutional ensemble comprising five CNNs to categorize retinal images into DR, glaucoma, ARMD, and normal eyes. The CNN architecture was based on the InceptionV3 model with pretraining on the ImageNet dataset, using 43,055 images from 12 datasets.They used DiaretDB, 27 Drishti-GS, 28 DRIVE, 29 HRF, 30 IDRiD, 14 Kaggle-39, 31 Kaggle-DR, ODIR, 32 MESSDIDOR, 33 ORIGA-light, 34 REFUGE, 35 and STARE 36 datasets. The study found that the DCE achieved a mean accuracy of 79.2%.
The research by Thanki et al. 37 introduces an innovative computer-aided triage system that incorporates a DL and ML for the development and analysis of color retinal fundus images, specifically aimed at classifying images indicative of glaucoma. The methodology involves extracting deep features from retinal images through a deep neural network, then classification and analysis utilizing various ML classifiers. The experimental findings demonstrate that the integration of a DL with a logistic regression-based classifier surpasses the performance of existing glaucomatous triage systems.
The study Almustafa et al. 38 employs the STARE dataset, 36 comprising 385 retinal images with various defects. Pre-processing techniques, including augmentation and normalization, are applied to refine features for training DL algorithms. The paper evaluates five DL models EfficientNet, 3-Layers CNN, VGG-16, InceptionV2, ResNet-50, and tuning hyperparameters such as batch size. EfficientNet emerges as the best-performing model, achieving 98.43% accuracy. For each of these 14 retinal defects, unique model configurations, hyperparameter tuning, and preprocessing techniques are credited with its success.
To enhance clinical usability, the study by Ho et al. 39 aimed to simultaneously detect multiple ophthalmic pathologies. The researchers utilized 2560 images from the RFMiD, dividing them into training (1920) and validation (640) sets. To predict the presence of any pathology and categorize 28 different pathologies, five CNN architectures were selected and trained. To optimize training, models were designed to minimize asymmetric loss, a modified version of binary cross-entropy. As a result of the ensemble network, an AUROC score of 0.9613 was demonstrated for disease screening. Among the individual models, the SE-ResNeXt architecture achieved the highest single network score at 0.9586.
A CNN has been effectively applied to color fundus images for automated glaucoma detection. On the ACRIMA 40 database, the method achieved high performance, with an accuracy of 96.64%, sensitivity of 96.07%, specificity of 97.39%, and precision of 97.74%. 41 The research by Rodriguez et al. 42 utilizes the MuReD dataset constructed from publicly available fundus disease classification datasets. Image data quality is enhanced through a series of processing steps that encompass a broad range of diseases. It shows improvements in AUC scores of 7.9% for disease detection and 8.1% for disease classification over state-of-the-art approaches for the same task.
The authors utilize customized particle swarm optimization (CPSO) combined with four advanced machine-learning classifiers to enhance glaucoma prediction performance. It operates through five main phases preprocessing, segmentation, feature extraction, selection of the best-scored features, and classification using the CPSO-based classifier. The images are sourced from the publicly available Digital Retinal Images for Optic Nerve Segmentation dataset. These features are then employed for training and testing, generating multiple result sets from various CPSO and supervised machine-learning classifier combinations. 43
The author’s focus is on the development of an intelligent algorithm using DL for the classification. 44 A dataset comprising 501 images, including normal eyes and those with RVO. Fundus disease specialists categorized the images into four groups: healthy fundus, RVO, BRVO, CRVO, and MBRVO. The ResNet18 45 network model was employed for diagnosis. The intelligent system exhibited a specificity of 100% for healthy fundus. For the RVO groups, various attention mechanisms yielded specificities ranging from 0.45 to 0.91, with the ResNet18+ model achieving the highest specificities and accuracy across all groups.
The study by Elangovan and Nath 46 introduces a deep ensemble model using stacking ensemble learning for classifying glaucomatous and normal fundus images, leveraging 13 pre-trained CNN models in 65 configurations. A two-stage ensemble selection with probability averaging and support vector machine (SVM) final classification achieves robust performance. Testing on modified databases (DRISHTI-GS1-R, ORIGA-R, RIM-ONE2-R, LAG-R, ACRIMA-R) shows accuracies of up to 99.6%.
The authors in Abitbol et al. 47 aim to evaluate the capability of a DL framework for differentiating between DR, SCR, RVOs, and normal eyes using ultra-widefield color fundus photography. The study employs cross-validation and augmentation techniques for robust performance, utilizing an Adam optimizer for training. The model achieves its best performance at 10 epochs, yielding an accuracy of 88.4%. Specific disease-wise assessments reveal notable results: For DR, an accuracy of 85.2%; for RVO, accuracy is 88.4%; for SCR, accuracy is 93.8%; and for Healthy, an accuracy of 86.2%.
The objective of Kumar and Bindu 48 fundus imaging is to examine eye-related anomalies. The framework involves preprocessing steps such as contrast enhancement, oversampling, resizing, and normalization. Densenet201 and EfficientNetB4 are employed for disease risk detection, and ResNet105 is added for multi-disease classification. The proposed framework is trained and validated on the RFMiD and tested on the ODIR dataset. The systematic review is given in Table 1.
Review of related studies.
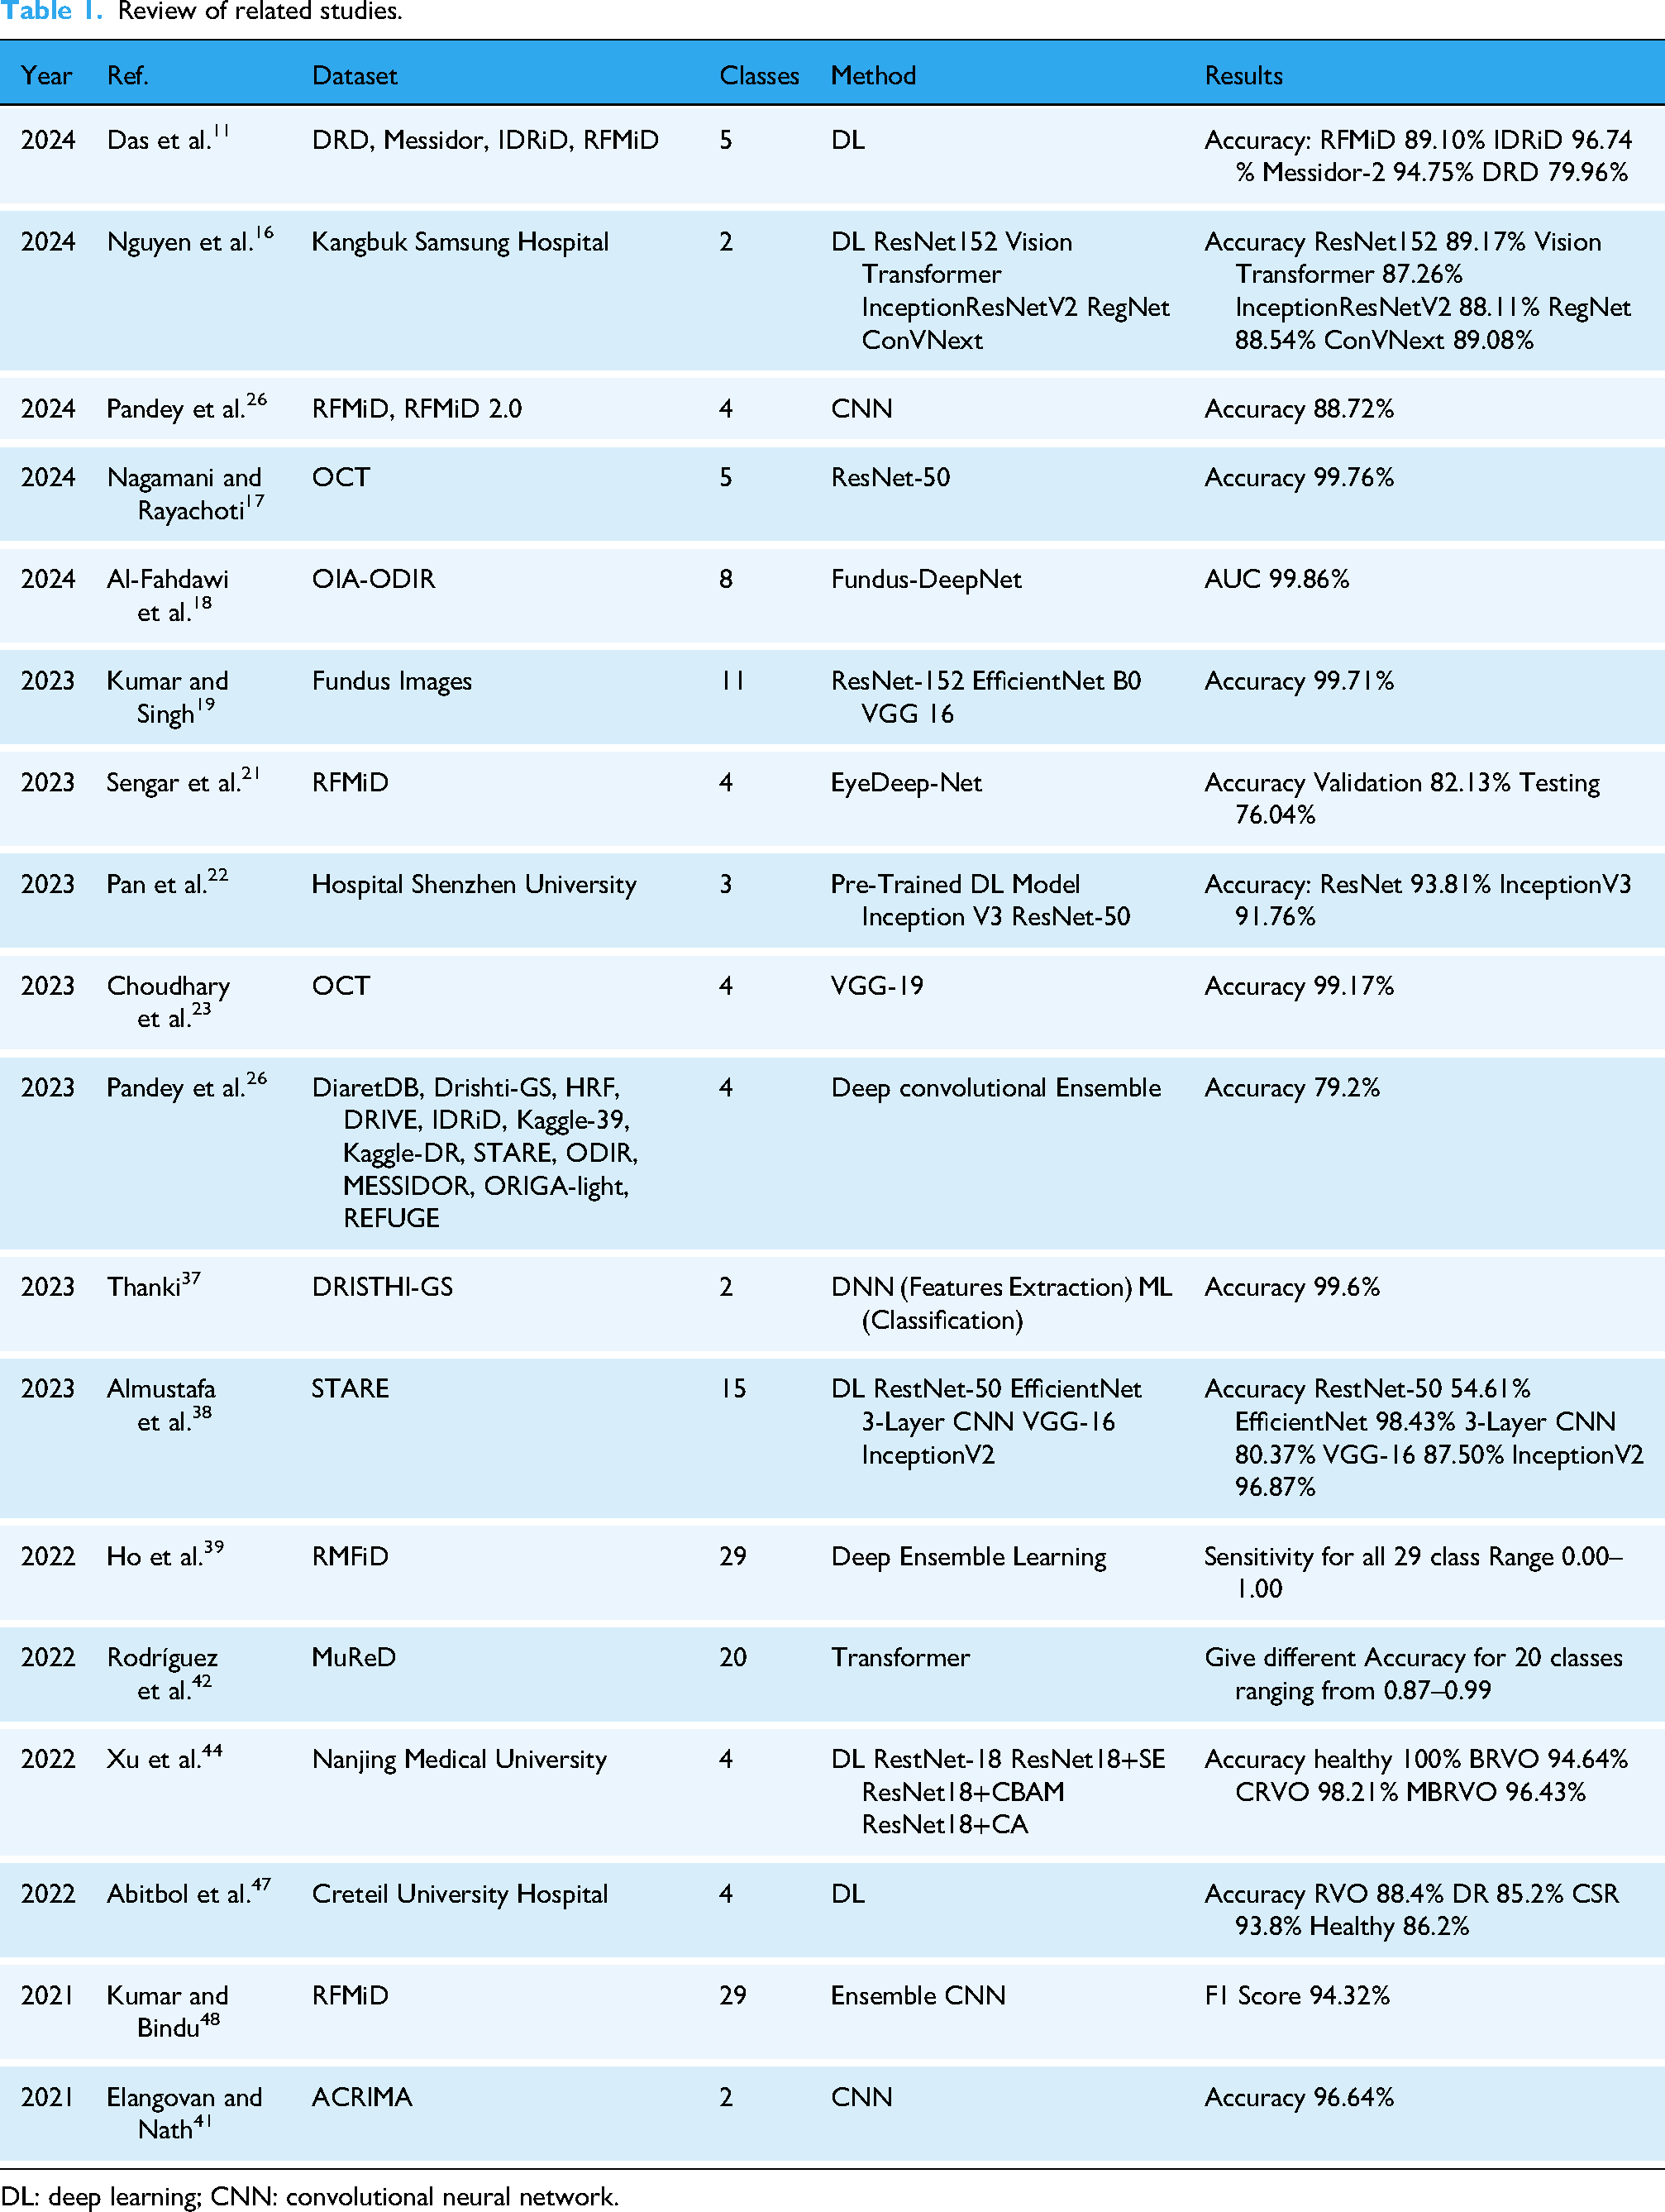
DL: deep learning; CNN: convolutional neural network.
Materials and methods
To identify retinal disorders using fundus images, we propose DL and ML algorithms. Data is gathered from two datasets RFMiD 15 and RFMiD 2.0. 49 Multi-labeled and single-labeled images are included in these datasets. Single-label diseases are separated and diseases with more images are selected. The suggested methodology is shown in Figure 2. The diseases we select contain four classes given in Table 2. After acquiring the dataset we perform preprocessing steps. Due to the different sizes of images in the dataset, preprocessing involves resizing them to the same size, augmentation to extend and balance the dataset, then cropping the unwanted area to increase the efficacy of the model and partitioning them into training and testing sets. To reduce computing time, we convert images into an array and perform one hot encoder.

Proposed approach’s architecture.
Number of images in RFMiD and RFMiD 2.0 datasets.

DR: diabetic retinopathy; MH: media haze; ODC: optic disc cupping.
Further, we implement two CNN models to extract features for three retinal diseases and one healthy class. After feature extraction from two CNNs CCA fusion is utilized to concatenate the features and apply ML algorithms to classify retinal images and healthy class. Results using ML models are analyzed in the context of accuracy, recall, sensitivity, precision, and F1 score.
Data acquisition
The dataset was compiled from RFMiD 15 and RFMiD 2.0, 49 with a focus on eye disease classes that contained over 100 fundus images. The process involved converting the originally multi-labeled dataset into a multi-class dataset, essentially transforming it from a multi-label object detection problem to a multi-class classification problem. In the final dataset, images were chosen based on their affiliation with a single class and having more than 100 images in their respective categories. Excluding the normal category, three specific diseases DR, MH, and ODC were singled out from a pool of 49 diseases. The Total Number of images with classes DR, MH, ODC, and WNL are 471, 334, 172, and 931, respectively as mentioned in Table 2.
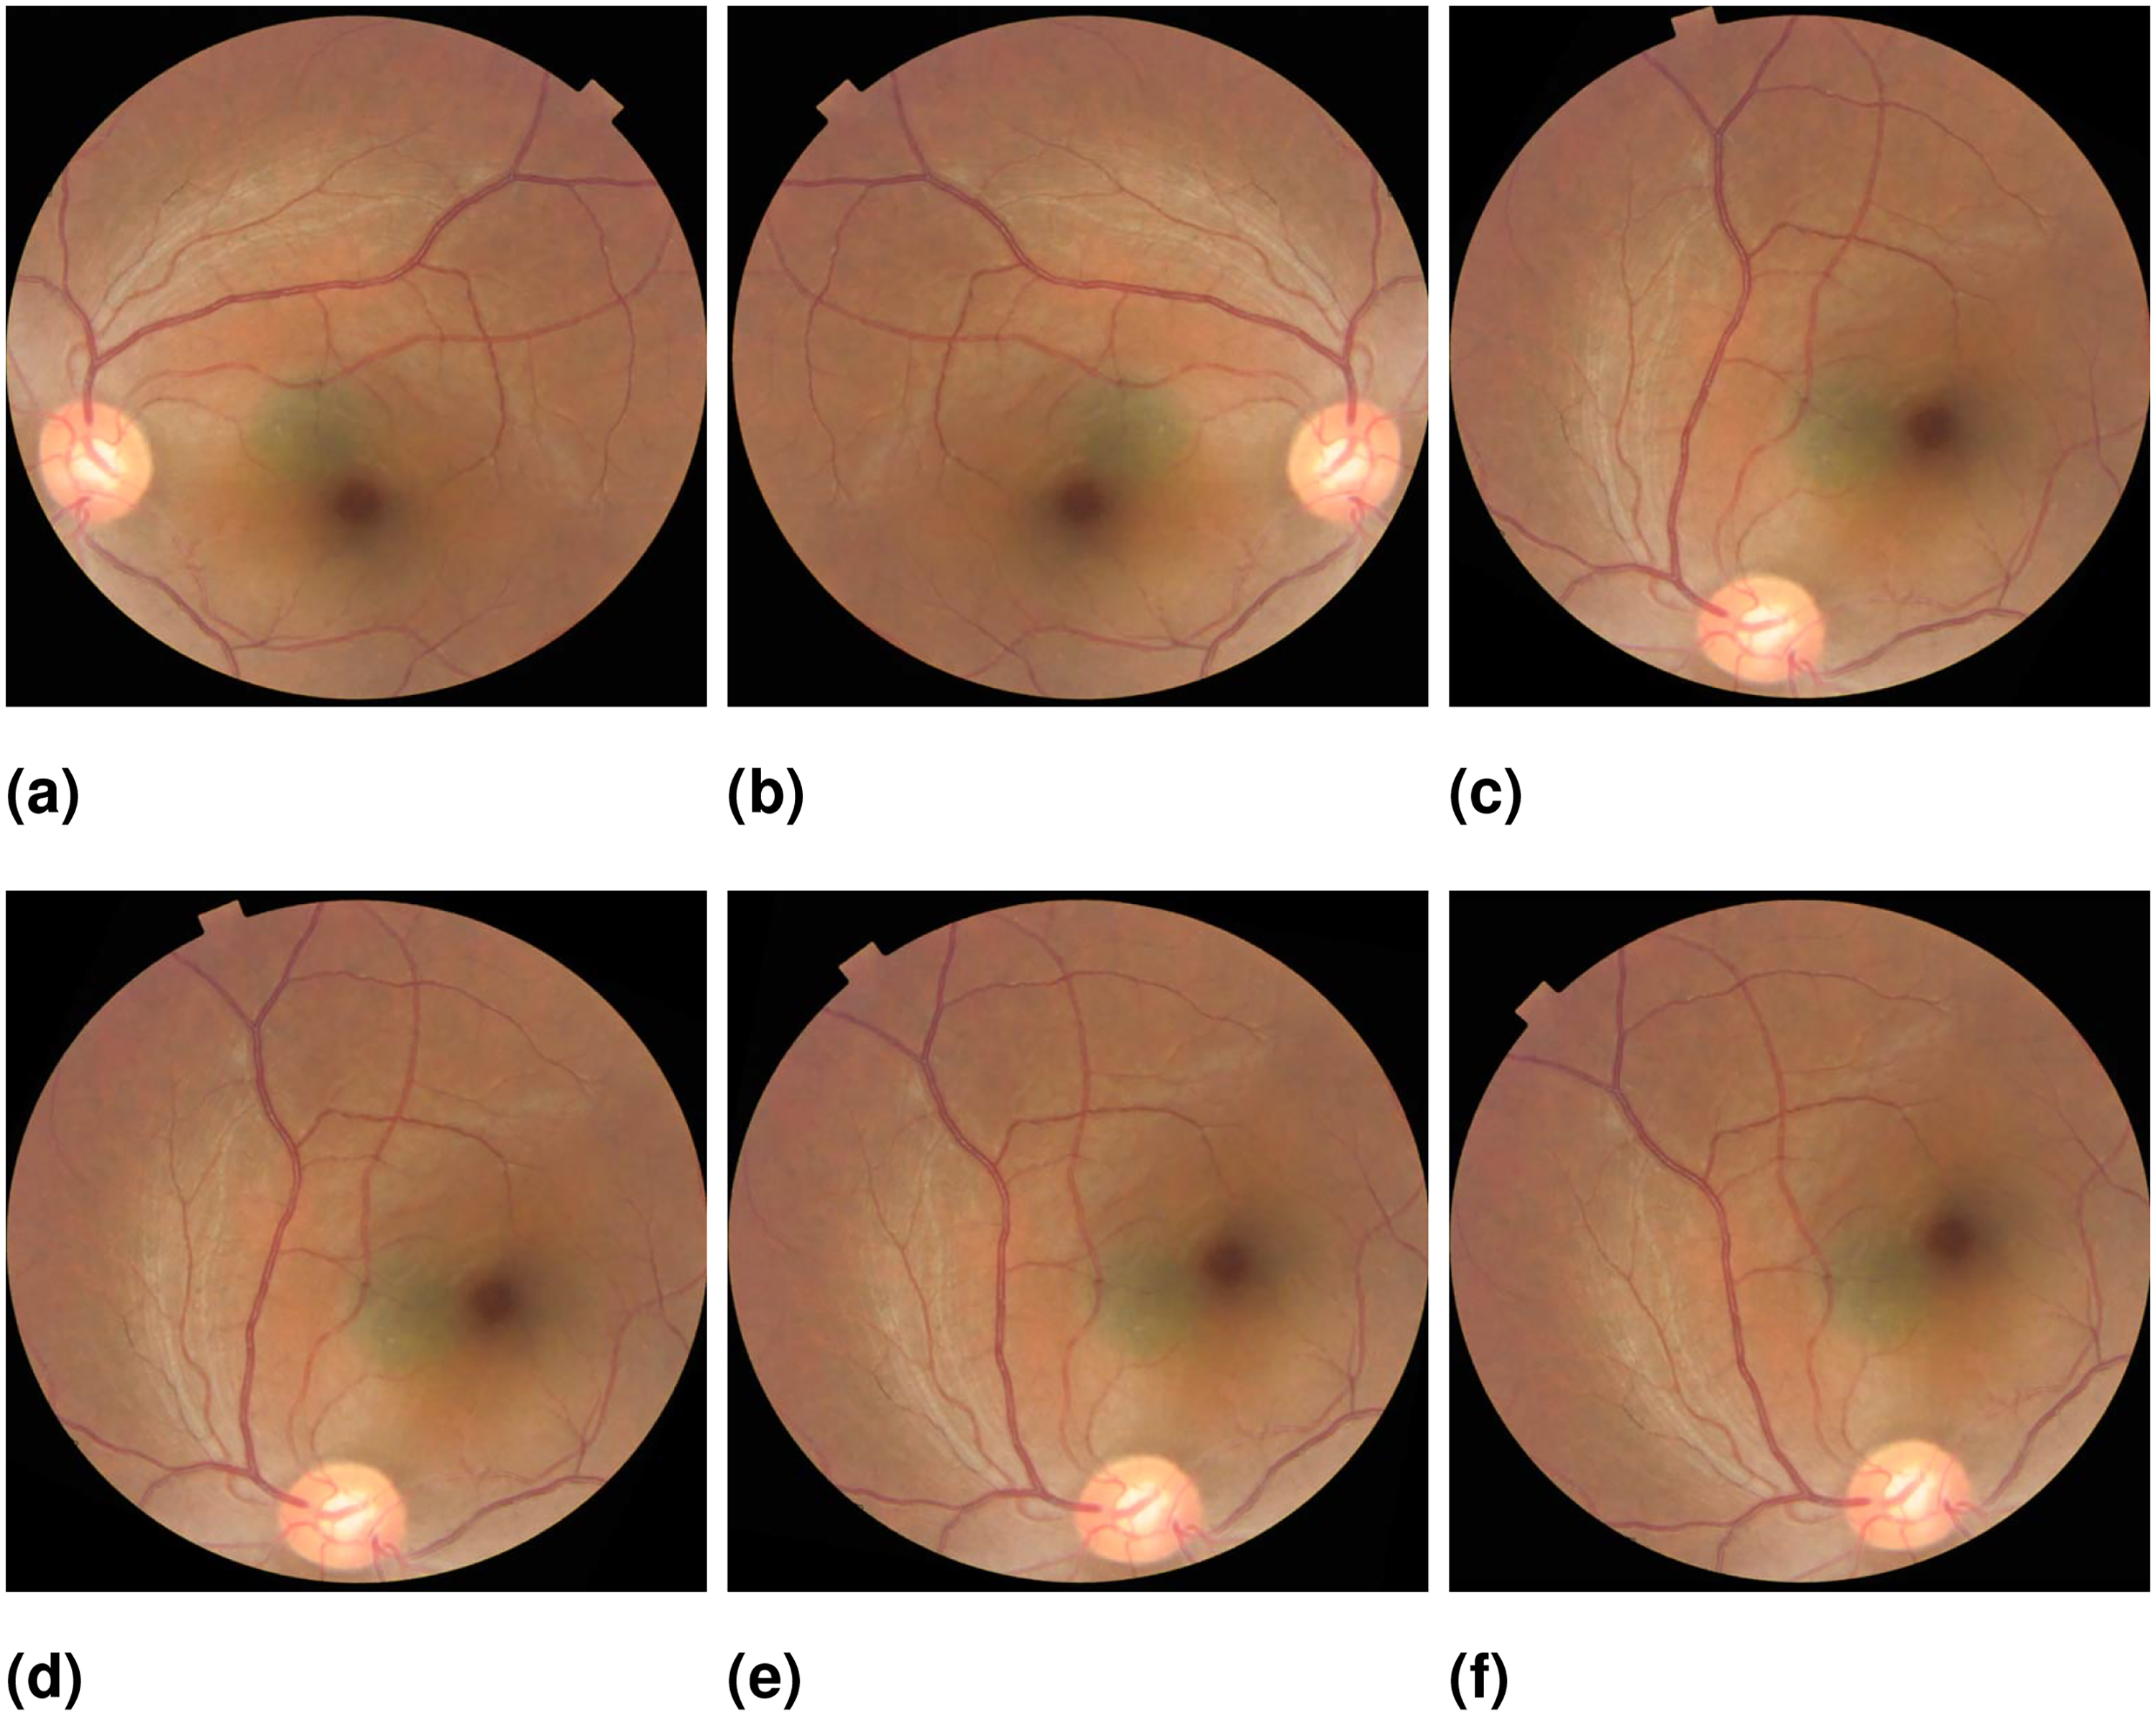
A few sample images concerning each class from the datasets are shown in Figure 3.

Sample images for, (a) Diabetic retinopathy, (b) Media haze, (c) Optic disc cupping, and (d) Healthy eye.
Preprocessing
Preprocessing is crucial for enhancing the quality of image visualization, significantly impacting the success and accuracy of subsequent stages in the proposed method. Medical images often present additional challenges such as poor quality or extraneous content, which can hinder effective visualization. Addressing these issues is essential, as low-quality images can result in unsatisfactory outcomes. 50 By using histogram equalization techniques to enhance images, details are lost and the impression is artificial.51,52 In the preprocessing phase, techniques such as data augmentation, resizing, cropping, and one-hot encoding are employed to enhance model efficiency.
Resize
Upon analyzing images across all four classes DR, MH, ODC, and WNL, the images’ shapes in the dataset varied. To address this, all images were synthesized to have a uniform shape of 224
Data augmentation
Data augmentation is indeed a crucial step in preprocessing for machine learning tasks, especially in image classification. The Literary works21,54,55 use data augmentation for classification. We gather 1908 images from the dataset. We organized the dataset into four distinct classes, namely DR, MH, ODC, and normal (WNL). At the outset, the dataset includes 334 images depicting MH, 471 images depicting DR, 172 images depicting ODC, and 931 images of WNL as shown in Table 2. By applying various transformations to the original data, such as flipping, rotating, scaling, or adding noise, we can increase the variety of the dataset, thereby reducing overfitting probability and helping the model generalize better to unseen data.
Flipping an image horizontally or vertically creates mirror images while rotating an image at different angles introduces additional variations. We use horizontal flips and rotation at different angles such as 60°, 65°, 80°, 90° Sengar et al. 21 used for fundus images. Figure 4 shows the original image of ODC and different augmented images. After implementing data augmentation on the dataset to address the problem addressing data overfitting. Moreover, we encountered a significant class imbalance issue where the WNL class had a substantially higher number of images compared to the other classes. This created a challenge as it could potentially introduce biases in the results. To tackle this problem, we implemented data augmentation techniques to balance the classes. For classification, we split the datasets into 70:20:10 for training and testing, and validation sets. This implies that 70% of randomly selected Images were employed during the training phase, while 20% were set aside for testing and 10% was used for validation.
(a) Original (b) flipped (c) 60° rotation (d) 65° rotation (e) 80° rotation (f) 90° rotation.
Cropping
Cropping as a preprocessing step is essential in many image-related tasks, helping to focus on the most relevant parts of the data, improve model performance, and reduce computational demands. It involves removing unwanted outer areas from an image or signal to focus on the region of interest. In terms of classification accuracy, cropping-based image classification performed better than non-cropping-based image classification. 56
One-hot encoder
The one-hot encoder is used to transform categorical labels into a numerical format that the ML model can interpret. By converting each class label into a binary vector with a single “1” representing the class and “0”s elsewhere, one-hot encoding enables a clear and distinct representation of each class. This transformation supports compatibility with neural network architectures by allowing the use of categorical cross-entropy as a loss function, which compares these one-hot encoded labels with model predictions. Ultimately, this technique enhances the model’s ability to differentiate between classes effectively, improving its capacity to learn and generalize in multi-class image classification tasks.
Experimental setup
The study used Python to conduct trials on a 64-bit version of the Windows 10 operating system. This system was powered by an Intel Core i5 7th Generation CPU, contained 8 GB of RAM, and offered a 237 GB storage capacity.
Proposed deep learning architecture
DL is highly effective for image feature extraction due to its capability to autonomously acquire hierarchical patterns and representations from raw pixel data. CNN layers, such as convolutional, pooling, and fully connected layers, work together to detect and abstract features like edges, textures, and shapes, which are crucial for understanding image content. Feature fusion is a pivotal technique in leveraging the strengths of multiple feature sets derived from different models or sources. In this study, we employ CCA to fuse features extracted from two CNN models. This approach aims to enhance the representation of data by capturing the complementary information provided by each model. Once features are extracted, traditional machine learning algorithms, such as SVMs, random forest (RF), etc. can be employed for image classification. This hybrid approach leverages the strengths of CNNs in feature extraction and the robustness of classical machine learning methods for classification tasks, often resulting in improved accuracy and performance in image analysis applications.
Deep CNN architecture
Classification is a crucial step in differentiating between disordered and healthy images. Recent studies have proposed various schemes for utilizing CNN models. One approach is to train the model using extensive datasets, while another involves using a pre-trained model through transfer learning. The proposed method employs a hybrid CNN model, comprising two main blocks: CNN-1 and CNN-2. These blocks first train on a large dataset of images, and then transfer the learned knowledge to subsequent blocks to assist in disease diagnosis. CNN-1 and CNN-2 contain 12 and 20 layers, respectively, including 2-dimensional Conv2D layers, and batch normalization layers. Additionally, they feature max pooling, dropout, and dense layers. Table 3 provides configuration details of both CNN models while Tables 4 and 5 provide a detailed overview of the layers for both CNN models.
Configuration of both convolutional neural network (CNN) models.

An overview of 12-layer convolutional neural network (CNN).

An overview of 20-layer convolutional neural network (CNN).

In the proposed approach, we used CCA fusion to concatenate features extracted from both CNN models. The ensemble method’s primary advantage lies in its ability to leverage the complementary strengths of individual models, potentially leading to improved diagnostic accuracy compared to using each model independently. The 20-layer CNN, for instance, includes batch normalization and additional layers that enhance feature extraction, while the 12-layer CNN may perform better in terms of computational efficiency.
Feature extraction
Feature extraction is a critical component of the proposed model. In this study, we employed two CNNs to extract complementary features from retinal fundus images. CNN-1, structured with 12 layers, captures fundamental image patterns through a series of convolutional and pooling layers. Its output is a high-dimensional feature map, which is then flattened into a one-dimensional array for further processing. CNN-2, with its more complex architecture of 20 layers, including batch normalization and additional convolutional layers, is designed to capture more intricate features that are crucial for identifying subtle indicators of DR. Similar to CNN-1, the output of CNN-2 is also flattened, ensuring a consistent format for feature representation.
To effectively combine the features extracted from both CNNs, we employed CCA fusion. This method aims to identify linear combinations of the features from CNN-1 and CNN-2 that maximize their correlation, thereby enhancing the overall feature representation. The flattened feature vectors from both networks are input into the CCA algorithm, which computes canonical variables that best represent the combined features. The resulting fused feature vector retains the most relevant information from both models, providing a comprehensive representation for the final classification layer. This approach not only improves diagnostic accuracy but also leverages the unique strengths of each CNN in the detection of retinal diseases. Let 

Feature selection through CCA fusion
The features extracted from the two CNNs are initially high-dimensional and contain redundant information. To reduce redundancy and maximize relevant information, CCA is applied for feature selection. CCA works by identifying and preserving only those features that are maximally correlated across the two CNNs. This process selects a subset of features from each CNN output, ensuring that the final feature set includes only the most informative attributes of the retinal diseases. CCA fusion effectively captures disease-specific patterns by retaining features that show a high mutual correlation. Mathematically, CCA seeks to find transformation matrices 


After determining the optimal transformation matrices 


Classification with machine learning models
According to Baig, 54 the last step involves classifying testing images of fundus images to determine the kind of disease. The input image was defined in the proposed solution by selecting features and applying the multi-class classification approach. The objective in computing the categorization was to minimize computation time, so we employed machine learning algorithms. The classifiers we have utilized in this study include voting RF, COARSE-KNN, medium-KNN, fine-KNN, SVM, ensemble learning, gradient boosting machines, and Naive Bayes (NB). We utilized three machine learning algorithms as part of an ensemble classifier: SVM, logistic regression (LR), and decision tree (CT) classifier. Table 6 shows the hyperparameters for each model used for ensemble learning.
Parameters for machine learning.

Results
We have conducted experiments to evaluate the proposed CNN model classification methodology, considering both qualitative and quantitative aspects. The evaluation involved testing the proposed method using the data we collected.
Findings on feature extraction utilizing CNNs
After training, the CNN can be used for feature extraction by feeding input data through the network and extracting the output of one of the intermediate layers. These extracted features can then be used as input to another machine-learning model or for further analysis and processing. This technique is often used in transfer learning, where a pre-trained CNN is fine-tuned on a new dataset for a specific task, leveraging the feature extraction capabilities learned from a large dataset.
In this section feature extraction results are given in both statistical as well as graphical form. In numerical form, accuracy, sensitivity, precision, recall, F1 score, and support are given using the formula given in equations (11) to (15).


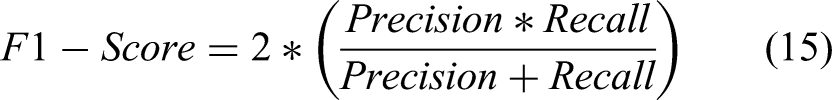

In addition, the Matthews correlation coefficient (MCC) is also used for performance evaluation, as shown in equation (16). MCC estimates the correlation between predicted and actual value and is considered an important performance metric. 57
Feature extraction results using CNN-1
This section will delve into the results of feature extraction using CNN-1. The experiments employed the deep CNN base architecture model with training validation and testing data. Table 7 presents the statistical results of Feature Extraction from the CNN-1 model using data augmentation.
Result for CNN-1 network.

DR: diabetic retinopathy; MH: media haze; ODC: optic disc cupping; CNN: convolutional neural network.
Figure 5 presents the accuracy and loss charts for CNN-1. It is observable in the charts that the model initiates with a starting training accuracy of zero, gradually advancing with increasing epochs.

(a) Model accuracy graph for convolutional neural network (CNN)-1, and (b) Model loss graph for CNN-1.
Feature extraction results using CNN-2
This section will delve into the results of feature extraction using CNN-2. The experiments employed the deep CNN base architecture model with training validation and testing data. Table 8 presents the statistical results of Feature Extraction from the CNN-2 model using data augmentation.
Result for CNN-2 network.

DR: diabetic retinopathy; MH: media haze; ODC: optic disc cupping; CNN: convolutional neural network.
Figure 6 presents the accuracy and loss charts for CNN-1. The plots show that the model starts with zero training accuracy and improves with time as the number of epochs increases.

(a) Model accuracy graph for convolutional neural network (CNN)-2, and (b) Model loss graph for CNN-2.
Classification using machine learning model
The proposed methodology, which concatenates the features extracted by CNN-1 and CNN-2 into a single improved vector via CCA Fusion, was covered in earlier Sections. The classifiers were then given the fused vectors of the upgraded features to classify the input images. The proposed methodology includes several classifiers: Random forest, COARSE KNN, Medium KNN, Fine KNN, SVM, Ensemble Learning, Gradient boosting, and NB. In this step, several machine learning classifiers have been implemented. The goal was to reduce the overall system execution time as much as feasible.
Results for CCA fusion using random forest
A Random Forest classifier was used to categorize the abnormality from the fused feature vector. In this study, the accuracy of the DR class was 90.67%, the MH class was 91.18%, the ODC class was 94.5%, and the WNL class was 92.12%. In Table 9, different statical parameters are cited. A 92.12% accuracy was achieved by this classifier.
Class-wise statistics for CCA fusion using random forest.

CCA: canonical correlation analysis; DR: diabetic retinopathy; MH: media haze; ODC: optic disc cupping; MCC: Matthews correlation coefficient.
Figure 7 illustrates the confusion matrix of RF showing 1520 correct predictions out of 1650 total predictions for four classes. In total 130 are wrong predictions by the RF model, with a higher number of wrong predictions for the DR class.

Confusion matrix for CCA fusion using RF. CCA: canonical correlation analysis; RF: random forest.
Results for CCA fusion using coarse-KNN
A coarse-KNN classifier was used to categorize the abnormality from the fused feature vector. In this study, the accuracy of the DR class was 88.28%, the MH class was 94.12%, the ODC class was 91.87%, and the WNL class was 86.7%. In Table 10, different statical parameters are cited. A 90.24% accuracy was achieved by the Coarse-KNN classifier.
Class-wise statistics for CCA fusion using coarse-KNN.

CCA: canonical correlation analysis; DR: diabetic retinopathy; MH: media haze; ODC: optic disc cupping; MCC: Matthews correlation coefficient.
Figure 8 illustrates the confusion matrix for the Coarse-KNN. Results indicate that the performance of coarse KNN is better compared to RF concerning the MH class while poor for other classes. Overall, it correctly predicted 1489 instances while 161 instances were wrong showing its poor performance compared to the RF model.

Confusion matrix for canonical correlation analysis (CCA) fusion using coarse-KNN.
Results for CCA fusion using medium-KNN
A Medium-KNN classifier was used to categorize the abnormality from the fused feature vector. In this study, the accuracy of the DR class was 87.32%, the MH class was 95.34%, the ODC class was 90.43%, and the WNL class was 86.95. In Table 11, different statical parameters are cited. The model obtains a 90% accuracy using the CCA fustion.
Class-wise statistics for CCA fusion using medium-KNN classifier.

CCA: canonical correlation analysis; DR: diabetic retinopathy; MH: media haze; ODC: optic disc cupping; MCC: Matthews correlation coefficient.
Figure 9 illustrates the confusion matrix for Medium-KNN. Similar to coarse KNN, the performance of the Medium-KNN is better for the MH class with 389 correct predictions while poor for other classes compared to both Coarse-KNN and RF models. The model correctly predicts 1485 instances while 165 instances are wrong predictions.

Confusion matrix for canonical correlation analysis (CCA) fusion using medium-KNN.
Results for CCA fusion using fine-KNN
A Fine-KNN classifier was used to categorize the abnormality from the fused feature vector. In this study, the accuracy of the DR class was 86.6%, the MH class was 96.32%, the ODC class was 89.95%, and the WNL class was 86.95%. Table 12 shows various evaluation parameters for the Fine-KNN model. The model shows an accuracy of 89.94%. Compared to the RF model, it shows better performance for the MH class with a 96.32% accuracy while other classes have reduced values for accuracy, sensitivity, precision, and F1 score.
Class-wise statistics for CCA fusion using fine-KNN classifier.

CCA: canonical correlation analysis; DR: diabetic retinopathy; MH: media haze; ODC: optic disc cupping; MCC: Matthews correlation coefficient.
Figure 10 illustrates the confusion matrix for Fine-KNN. Overall, 1484 instances are predicted correctly which is lower than RF, as well as, other variants of the KNN classifier. However, the number for correct predictions for the MH class is high which is 393. The model made 166 wrong predictions showing its poor performance compared to other models.

Confusion matrix for canonical correlation analysis (CCA) fusion using fine-KNN.
Results for CCA fusion using SVM
An SVM classifier was used to categorize the abnormality from the fused feature vector. In this study, the accuracy of the DR class was 89.95%, the MH class was 92.4%, the ODC class was 94.74%, and the WNL class was 91.63%. In Table 13, different statical parameters are cited. 92.18% accuracy was achieved by this classifier.
Class-wise statistics for CCA fusion using SVM classifier.

SVM: support vector machine; CCA: canonical correlation analysis; DR: diabetic retinopathy; MH: media haze; ODC: optic disc cupping; MCC: Matthews correlation coefficient.
Figure 11 illustrates the confusion matrix for SVM. With the SVM classifier, results for the MH, ODC, and WNL are better for all variants of KNN, as well as, the RF classifier with better accuracy and other parameters. The model made 1521 correct predictions, better than the previously used models’ in this study while 129 predictions were wrong.

Confusion matrix for CCA fusion using SVM. CCA: canonical correlation analysis; SVM: support vector machine.
Results for CCA fusion using ensemble learning
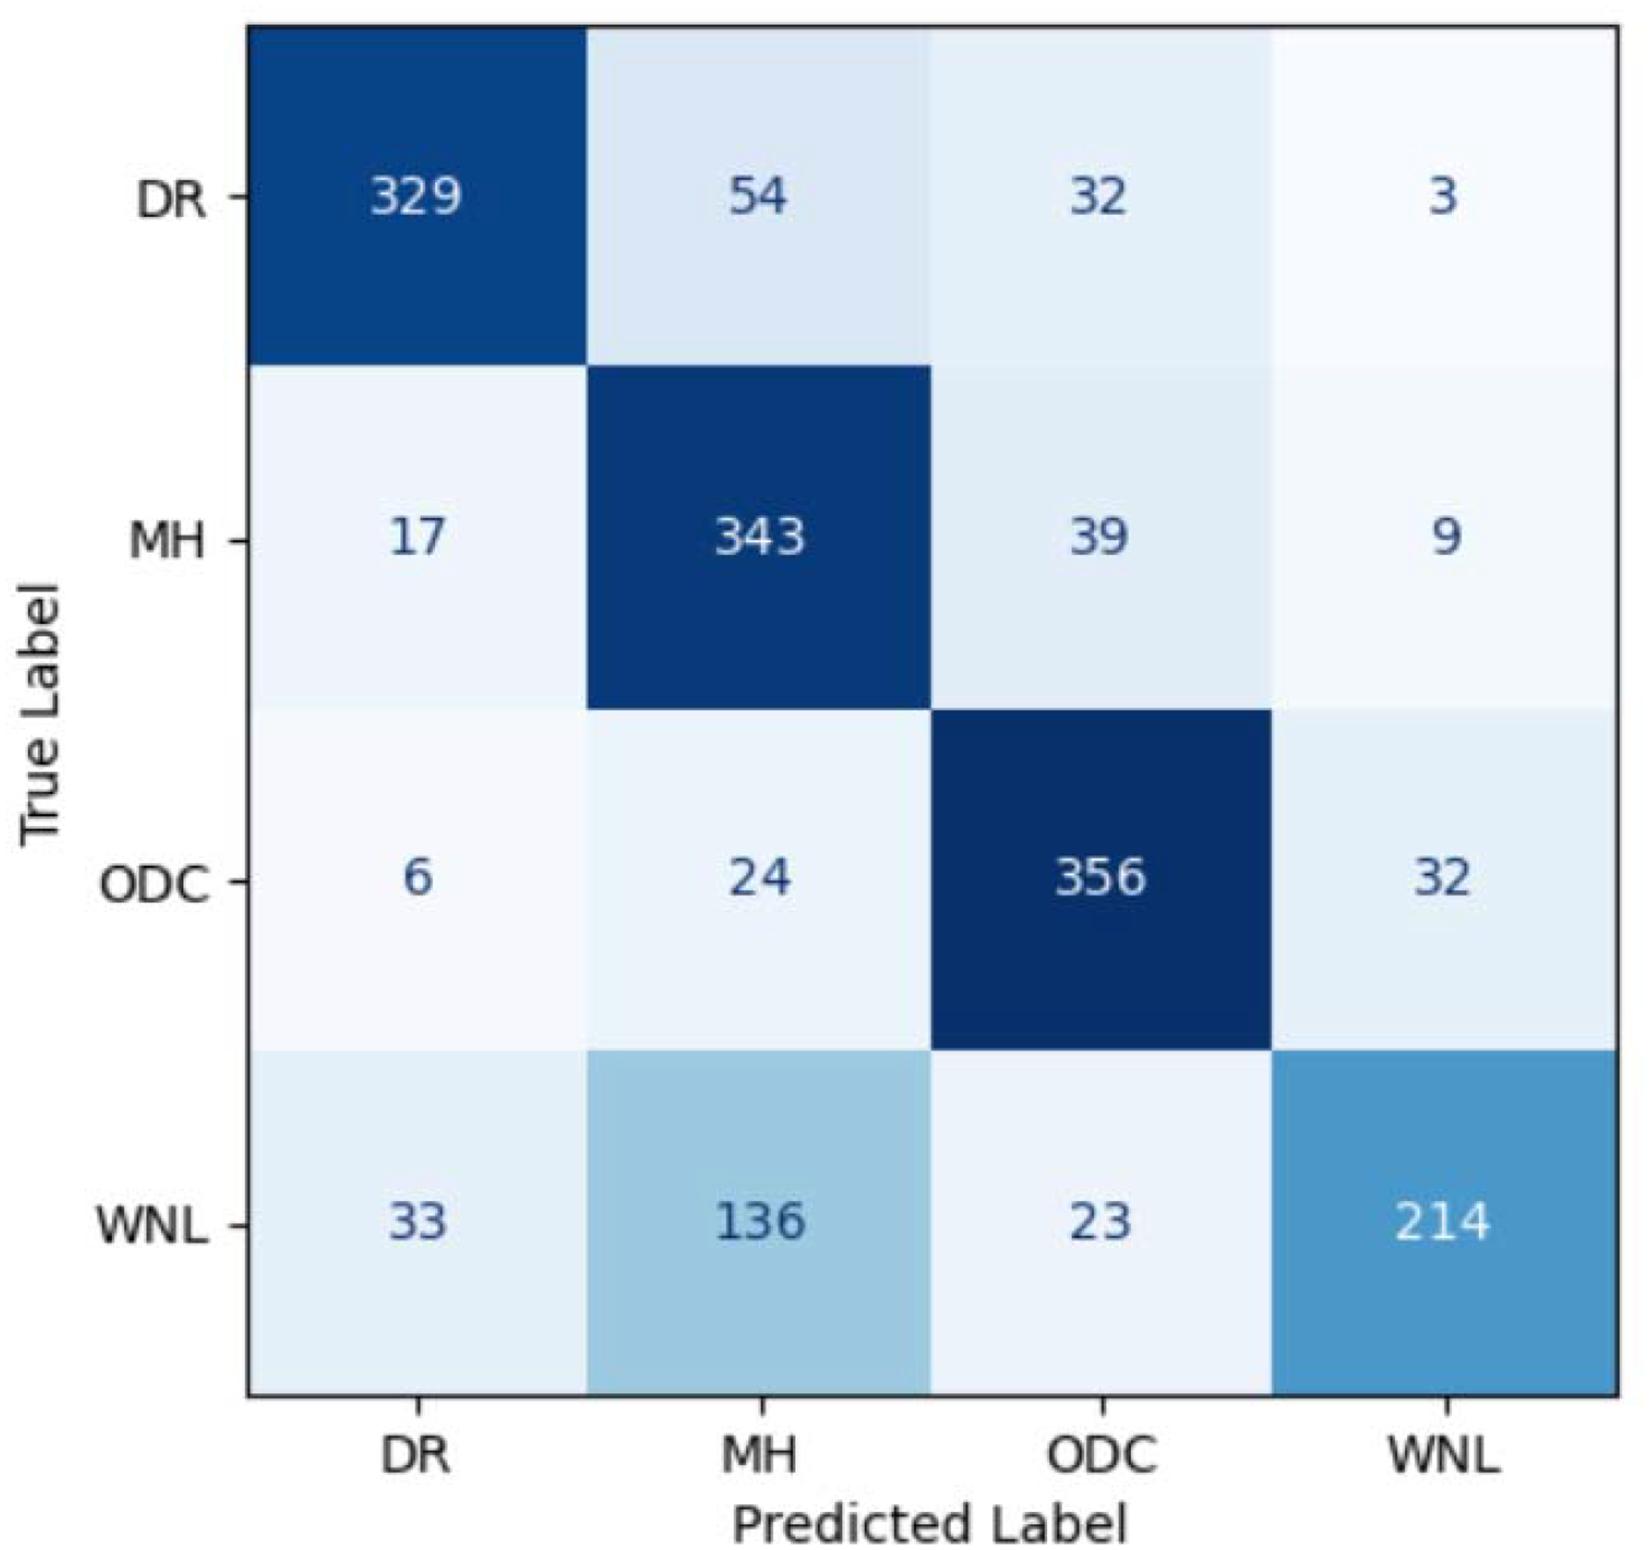
An ensemble learning classifier was also used to categorize the abnormality from the fused feature vector. Using the ensemble classifier, the accuracy of the DR class was 92.34%, the MH class was 93.38%, the ODC class was 92.36%, and the WNL class was 92.12%. In Table 14, different statical parameters are cited. 93.39% accuracy was achieved by this classifier.
Class-wise statistics for CCA fusion using ensemble classifier.

CCA: canonical correlation analysis; DR: diabetic retinopathy; MH: media haze; ODC: optic disc cupping; MCC: Matthews correlation coefficient.
Figure 12 illustrates the confusion matrix for the ensemble classifier. The ensemble model performs superiorly with 1541 corrects predictions, better than all variants of the KNN, RF, and SVM classifier. The ensemble model makes only 109 wrong predictions for four classes.

Confusion matrix for canonical correlation analysis (CCA) fusion using ensemble learning.
Results for CCA fusion using gradient boosting
In addition to KNN, SVM, RF, and ensemble models, a gradient boosting classifier was also used to categorize the abnormality from the fused feature vector. In this study, the accuracy of the DR class was 92.12%, the MH class was 91.67%, the ODC class was 94.25%, and the WNL class obtained an accuracy of 92.36%. In Table 15, different statical parameters are cited. 92.36% accuracy was achieved by this classifier.
Class-wise statistics for CCA fusion using gradient boosting.

CCA: canonical correlation analysis; DR: diabetic retinopathy; MH: media haze; ODC: optic disc cupping; MCC: Matthews correlation coefficient.
Figure 13 illustrates the confusion matrix for the gradient boosting classifier. With the correct prediction of 1528 instances, the model performs better than RF, Coarse-KNN, Medium-KNN, Fine-KNN, and SVM classifiers. The model has the second-best performance after the ensemble model with 122 wrong predictions.

Confusion matrix for canonical correlation analysis (CCA) fusion using the GB classifier.
Results for CCA fusion using NB
An NB classifier was used to categorize the abnormality from the fused feature vector. In this study, the accuracy of the DR class was 78.71%, the MH class was 84.07%, the ODC class was 85.17%, and the WNL class was 52.71%. In Table 16, different statical parameters are cited. 75.27% accuracy was achieved by this classifier.
Class-wise statistics for CCA fusion using NB classifier.
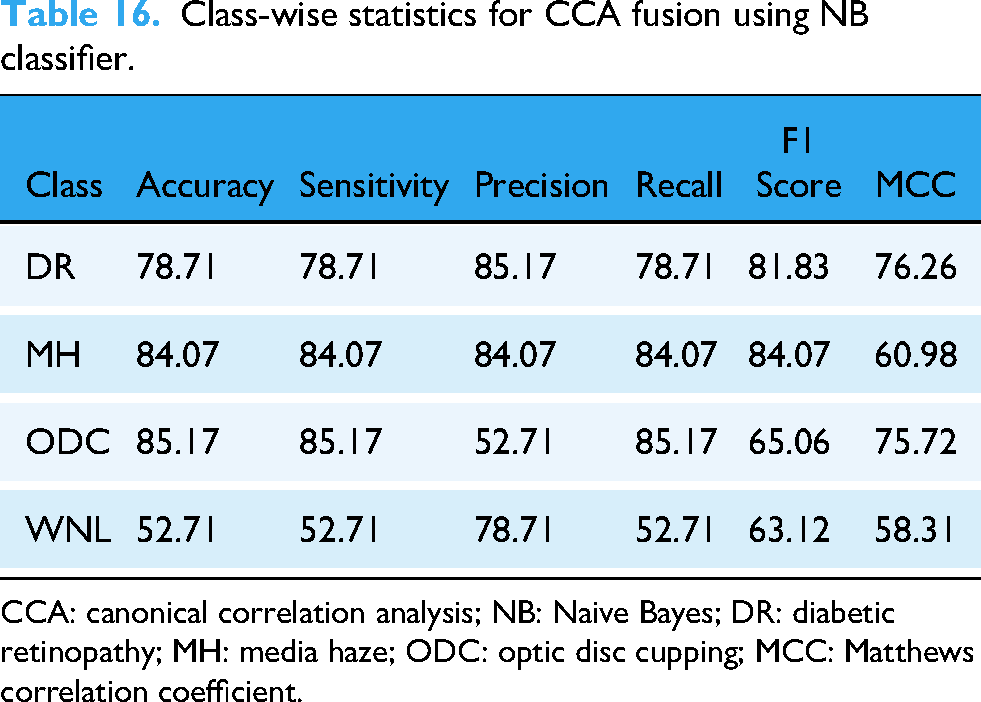
CCA: canonical correlation analysis; NB: Naive Bayes; DR: diabetic retinopathy; MH: media haze; ODC: optic disc cupping; MCC: Matthews correlation coefficient.
Figure 14 illustrates the confusion matrix for the NB classifier. The performance of the NB classifier is very poor with only 1242 correct predictions and 408 wrong predictions which are the highest among all models used in this study.
Confusion matrix for CCA fusion using NB classifier. CCA: canonical correlation analysis; NB: Naive Bayes.
Performance comparison
This section compares the results of the suggested method to earlier research. We carried out pre-processing after obtaining the data, which included data augmentation to increase the size of the image collection. A more accurate model is trained as a result of this process, and overfitting is less likely to occur. The dataset contained images ranging in size from 512
The classification results using the ensemble learning method reached 93.39%. For the computation complexity of the proposed approach, we kept it to a minimum by employing a conventional machine-learning model. While training traditional machine learning models only takes a few minutes, using a DL network at this stage could take several hours or even days. Using conventional machine learning techniques, we found that the ensemble learning model with CCA fusion was the most effective with an overall accuracy of 93.39%. Even so, out of all the classifiers we utilized in this study, NB provided the worst results. NB shows 75.27% accuracy using the CCA fusion. The performance comparison of all models is given in Table 17 without data augmentation. Table 18 shows statistical results for all models with data augmentation indicating better results when the models are trained using the augmented data.
Class-wise statistics for all models using the original data.

SVM: support vector machine; DR: diabetic retinopathy; MH: media haze; ODC: optic disc cupping
Class-wise statistics for all models for augmented data.

DL: deep learning; CNN: convolutional neural network; SVM: support vector machine; DR: diabetic retinopathy; MH: media haze; ODC: optic disc cupping; RF: random forest.
Performance concerning existing studies
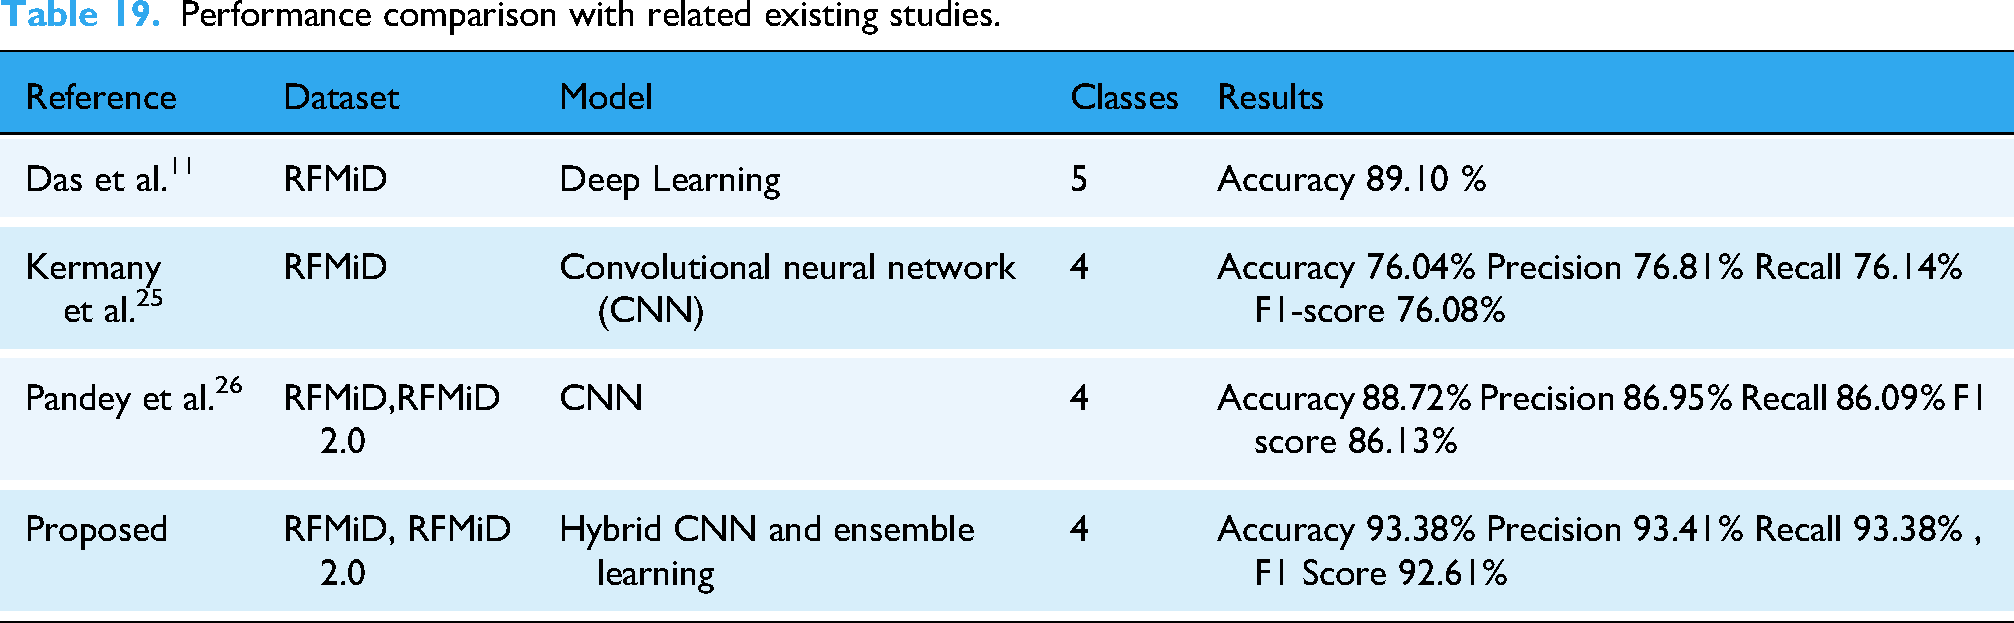
The performance of the best-performing ensemble models is discussed concerning existing studies that utilized the same data. Table 19 shows the comparison of results obtained from the current study with exciting literature. The study 11 adopted a DL approach for fundus image classification using the RFMiD dataset and reported an accuracy of 89.10%. On the other hand, 21 presented a CNN model and obtained a validation accuracy of 82.13%. The current study utilizes CNN models for feature extraction which are later fused to formulate a superior feature vector, thereby leading to an accuracy of 93.39% for RFMiD and RFMiD 2.0 datasets.
Performance comparison with related existing studies.
Discussion
This study provides an approach for better classification of fundus images using an ensemble model that combines SVM, DT, and LR classifiers. For model training, features obtained from two customized CNN models are used to make a single feature vector for better training of ML models. Experiments involve the original, as well as, augmented data. Extensive experimentation is carried out with a variety of ML models indicating the superior performance of the proposed ensemble model. In summary, this study provides the following contributions.
In this study, we focused on feature extraction and fusion by employing two CNN models and combining their features using CCA fusion. The proposed methodology did not initially incorporate contrast enhancement or noise-handling techniques, as the goal was to assess the CNNs’ raw feature extraction capabilities and the effectiveness of CCA fusion in retaining critical information for classification. The designed model enhances the model’s ability to capture complementary information from fundus images. We implement an ensemble learning method that significantly improves classification accuracy compared to traditional methods, achieving an overall accuracy of 93.38%. The proposed model demonstrates superior performance in detecting severe DR cases, with a precision of 94.37%, recall of 92.34%, and an F1 score of 93.79%. The proposed approach addresses class imbalance through advanced data augmentation techniques, ensuring robust classification across different severity levels. This method is inspired by successful applications in other domains, such as lung cancer detection, where CNNs are used to extract spatial features from medical images and ML classifiers improve classification performance.
37
Additionally, research in medical imaging has demonstrated the effectiveness of using DL for feature extraction and combining it with traditional ML for classification, yielding more interpretable and computationally efficient models.
37
These contributions provide a scalable and accurate solution for automated DR localization and grading, facilitating early intervention and improving clinical outcomes.
Conclusion and future direction
The categorization of ocular illness is helpful in determining the eye’s present state of health, analyzing the results of treatment, and choosing the best course of action. Creating a completely automated system is essential to enabling early identification and screening of people with eye diseases. A system of that kind ought to be non-invasive, reproducible, clinically dependable, and have a controllable decision-making process. Medical imaging and DL techniques present a viable way to provide comprehensive descriptions of diseases that have been identified. While we recognize the importance of computational complexity analysis, our focus in this manuscript is primarily on demonstrating the effectiveness of our proposed methodology in terms of classification accuracy, feature extraction, and overall model performance. However, several aspects of the proposed approach naturally contribute to managing computational complexity. First, during the preprocessing stage, we reduce computational overhead by resizing and cropping the images, which standardizes the input data and removes unnecessary information, thereby lowering the overall computational burden. Furthermore, we implement two CNN models, which are well-established for their ability to perform feature extraction efficiently while balancing accuracy and complexity. Additionally, by utilizing CCA fusion, we avoid concatenating raw features, which could significantly increase the dimensionality of the feature space. Instead, CCA fusion optimally combines features from both CNNs, reducing redundancy and contributing to a more compact and manageable feature set, which in turn reduces the computational load during the classification phase. We also leverage traditional machine learning algorithms for classification, many of which are less computationally intensive compared to fully DL-based methods. This hybrid approach strikes a balance between complexity and performance, allowing us to benefit from DL’s feature extraction capabilities without imposing unnecessary computational costs during classification.
To assist in the diagnosis of various eye disorders, deep neural networks can develop hierarchical representations of images. However, due to the comparable look of fundus images of diverse diseases, diagnosing several eye ailments with a single neural network is difficult. Two CNNs are used to extract the features. These derived features are concatenated using the CCA fusion method. The fused feature vector from the CNN models is used to train machine-learning models for better performance. By employing the ensemble learning classifier for fundus images, a 93.39% accuracy is obtained which is better than existing approaches. In the future, different fusion methods like serial fusion and principal component analysis can be applied to concatenate the features. We recognize the potential value of exploring contrast enhancement techniques, such as contrast-limited adaptive Histogram Equalization (CLAHE) or histogram equalization, to further improve the model’s performance on low-contrast images. These techniques could be investigated as a preprocessing step to test their influence on feature extraction, particularly under suboptimal imaging conditions.
Footnotes
Funding
The authors disclosed receipt of the following financial support for the research, authorship, and/or publication of this article: This research is funded by the European University of Atlantic.
Conflicting interests
The authors declared no potential conflicts of interest with respect to the research, authorship, and/or publication of this article.
Data availability
The datasets utilized in this study, RFMiD and RFMiD 2.0, are publicly available and do not contain any personally identifiable information. Therefore, as per institutional and data-sharing guidelines, this study does not require ethics approval or waiver from an Institutional Ethics Committee (IEC) or Institutional Review Board (IRB).