
Abstract
Background
Pre-eruptive intra-coronal resorption (PEIR) is a condition in which unerupted teeth exhibit coronal radiolucency consistent with resorptive loss of coronal tooth structure. These lesions are discovered incidentally on routine radiographs.
Aim
To measure the radiographic interpretation and diagnostic accuracy of PEIR among dental practitioners at King Abdulaziz University Dental Hospital using eye-tracking technology.
Methods
In this cross-sectional study, 125 interns, general dentists, and postgraduate residents examined five panoramic radiographs, including a case of impaction, and the rest were radiographs with PEIR of different severities. In this study, PEIR recognition was assessed using a validated questionnaire uploaded to an eye-tracking device (Sensomotoric Instruments SMI).
Results
The findings revealed an association between the severity of the PEIR lesion and the detection of the affected teeth. As the severity increased, the participants were more able to identify the affected teeth, and the percentage of overlooking decreased. The dentist's level of education and years of clinical experience influenced the diagnostic accuracy and radiographic interpretation of the PEIR lesions.
Conclusions
The diagnostic accuracy and radiographic interpretation of PEIR lesions were affected by participants’ level of education and years of clinical experience. Based on this study, PEIR lesions may remain undetected until they reach advanced stages.
Keywords
Introduction
Pre-eruptive intra-coronal resorption (PEIR) is a condition in which unerupted teeth exhibit coronal radiolucency consistent with the resorptive loss of coronal tooth structure.1,2 These lesions are discovered incidentally on routine radiographs and are considered an important cause of hidden caries (occult caries). 2 Although the exact etiology of PEIR remains controversial, strong evidence suggests that these defects are caused by resorption.2–5 Histological investigations provide evidence for the resorptive characteristics of PEIR lesions, typically indicating signs of resorption, including scalloping of the borders and the presence of osteoclasts and macrophages from the surrounding nearby bone.2,3,5 Its diagnosis is influenced by dentists’ awareness and experience, imaging methods, and radiographic quality.
Previous studies have linked dentists’ experiences with efficiency in examining and interpreting dental radiographs. 6 Experienced dentists require less examination time and interpret the radiographic finding more accurately. 6 By examining more radiographs, dentists can gain a broader knowledge base that allows them to more rapidly detect abnormalities. 6 Bahaziq et al. 7 utilized eye-tracking technology to assess the distinctions between novice and proficient orthodontists during the examination of orthopantomograms (OPGs) with varying difficulties. Observers were generally better at detecting incidental findings than analyzing them. Both detection and interpretation diminished as difficulty increased. Experts require a longer time to examine OPGs as they may focus on management while examining radiographs. 7
Clinicians can encounter cases of PEIR in dental practice, and it is essential to manage them effectively to enhance prognosis. For this reason, early diagnosis of PEIR is critical, as it might aid in preventing pulp involvement or the need for tooth extraction.4,8,9 Eye-tracking technology provides novel insights into how to improve examination and interpretive processes during education, training, and clinical practice.10–12 This objective method enhances the comprehension of how participants identify lesions and interpret radiographs. 7 Most of the published studies on PEIR were case reports, prevalence studies, or literature reviews,13–15 with few published studies on practitioners’ awareness of PEIR. 16 Therefore, this study aimed to measure the diagnostic accuracy and radiographic interpretation of PEIR using eye-tracking technology and to evaluate the influence of dental education level and years of clinical experience on eye-tracking key performance indicators (KPIs). This study also assessed the effect of PEIR severity on the diagnostic ability and radiographic interpretation of dental practitioners.
Materials and methods
The study protocol was approved by the Research Ethics Committee at King Abdulaziz University Dental Hospital (KAUDH), Jeddah, Saudi Arabia, ethical approval number 247-05-21. This study adhered to the guidelines outlined in the Strengthening the Reporting of Observational Studies in Epidemiology (STROBE). This cross-sectional study was conducted at KAUDH for a period of 6 months, starting from June to December 2021. All dental interns, general dentists, and postgraduate students enrolled in the master's and PhD programs at KAUDH were potential candidates for sampling in the study. An invitation email, including a comprehensive explanation of the objectives and structure of the study, was sent by the principal investigator to all candidates. Those who responded and indicated their willingness to participate in the research were invited to attend a one-on-one meeting for a gaze test. If their pre-test calibration showed a gaze deviation of less than 1°, they were considered eligible for the study, and a consent form was signed. Thus, the study included dental interns, general dentists, and postgraduate candidates enrolled in master's and PhD programs at KAUDH, subjects who agreed to participate in the study through email invitation, and those who had a gaze deviation less than 1°. We excluded undergraduate students, dentists, and interns who were not working at KAUDH, subjects who did not reply to the invitation email or did not agree to participate in the study, and those who had a gaze deviation of more than ≥1°.
Invitation emails with a full explanation of the objectives of the study, possible outcomes, and benefits were mailed to all eligible candidates by the primary investigator. A one-to-one meeting was then arranged for those who replied and agreed to participate in the study. If their pre-test calibration revealed a gaze deviation of less than 1°, they were included, and written consent was obtained.
The study subjects were divided into four groups: Group 1, dental interns; Group 2, general dentists; Group 3, postgraduate candidates in pediatric master’s and PhD programs; and Group 4, postgraduate candidates in other dentistry master's programs.
Sample size was calculated based on a study performed by Turgeon and Lam 10 using nQuery software (Sample Size and Power Calculation “Statsols” (Statistical Solutions Ltd), Cork, Ireland”). The sample size was determined to be 23 subjects in each group to detect a difference in means of −1 with 90% sample power, assuming that the common standard deviation was 1 with a 5% two-sided significance level.
Eye-tracking device
Eye-tracking technology improves the understanding of how clinicians detect pathologies and interpret dental radiographs as it records how a person is looking at a stimulus and analyzes the gaze pattern.7,10 It records pupil dilatation, which indicates a cognitive load. It provides an objective and reliable method for understanding the factors contributing to the observer's final decision and the mechanisms underlying misdiagnosis or misinterpretation.6,7,10,17 Eye-tracking technology has been used since the 1960s in various fields. 10 Currently, infrared light sources and cameras are used in modern eye-tracking systems. Eye trackers are available in variable forms, including systems with a chin rest to stabilize head movement, remote systems that accommodate a limited extent of head movement, and recently, a mobile eyewear-based system has been introduced. 6 The device used in this study has an eye tracker (Sensomotoric Instruments SMI) mounted at the base of a 15.6-inch laptop display (Latitude E6530, Dell Corporation, Round Rock, TX, USA) with a magnetic strip. RED-m. SMI software (Sensomotoric Instruments, Teltow, Germany) was used to track the observer's eyes. The screen display resolution was set at 1600 × 900 pixels (Figure 1). The system tracks both eyes and operates with most glasses and lenses. Two software packages were used for data collection: experimental software and analysis software. The Experiment Center. 3.3 (Sensomotoric Instruments, Teltow, Germany) was associated with the eye tracker system, and data were collected for each participant. The data were then automatically imported from the experimental software to BeGaze analysis software (Sensomotoric Instruments, Teltow, Germany).

The eye-tracking device used in this study. The device has an eye tracker (SMI) that was mounted at the base of a 15.6-inch laptop display with a magnetic strip. RED-m. SMI software was used to track the observer's eyes. The screen display resolution was set at 1600 × 900 pixels.
For standardization, the study was conducted in a fixed dimly lit office with no distractions to the observer's field of view. The participants were then reminded of their voluntary participation, confidentiality of their personal information, and the freedom to terminate the experiment and withdraw from the study at any moment. They were informed to examine the radiographs as if they were in their clinics and were told that there would be no time limit. They were then asked to sit comfortably and stabilize their head positions for the entire duration of the experiment. The laptop screen was positioned at a right angle to the floor. The operating distance between the observer's eyes and screen was adjusted to 50–75 cm. The observers were then asked to adjust their head positions so that the eye-tracking camera could consistently pick up the position of the eyes. A pre-test gaze deviation calibration was performed for each participant by employing a five-point calibration to guarantee accurate alignment of the ocular movement pattern in relation to the image. If their pre-test calibration revealed a gaze deviation ≥ 1°, they were excluded.
The participants started by answering six questions related to gender, age, years of clinical experience, specialty, academic level, and country of undergraduate education. The participants were then shown a series of five dental panoramic radiographs with two case scenarios. The first scenario included two OPGs, where the first had impacted tooth #35, surrounded by a dentigerous cyst (Appendix I; Figure 2). In the second OPG, tooth #45 was affected by a moderate PEIR lesion (Appendix I; Figure 3). Each radiograph was followed by two questions: (Q1) Was there any abnormality? (Q2) What is/are the abnormalities? The purpose of this scenario was to compare the ability of the participants to detect obvious dental abnormalities and tooth impaction in comparison to PEIR.

Case 1: Panoramic radiograph of impacted tooth #35.

Case 2: Panoramic radiograph with moderate-sized PEIR in tooth #45. Adopted from Ref. 23
In the second scenario, three PEIR cases were arranged according to the PEIR classification. The first was an OPG with mild PEIR in tooth #45 (Appendix I; Figure 4), followed by a second OPG with moderate PEIR in tooth #36 (Appendix I; Figure 5), and the third was an OPG with severe PEIR in tooth #47 (Appendix I; Figure 6). Each case was followed by an open-ended question to identify the affected tooth. The purpose of this scenario was to evaluate the effect of knowing that the radiographs have PEIR on eye-tracking results and to reduce the number of participants who will overlook the lesions. Also, to assess the effect of PEIR severity on the ability of dental practitioners to identify teeth affected by PEIR and on the KPI results.

Case 3: Panoramic radiograph with a mild-sized PEIR in tooth #45. Adopted from Ref. 23
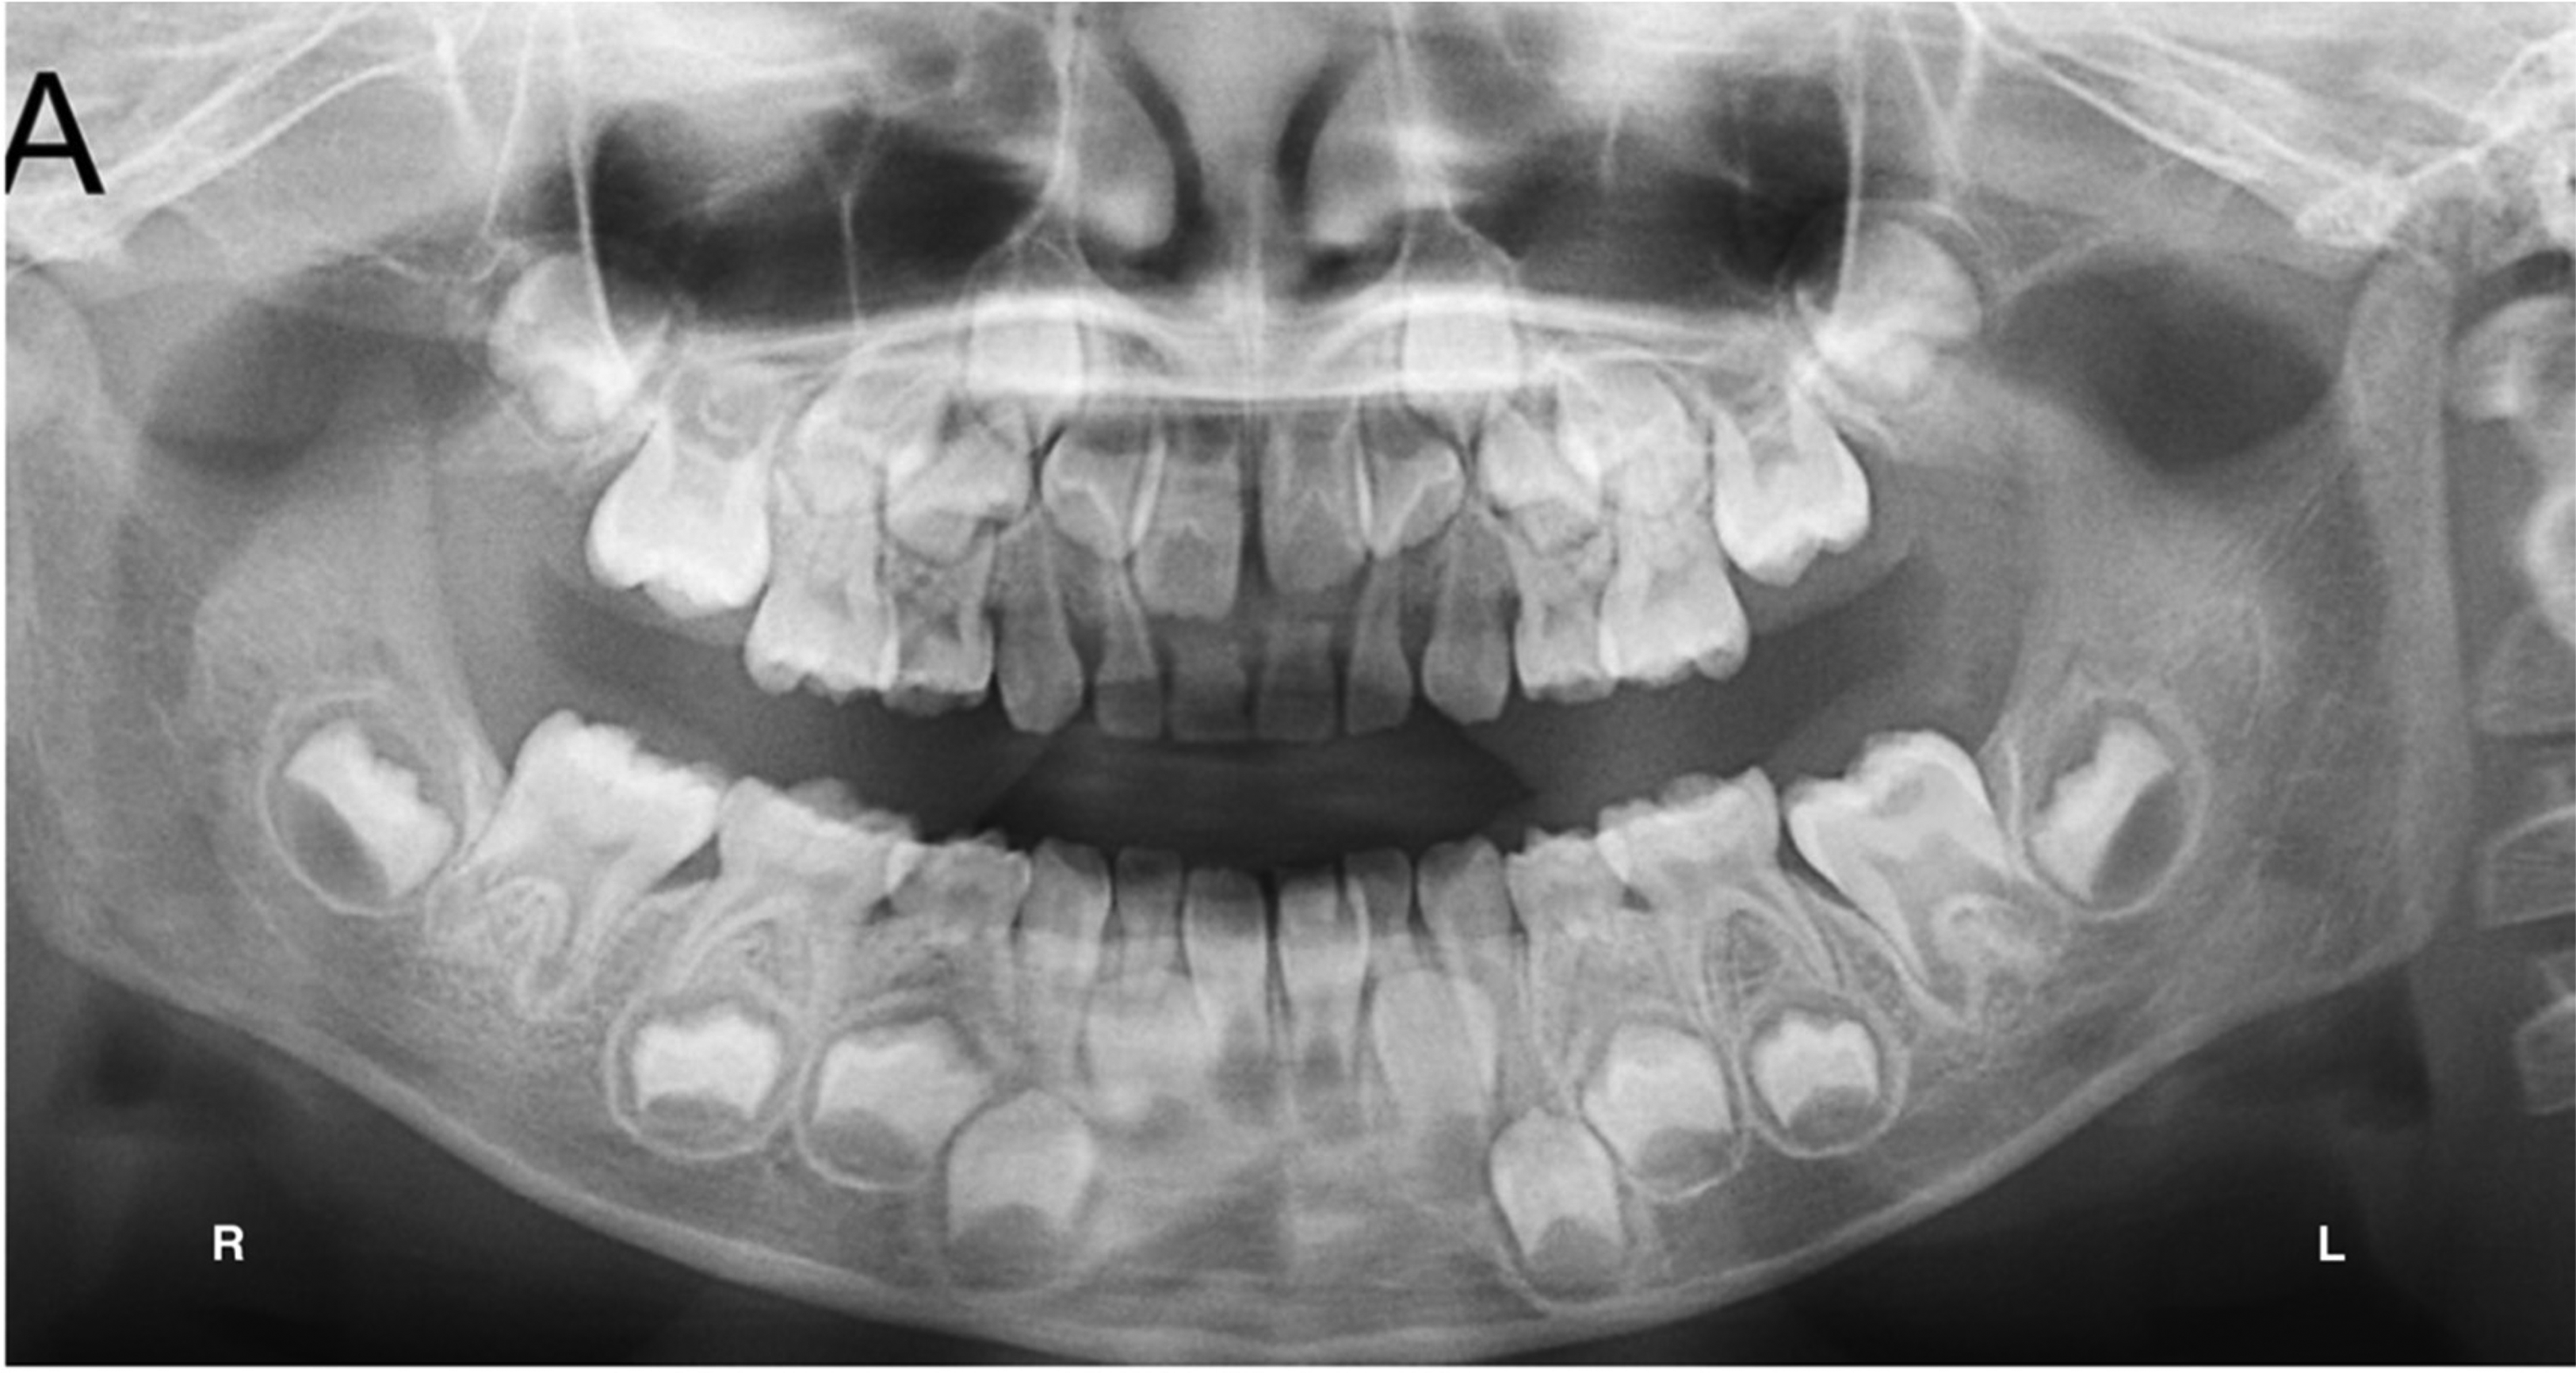
Case 4: Panoramic radiograph with moderate-sized PEIR in tooth #36. Adopted from Ref. 9

Case 5: Panoramic radiograph showing severe PEIR in tooth #47. Adopted from Ref. 24
Eye-tracking data
Multiple KPIs are commonly used in eye-tracking studies to describe visual behavior.10,11 These measures included fixation, saccade, blinking, entry time, dwell time, revisits, end time, and scan path.
18
The principal investigator programmed the eye tracker to track the eye while examining the radiographs. The following data were collected for each radiograph: overlooking, entry time, revisits, dwell time percentage, and end time.
18
The definitions of each KPI are as follows
18
:
Overlooking: The eye-tracking software showed that the participant's eyes did not detect the area of interest (AOI). Entry time: The duration from the start of the radiograph until the AOI was found. Revisits: Number of revisits to the AOI. Dwell time: Total time spent by the participant in the AOI. End time: Cumulative time dedicated to examining the entire radiograph.
The abnormalities (AOI) were then outlined in the software by the principal investigator, and all collected data were exported from the BeGaze software to Microsoft Excel of Mac 2021 (Version 16.53).
Statistical analysis
Analysis was performed using the Statistical Package for the Social Sciences SPSS (IBM, Endicott, NY, USA) version 25. Descriptive statistics were calculated and are presented as frequencies and percentages. The association between the participants’ responses to the questionnaire and the participants’ education (Interns, General dentists, postgraduate pediatric residents, and postgraduate residents from other specialties) and years of clinical experience (1 year, 2–4 years, ≥ 5 years) was further tested using the chi-square test and Fisher's exact test. The association between the eye-tracking results and the participants’ education and years of clinical experience were further tested using the non-parametric Kruskal‒Wallis test. The significance level was set at p < .05.
Results
Participants’ demographic features and clinical experience
A total of 163 dentists and interns were invited to participate in this study. One hundred twenty-nine agreed to participate (response rate 79.14%). One pediatric resident and three interns were excluded because the calibration step failed repeatedly (gaze deviation of ≥1°). Thus, the total number of participants was 125 (Figure 7).
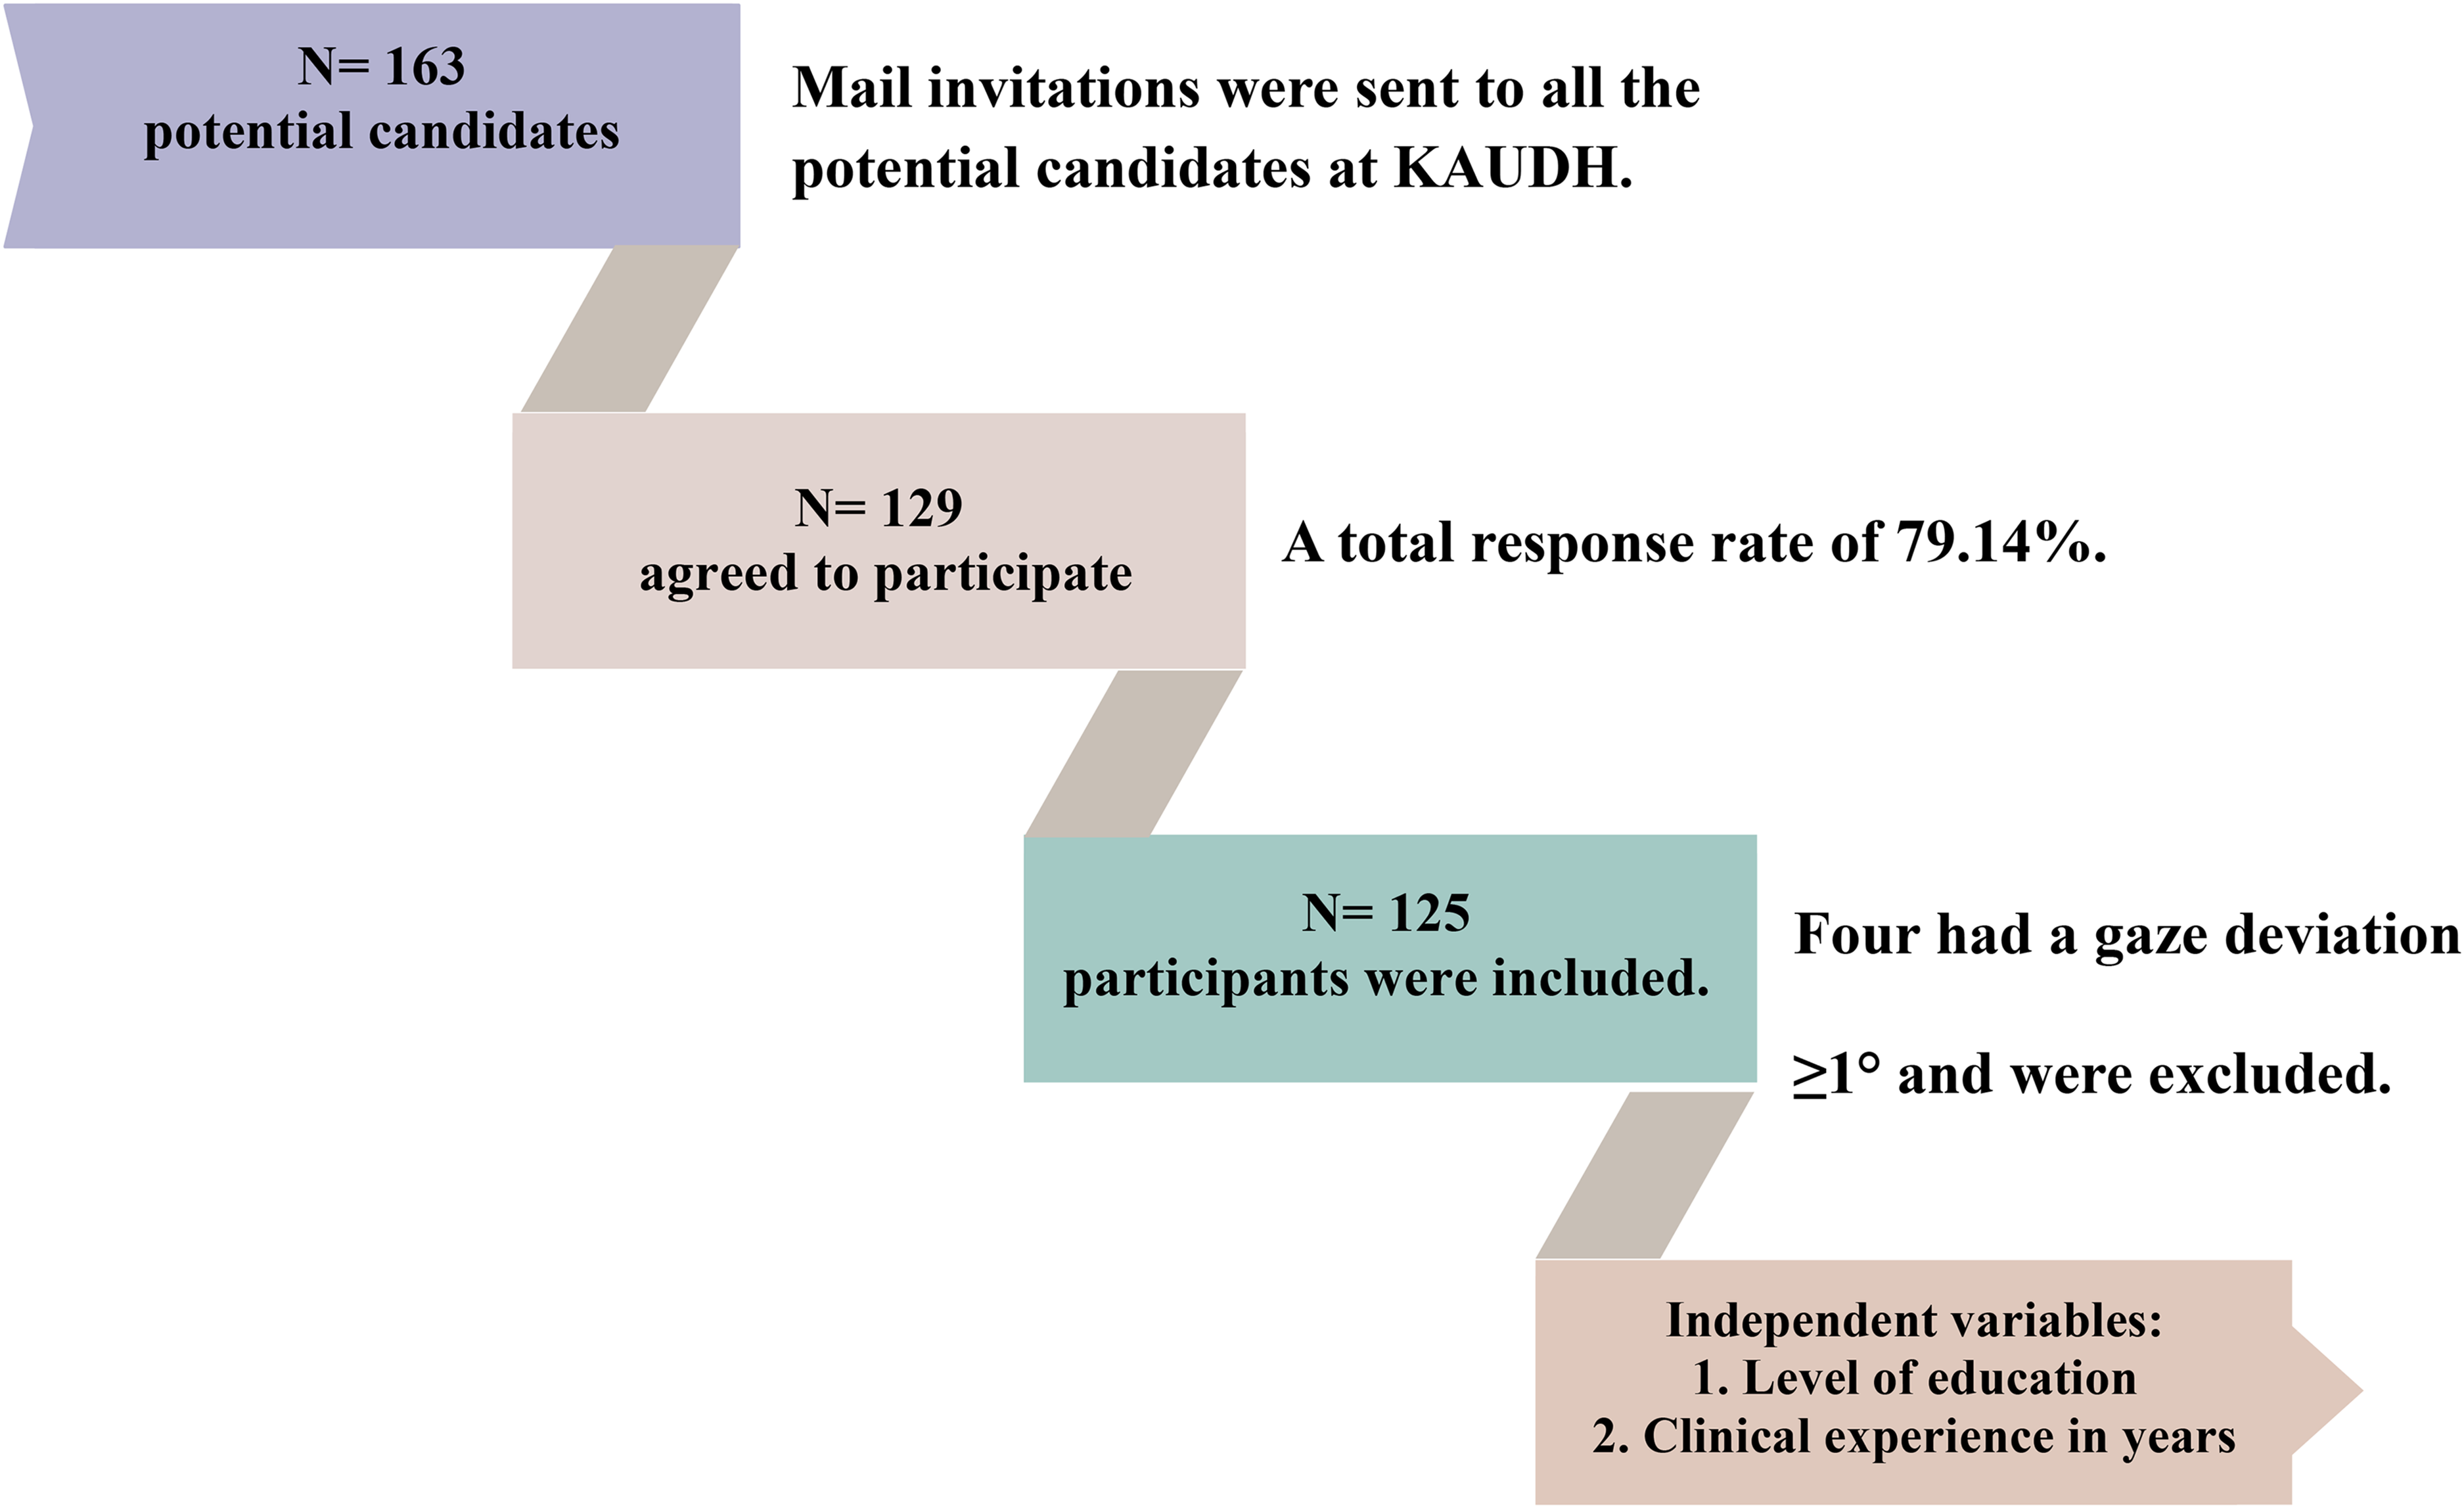
Visual summary of the study's workflow, including participant recruitment and data collection.
Table 1 shows the demographic features and clinical experience of the participants. Sixty percent of the participants were female, and 50.4% ranged in age from 26 to 30 years. The participants were divided into four subgroups according to their level of education. The first group included 47 dental interns (37.6%), 26 general dentists (20.8%), 24 postgraduate pediatric residents (19.2%), and 28 (22.4%) postgraduate residents from other specialties (endodontics, orthodontics, prosthodontics, and restorative dentistry). All participants completed their bachelor's degrees in Saudi Arabia, except one pediatric resident who had a degree from Egypt. Among all participants, 37.6% had 1 year of clinical experience, 32.0% had 2‒4 years of clinical experience (including the internship year), and 30.4% had at least 5 years of clinical experience.
Participants’ demographic features and clinical experience (n = 125).

Case 1: panoramic radiograph with impacted tooth #35
In the first panoramic radiograph, tooth #35 was impacted and surrounded by a dentigerous cyst. The lesion was overlooked by only one general dentist (Table 2). For the detection question, there was no statistically significant difference between the groups with different education levels (p = .830) or clinical experience (p = 1.00). Among those who correctly answered the detection question (n = 123), only one intern responded incorrectly to the diagnosis question. Although there was no significant difference between the groups regarding entry time, number of revisits, and dwell time percentage, postgraduate residents from other specialties and dentists who had 2–4 years of experience spent less time identifying the AOI (entry time) and had a smaller number of revisits. On the other hand, interns who had 1 year of experience had a greater dwell time percentage.
Knowledge and software KPI distributed by level of education and clinical experience of case 1: panoramic radiograph of impacted tooth #35.

Note. Overlooked: The software showed that the participant eye didn’t detect the AOI; Entry time (seconds): Duration of time until the AOI was detected, Revisits: The number of revisits to the AOI; Dwell time%: The percentage of the total time spent by the participants within the AOI out of total time spent in the radiograph, End time(seconds): Total time spent to examine the entire radiograph. ¥: Fisher Exact test, §: Kruskal—Wallis test.
Case 2: panoramic radiograph with moderate size PEIR in tooth #45
The radiograph of the second case showed an OPG with a moderate-sized PEIR in tooth #45. As shown in Table 3, almost half of the participants overlooked the PEIR lesion in tooth #45 (49.6%). Although half of the participants’ eyes passed the AOI (50.4%), only 8.8% could detect the abnormality in tooth #45. There was a significant difference in the percentage of correct answers based on the years of clinical experience (p = .001). Participants with ≥ 5 years of clinical experience had the highest percentage of correct answers (23.7%) to the detection question compared to participants with 2–4 years (2.5%) and 1 year (2.1%) of clinical experience. All participants who were able to detect PEIR correctly answered the diagnosis question. Although there was no statistically significant difference between the groups regarding the KPI results, postgraduate residents from other specialties and dentists with 2–4 years of clinical experience took less time to detect the AOI (entry time) and had a higher dwell-time percentage. Dentists with 2–4 years of clinical experience also spent less time examining the radiographs (end time).
Knowledge and software KPI distributed by level of education and clinical experience of case 2 - panoramic radiograph with moderate size PEIR in tooth #45.

Note. Overlooked: The software showed that the participant eye didn’t detect the AOI, Entry time(seconds): Duration of time until the AOI was detected, Revisits: The number of revisits to the AOI; Dwell time%: The percentage of the total time spent by the participants within the AOI out of total time spent in the radiograph, End time(seconds): Total time spent to examine the entire radiograph. ∝: Chi-square test, ¥: Fisher Exact test, §: Kruskal—Wallis Test. *p < .05.
Case 3: panoramic radiograph with a mild size PEIR in tooth #45
In this case, tooth #45 was affected by a mild-sized PEIR. Lesions were overlooked in 20% of the participants (Table 4). Only 63.2% of participants were able to correctly identify the affected tooth. A significant difference in dwell time percentage was found based on the level of education (p = .004). The dwell time percentage of interns (3.70 ± 6.62%) was significantly lower than that of general dentists (8.11 ± 7.35%). In addition, the interns’ dwell time percentage was significantly less than the pediatric resident's dwell time percent (7.23 ± 7.47%). A significantly positive relationship was found between dwell time percentage and years of clinical experience (p = .005). The dwell time percentage was 3.70 ± 6.62% for participants with 1 year of clinical experience, while it was 7.78 ± 8.53% for participants with ≥ 5 years of experience. A significant difference in end time was also found based on education level (p = .010). Interns spent significantly more time (44.48 ± 48.75 s) to examine the radiograph compared to pediatric residents (12.41 ± 7.44 s). A significantly negative relationship was found between the end time and years of clinical experience (p = .004). Participants with ≥ 5 years of clinical experience spent less time examining the radiograph (13.33 ± 6.43 s) compared to those with 1 year of clinical experience (44.48 ± 48.75 s).
Knowledge and software KPI distributed by level of education and clinical experience of case 3: panoramic radiograph with a mild PEIR in tooth #45.

Note. Overlooked: The software showed that the participant eye didn’t detect the AOI, Entry time(seconds): Duration of time until the AOI was detected, Revisits: The number of revisits to the AOI. Dwell time%: The percentage of the total time spent by the participants within the AOI out of total time spent in the radiograph, End time(seconds): Total time spent to examine the entire radiograph. ∝: Chi-square test, ¥: Fisher Exact test, §: Kruskal—Wallis Test. *p < .05. Post hoc test was performed, same letters indicate no statistically significant difference, while different letters indicate significant difference.
Case 4: panoramic radiograph with a moderate size PEIR in tooth #36
This case presented with moderate-sized PEIR in tooth #36. Table 5 shows that 39.2% of the participants overlooked the PEIR. Only 54.4% of participants were able to identify the affected tooth. Although no significant difference was found between the groups regarding entry time, the number of revisits, and dwell time percentage, pediatric residents had slightly shorter entry times and higher dwell time percentages. The dwell time percentage was also slightly higher for participants with ≥ 5 years of clinical experience; however, the difference was not statistically significant.
Knowledge and software KPI distributed by level of education and clinical experience of case 4: panoramic radiograph with moderate-sized PEIR in tooth #36.
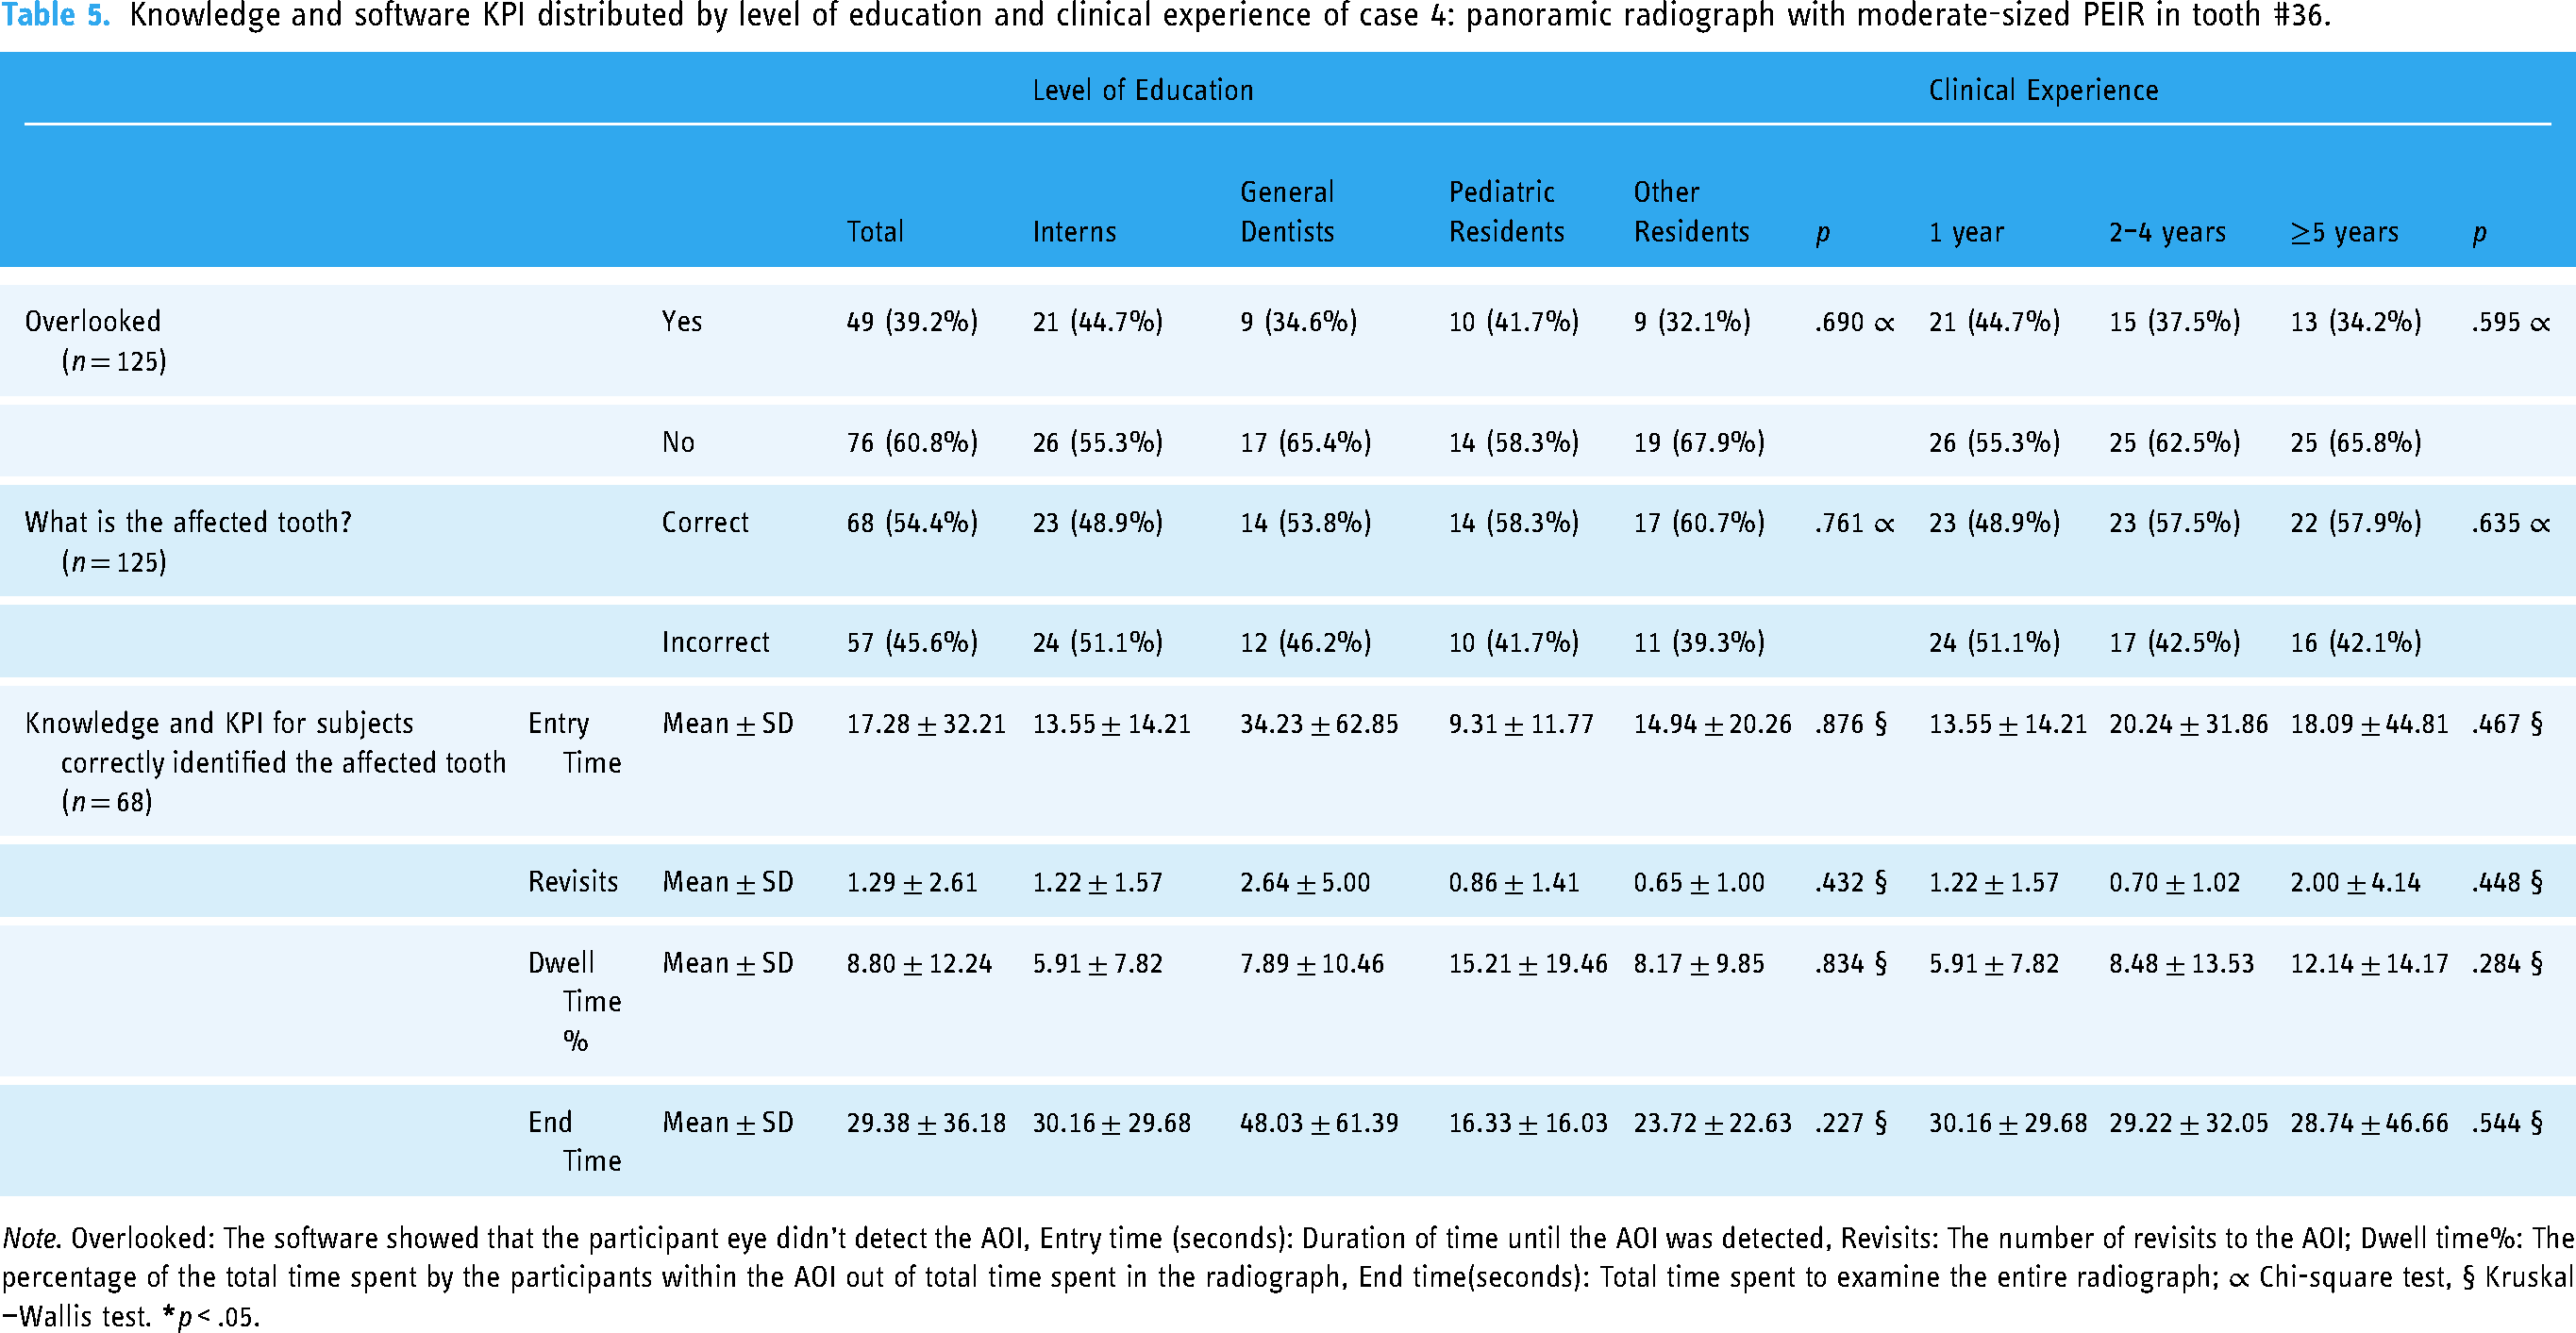
Note. Overlooked: The software showed that the participant eye didn’t detect the AOI, Entry time (seconds): Duration of time until the AOI was detected, Revisits: The number of revisits to the AOI; Dwell time%: The percentage of the total time spent by the participants within the AOI out of total time spent in the radiograph, End time(seconds): Total time spent to examine the entire radiograph; ∝ Chi-square test, § Kruskal—Wallis test.
Case 5: panoramic radiograph with a severe PEIR in tooth #47
In the present case, tooth #47 was severely affected by PEIR. Table 6 shows that although the software showed that 92.0% of the participants’ eyes passed over the AOI, only 84.8% were able to identify the PEIR-affected tooth. The software KPI results did not show any statistically significant differences between participants.
Knowledge and software KPI distributed by level of education and clinical experience of case 5 -panoramic radiograph with severe PEIR in tooth #47.
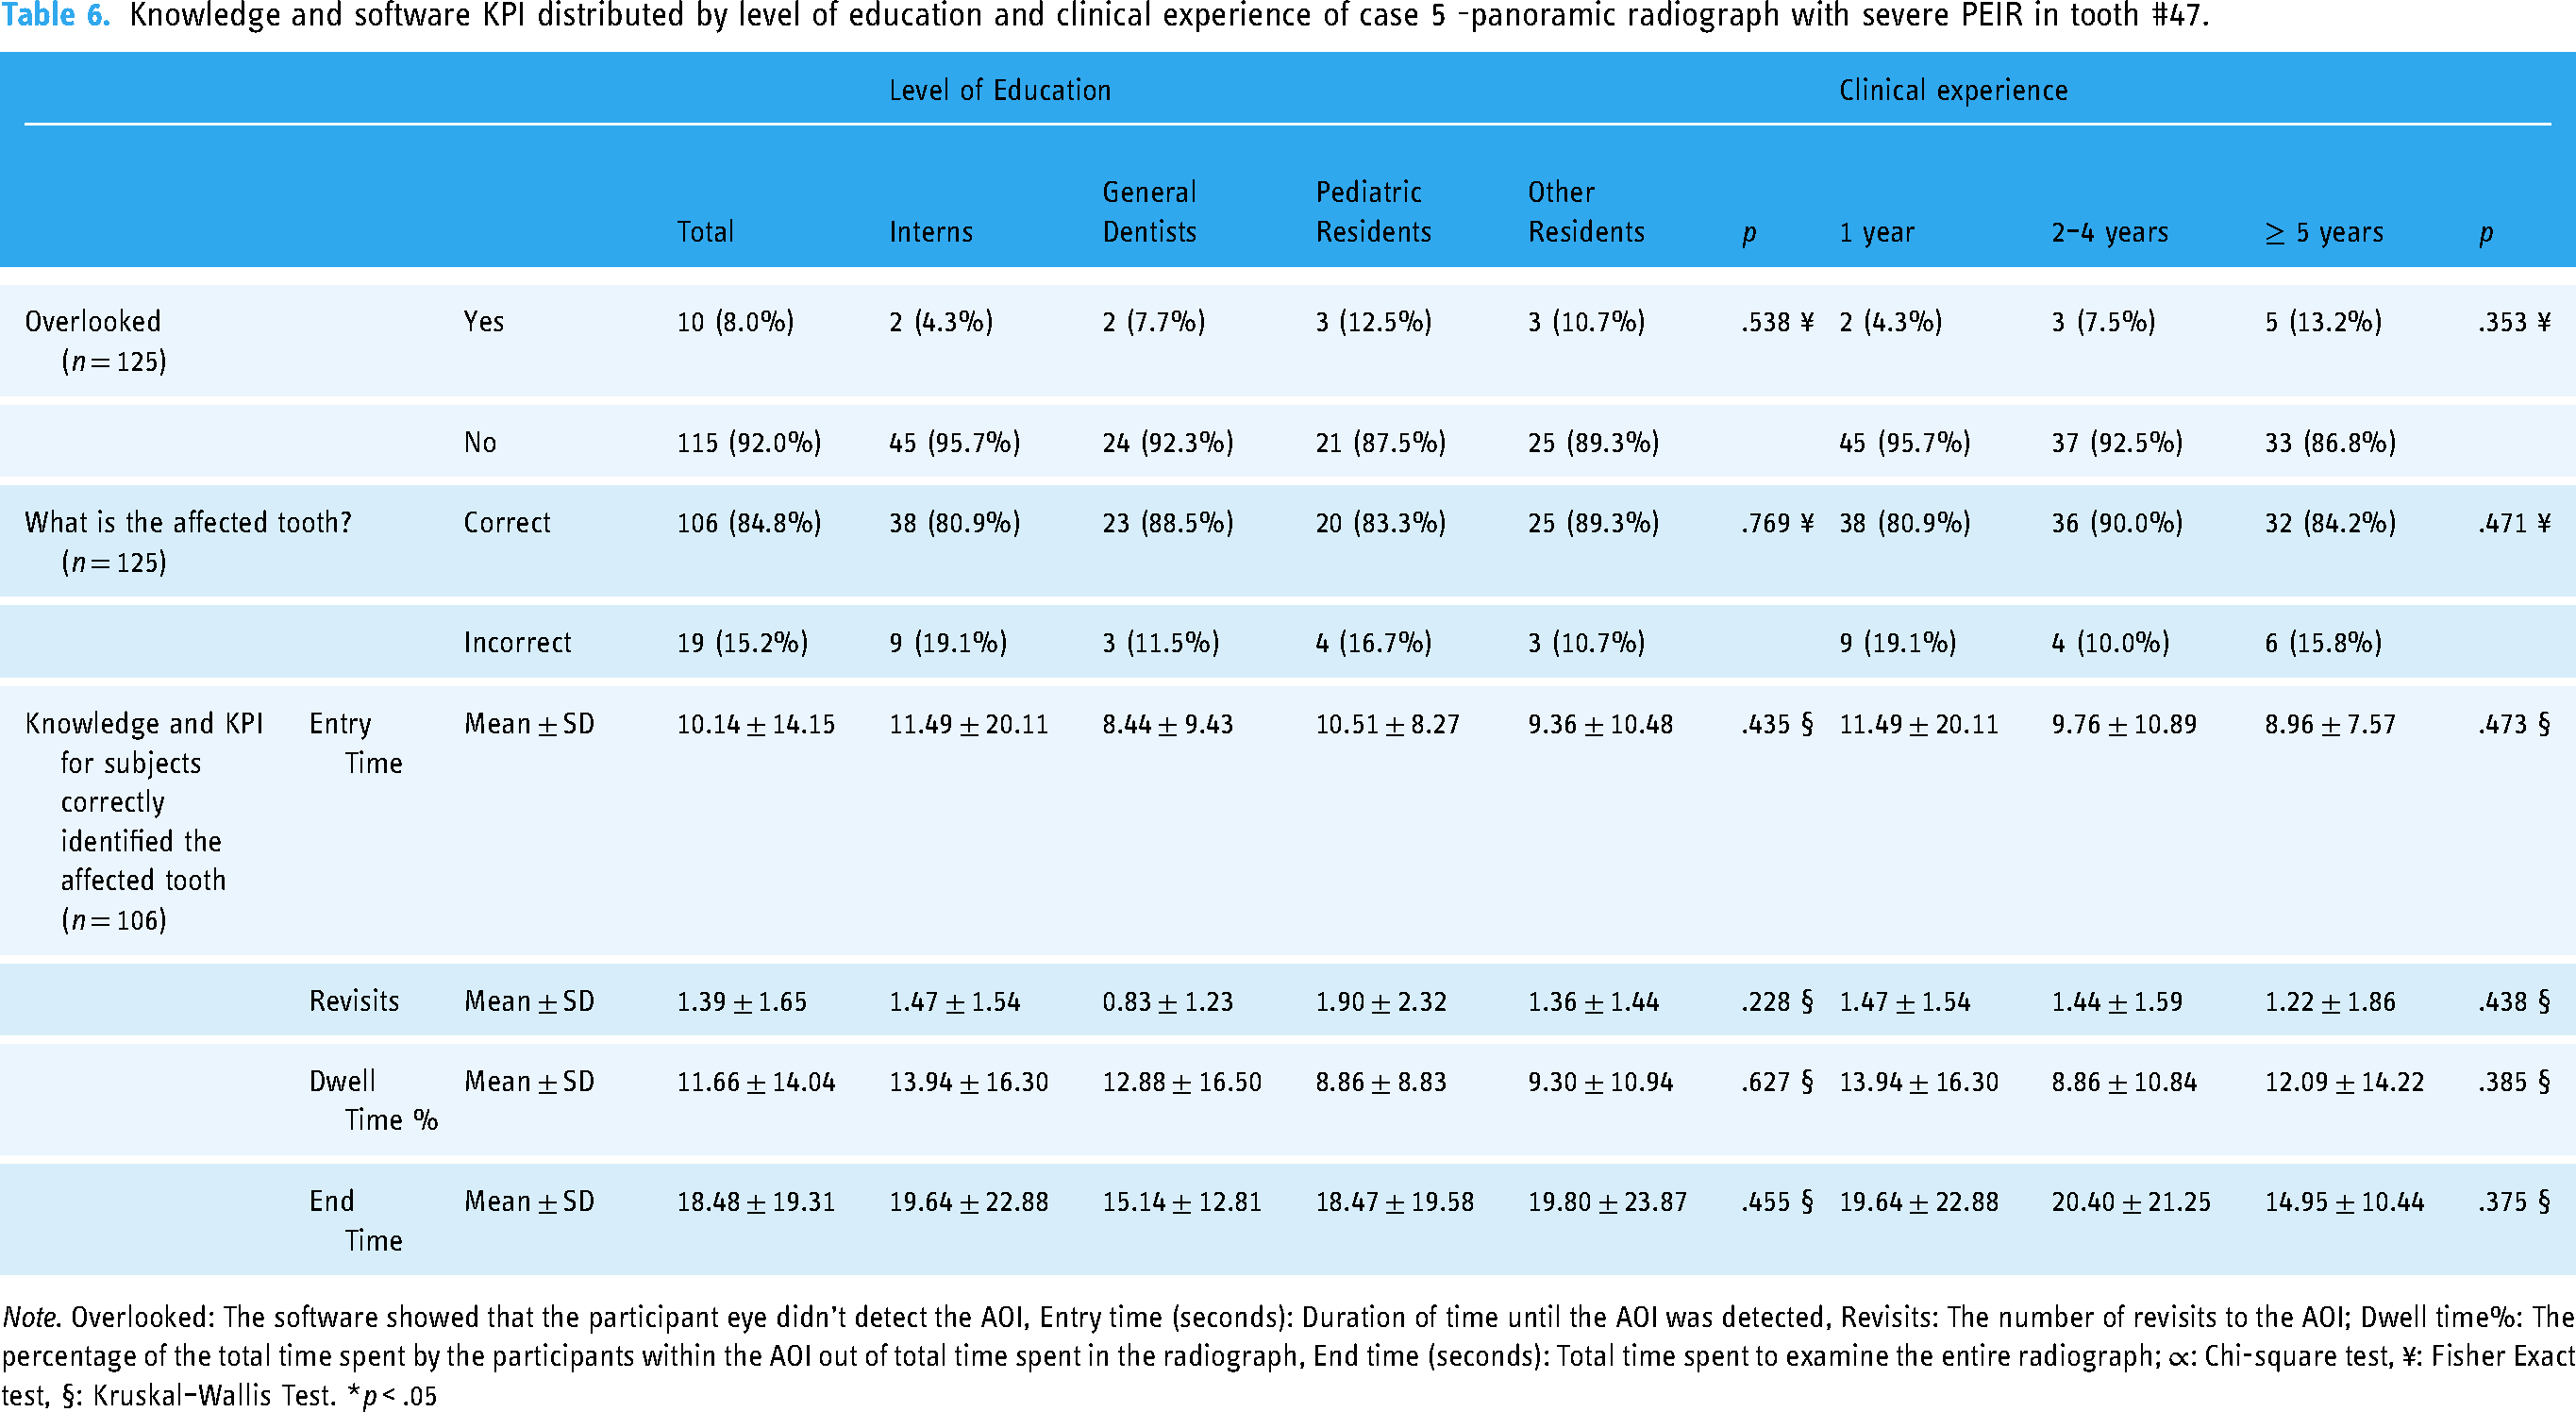
Note. Overlooked: The software showed that the participant eye didn’t detect the AOI, Entry time (seconds): Duration of time until the AOI was detected, Revisits: The number of revisits to the AOI; Dwell time%: The percentage of the total time spent by the participants within the AOI out of total time spent in the radiograph, End time (seconds): Total time spent to examine the entire radiograph; ∝: Chi-square test, ¥: Fisher Exact test, §: Kruskal–Wallis Test. *p < .05
Discussion
This study aimed to measure the diagnostic accuracy and radiographic interpretation of PEIR among dental practitioners in KAUDH using eye-tracking technology. The influence of some factors, including dentist's level of education and years of clinical experience on the examination efficiency, accuracy of radiographic interpretation, and eye-tracking KPI were also assessed. The findings showed that the participants were generally good at the diagnosis and radiographic interpretation of common and obvious anomalies. The findings revealed an association between the severity of the PEIR lesion and the detection of PEIR-affected teeth, whereas the severity increased, the participants were more able to identify the affected teeth, and the percentage of overlooking decreased. The participants’ dental education level and years of clinical experience were among the factors that affected diagnostic accuracy and radiographic interpretation.
Eye-tracking technology provides novel insights into how to improve the examination and interpretive process during education, training, and clinical practice.10–12 This technology improves our understanding of how clinicians detect pathology and interpret dental radiographs. 7
The results for the obvious abnormality (case #1) showed high percentages of correct detection and diagnosis, in which the percentage of correct detection was 98.4%; however, the percentage of correct diagnoses was 99.2%. The lesion was overlooked by only one participant. Overall, these results showed that the participants were good at radiographic diagnosis and interpretation of common and obvious anomalies. Although the PEIR lesion in the second case was moderate in size, almost half of the participants overlooked it and only 8.8% were able to identify the affected tooth. This may be due to its subtle appearance on radiographs, which makes it difficult to recognize and identify its presence. This could also be explained by the phenomenon of inattentional blindness, that is, the inability to recognize an unexpected but clearly visible stimulus when attention is engaged in another task. 19 Similarly, Drew et al. found high rates of inattentional blindness in gorilla photoshopped into computed tomography (CT) of the lung. In their study, the performance of 24 expert radiologists was compared to that of 25 naive observers while examining a CT for lung nodule detection. Twenty experts failed to notice the gorilla. However, none of the naive observers reported seeing a gorilla. The eye-tracking results showed that 12 experts and nine naive observers looked directly at the gorilla's location. These results showed that experts could have inattentional blindness at high rates while performing a task for which they had received extensive training. 20
The purpose of the second scenario was to evaluate the effect of knowing that the radiographs have PEIR on the eye-tracking results and to reduce the percentage of lesion overlooking. This was evident in case #3, which encountered the same PEIR lesion as in case #2, but at an early stage. Knowing that Case #3 contains PEIR, the percentage of overlooking decreased from 49.6% in Case #2 to 20% in Case #3. In addition, the participants were more able to locate the affected tooth in case #3 than in case #2, with detection percentages of 63.2% and 8.8%, respectively. The results of the second scenario showed that the percentage of overlooking decreased as the severity of PEIR increased, except for case #4 (OPG with moderate size PEIR) where the percentage of overlooking was 39.2%, and only 54.4% of participants were able to identify the affected tooth. Our justification is that case #4 contained a greater number of unerupted teeth than case #3. In accordance with Bahaziq et al., differences were found between novice and expert orthodontists when examining OPGs of varying difficulties. Both detection and interpretation diminished as the difficulty level increased. 7 In case 2, there was a significantly positive relationship between years of clinical experience and the percentage of correct tooth identification. Similarly, Turgeon and Lam found that the performance of oromaxillofacial residents (OMRs) was better than that of students, which was due to the significant differences in their knowledge and training. 10 In contrast to our findings, Bahaziq et al. found no significant differences between the groups in the recognition of incidental findings of varying degrees of difficulty. This could be due to the fact that the extent of knowledge and interpretation abilities were comparable among the groups. 7
In case #3, a significant difference in dwell time percentage was found based on the level of education (p = .004). The percentage of Interns’ dwell time was significantly less than that of general dentists and pediatric residents. A significant difference in the end time was also found based on the level of education (p = .010), where interns spent significantly more time examining the radiograph than pediatric residents. In addition, a statistically significant difference was found based on years of clinical experience in relation to the dwell time percentage (p = .005) as well as the end time (p = .004). Participants with ≥ 5 years of experience had a greater dwell time percentage and spent less time examining the radiograph compared to participants with 1 year of clinical experience. Similar to our findings, Matsumoto et al. found that the experience level has a significant influence on the examination process. They discovered that experienced neurologists spent less time examining critical areas known to often host diseases, whereas they spent less time examining less significant structures. 21 This also agrees with Turgeon and Lam, who found that OMRs spent less time searching for radiographs than fourth-year dental students. 10 In contrast, Bahaziq et al. found that novice orthodontists required significantly less examination time than experts. Their explanation for this was that novice orthodontics had recent radiology training, while expert orthodontists required longer time as they may have started a mental process of diagnosis and treatment planning for the cases during their radiographic examination. 7
It is important to recognize the limitations of this study. Even though we chose dentists with varying levels of education, clinical experience, and educational backgrounds, the generalizability of the results could be difficult. Additionally, the effectiveness of eye-tracking technology can be constrained by calibration and accuracy issues, which can affect the reliability of gaze data. Errors may also be introduced by participant movement variability. 22 Individual differences in participant engagement and eye physiology may further impact gaze behavior, potentially confounding interpretations. 22 A significant factor that could influence the results was the extent to which each participant could perceive areas peripheral to a fixation point registered by the eye tracker. Although participants can visualize regions just outside an AOI, they may still search within the AOI using peripheral vision. 7 Moreover, as noted by Matsumoto et al., some participants did not directly look at the edge of the cranium but were still able to identify it, particularly in areas with the greatest contrast difference on radiograph. 21 In the current study, missing data did not affect the analysis of lesion overlooking, lesion detection, and end time. They were not included in the analysis of entry time, revisits, and dwell time %. Volunteer- or self-reflection bias might have affected the results of this study. To overcome these limitations, future studies should use random sampling techniques, increase the sample size, and include samples from different institutes. Enhancing the technical features of eye-tracking systems is also essential. Lastly, incorporating qualitative methods alongside eye-tracking could provide deeper insights into the cognitive processes underlying gaze patterns, offering a more holistic understanding of diagnostic accuracy in radiographic interpretation. One of the strengths of this study was the response rate, where 79.14% of the dentists who were invited to participate agreed to participate. This study also highlights the importance of introducing knowledge regarding emerging conditions such as PEIR into the curriculum.
Conclusion
Based on the findings of the current study, the following conclusions are drawn:
The participants had difficulty recognizing and identifying PEIR lesions because of their subtle appearance, and PEIR lesions may be left undetected in advanced stages. As the severity of PEIR increased, the percentage of overlooking decreased, and the participants were more able to identify the affected tooth. The level of education and years of clinical experience are among the factors that affect diagnostic accuracy and radiographic interpretation. Overall, the participants were good at radiographic diagnosis and interpretation of the common and obvious anomalies. The participants tended to count the teeth; however, the internal structure of the unerupted teeth did not grasp their attention.
Supplemental Material
sj-docx-1-dhj-10.1177_20552076251315620 - Supplemental material for Diagnostic accuracy and radiographic interpretation of pre-eruptive intra-coronal resorption among dental practitioners using eye-tracking technology
Supplemental material, sj-docx-1-dhj-10.1177_20552076251315620 for Diagnostic accuracy and radiographic interpretation of pre-eruptive intra-coronal resorption among dental practitioners using eye-tracking technology by Jamila Almashaikhi, Heba M. Elkhodary, Ghalia Y. Bhadila, Osama M. Felemban and Amani A. Al Tuwirqi in DIGITAL HEALTH
Footnotes
Acknowledgments
The authors acknowledge Dr Fatma Jadu for her support and assistance.
Contributorship
Jamila Almashaikhi contributed to conceptualization, methodology, data collection, and writing‒review and editing. Heba M. Elkhodary contributed to conceptualization, methodology, writing‒review and editing, and supervision. Ghalia Y. Bhadila contributed to visualization, and writing‒review and editing. Osama M. Felemban: conceptualization, methodology, software, data curation, formal analysis, writing‒review and editing, and supervision. Amani A. Al Tuwirqi contributed to conceptualization, methodology, writing‒review and editing, supervision, and project administration. All coauthors have revised the manuscript and have approved this submission.
Declaration of conflicting interest
The authors declared no potential conflicts of interest with respect to the research, authorship, and/or publication of this article.
Ethical approval
The study protocol was approved by the Research Ethics Committee at King Abdulaziz University Dental Hospital (KAUDH), ethical approval number 247-05-21.
Funding
The authors disclosed receipt of the following financial support for the research, authorship, and/or publication of this article: This work was supported by the Deanship of Scientific Research (DSR) at King Abdulaziz University, Jeddah (grant numberGPIP: 1051-165-2024).
Informed Consent
All the participants consented to participate.
Data availability
The dataset supporting the conclusions of this article is available from the corresponding author upon reasonable request.
Supplemental Material
Supplemental material for this article is available online.
Appendix I
References
Supplementary Material
Please find the following supplemental material available below.
For Open Access articles published under a Creative Commons License, all supplemental material carries the same license as the article it is associated with.
For non-Open Access articles published, all supplemental material carries a non-exclusive license, and permission requests for re-use of supplemental material or any part of supplemental material shall be sent directly to the copyright owner as specified in the copyright notice associated with the article.