
Abstract
This study analyzes user acceptance intention toward digital therapeutics (DTx) and examines factors influencing acceptance intention.
Keywords
1. Introduction
This study aims to identify psychological factors influencing user acceptance of DTx by integrating UTAUT2 and MIR.1–4
Digital therapeutics are defined as evidence-based therapeutic interventions driven by high-quality software programs to prevent, manage, or treat a medical disorder or disease (Digital Therapeutics Alliance, 2021). 5
Digital therapeutics (DTx) deliver evidence-based therapeutic interventions that are driven by high quality software programs to prevent, manage, or treat a medical disorder or disease. They are used independently or in concert with medications, devices, or other therapies to optimize patient care and health outcomes. DTx products incorporate advanced technology best practices relating to design, clinical evaluation, usability, and data security. They are reviewed and cleared or certified by regulatory bodies as required to support product claims regarding risk, efficacy, and intended use. Digital therapeutics empower patients, clinicians, and payers with intelligent and accessible tools for addressing a wide range of conditions through high quality, safe, and effective data-driven interventions. 5
Digital therapeutics can enable appropriate treatment for patients with limited access to healthcare, thereby reducing social costs and contributing to disease prevention and management. Furthermore, they offer significant advantages in reducing patient risk and enhancing patient convenience and choice. 5
Despite digital therapeutics having demonstrated safety and effectiveness verified by regulatory authorities, there is a general lack of awareness, and questions regarding their therapeutic efficacy persist. To enhance treatment effectiveness while using digital therapeutics, it is essential to actively engage with them and maximize their therapeutic impact through direct execution. 5
Despite regulatory approval, public awareness and trust in DTx remain limited. Although DTx have demonstrated safety and effectiveness through regulatory validation, skepticism persists regarding their therapeutic value. The cost of DTx, particularly whether they are covered by national health insurance, significantly influences user intention to adopt them.
This study addresses the gap in understanding user acceptance of DTx. We apply the extended Unified Theory of Acceptance and Use of Technology (UTAUT2) and the Model of Innovation Resistance (MIR) to identify acceptance and resistance factors. UTAUT2 differs from the original UTAUT by including hedonic motivation and price value, which are particularly relevant in healthcare contexts.
MIR complements this by explaining user resistance through perceived risks such as privacy and financial concerns. To improve clarity, the theoretical background of UTAUT2 and MIR has been moved to the Methods section 2.1. The objective of this study is to develop and validate a model that evaluates user acceptance intention of digital therapeutics by integrating acceptance and resistance factors.
Due to their nature, digital therapeutics are categorized as either covered or non-covered under health insurance, and their price significantly influences the intention to use them. Research into the market entry potential of digital therapeutics and changes in user perception is essential as digital therapeutics products enter the acceptance intention phase, necessitating studies related to user acceptance intention. Considering the scalability of non-face-to-face healthcare, it is also necessary to research user acceptance intention factors for digital therapeutics. 5
In this study, to analyze the acceptance intention of digital therapeutic users, key variables from the Unified Theory of Acceptance and Use of Technology (UTAUT) 1 effort expectancy, performance expectancy, hedonic motivation, and price value—as positive factors influencing users’ acceptance intention of digital therapeutics were established. The original UTAUT model (Venkatesh et al., 2003) includes performance expectancy, effort expectancy, social influence, and facilitating conditions. UTAUT2 (Venkatesh et al., 2012) extends this by adding hedonic motivation, price value, and habit. The Model of Innovation Resistance (MIR) (Ram, 1987) explains user resistance to new technologies based on perceived risks and behavioral inertia.2–4
The Model of Innovation Resistance (MIR) was also employed. Innovation resistance factors were divided into privacy risk and economic risk. The target is to comprehensively analyze users’ acceptance intention towards digital therapeutics by examining whether these factors act as innovation resistance factors and negatively influence acceptance intention. 5
Analyzing the acceptance intention of digital therapeutic users will contribute to the expansion of the digital medical device industry by researching digital therapeutics acceptance intention and resistance factors, thereby presenting factors that can expand the industry from the perspective of user acceptance intention. 5
Despite the growing interest in digital therapeutics (DTx), prior studies have rarely integrated both acceptance and resistance perspectives in a unified model. This study addresses this gap by combining UTAUT2 and MIR to explore the psychological factors influencing user acceptance. Specifically, it seeks to answer the following questions: (1) Which factors positively or negatively influence users’ intention to adopt DTx? (2) How do perceived risks interact with motivational and economic considerations in shaping user attitudes?
The objective of this study is to provide a model to evaluate the market entry potential of digital therapeutics considering user acceptance and to present their academic and practical significance. 5
2. Materials and methods
2.1. Theoretical basis and description of the research model (see Figure 1)
This study employed a cross-sectional survey design. A total of 528 participants were recruited via online platforms in South Korea.
This cross-sectional study was conducted from July to August 2024 in South Korea. The research model integrates UTAUT2 and MIR. UTAUT2 constructs include performance expectancy, effort expectancy, hedonic motivation, and price value. MIR constructs include privacy risk and financial risk. Constructs such as Social Influence, Facilitating Conditions, and Habit were excluded due to limited relevance in the context of individual DTx adoption. In Figure 1, performance expectancy is labeled as perceived usefulness and effort expectancy as perceived ease of use to align with user-centered terminology.
1
Conceptual research model integrating UTAUT2 constructs and the innovation resistance model (MIR).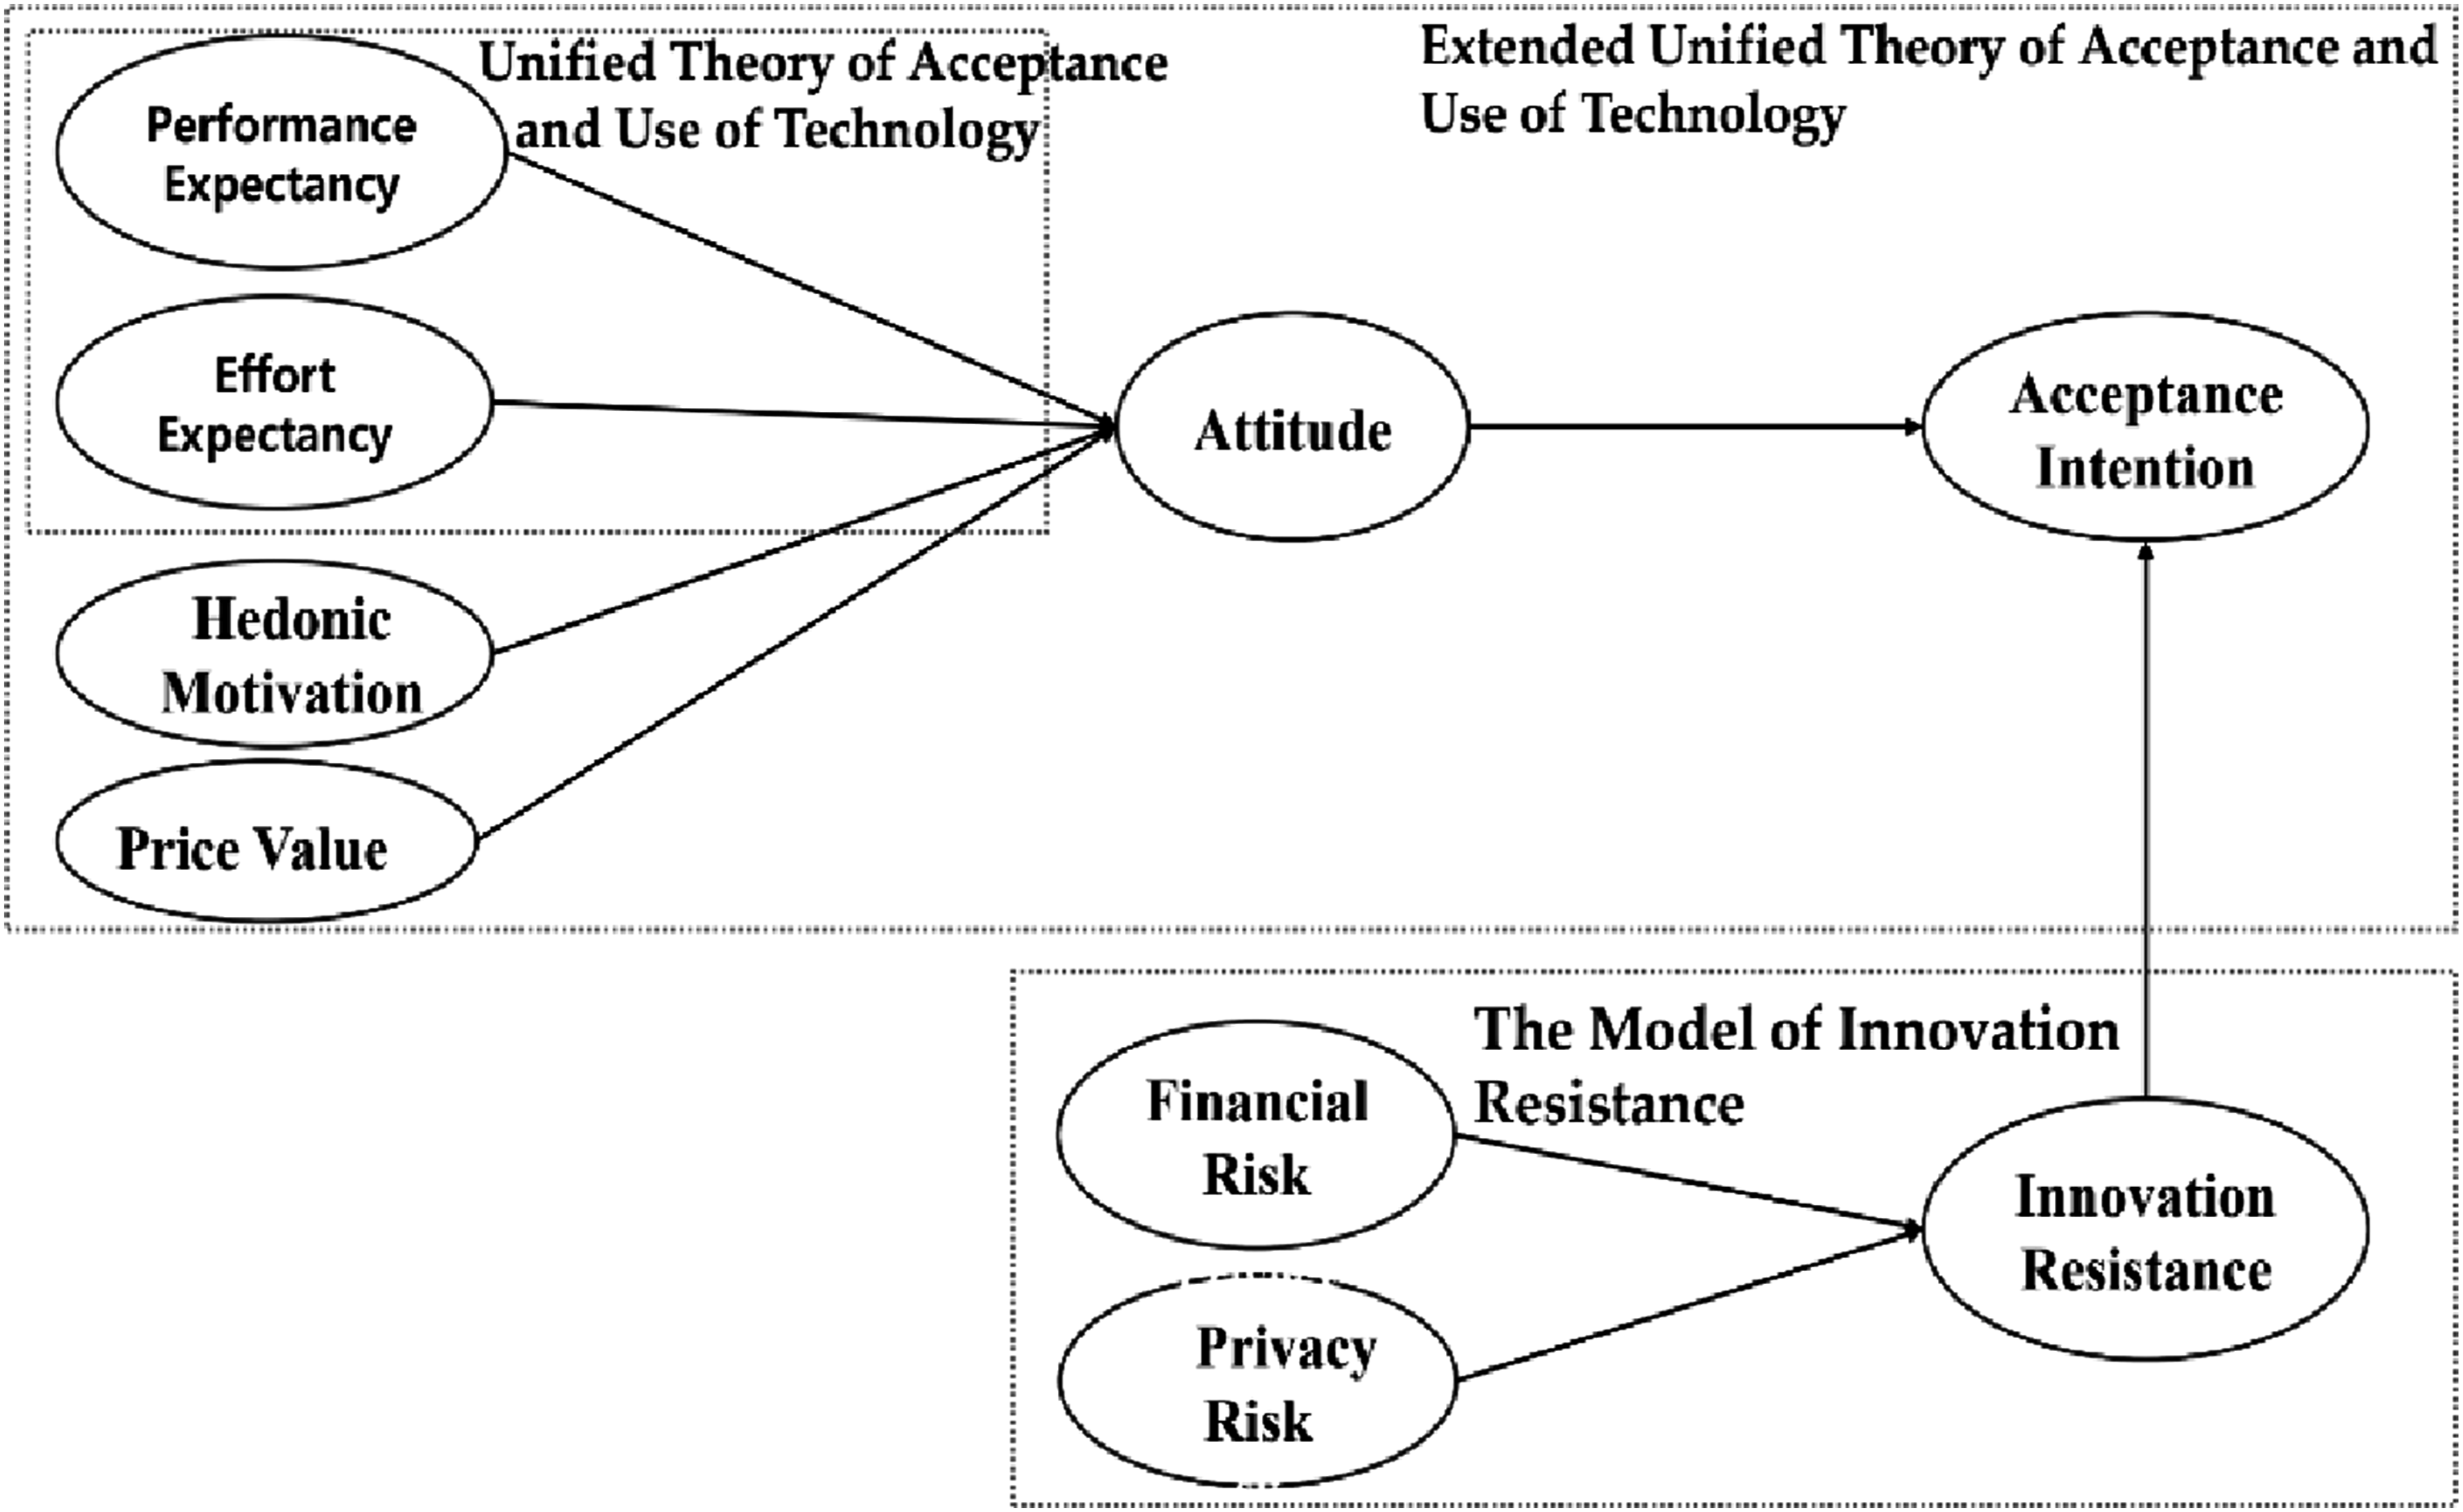
UTAUT-2 includes price value and hedonic motivation as appropriate variables for examining the acceptance intention of digital therapeutics. Furthermore, the innovation resistance variables of privacy risk and economic risk are considered as antecedent factors of users’ perceived risk levels, and intends to examine whether innovation resistance negatively impacts the acceptance intention of digital therapeutics. To enhance the therapeutic effect of digital therapeutics by increasing adherence during use, it is essential to maximize the therapeutic effect by directly implementing them, checking progress at each stage to boost achievement, and improving compliance. Since hedonic motivation and price value are anticipated to be appropriate variables for understanding the acceptance intention of digital therapeutics, this study will be conducted based on this model. In this study, while characteristic factors of UTAUT-2 variables, such as effort expectancy and performance expectancy, may significantly influence the acceptance intention of digital therapeutics, users consider both functional characteristic factors and external variables when deciding to accept digital therapeutics. It is predicted that price value will show a significant impact on acceptance intention in digital therapeutics.
The concept of innovation resistance has evolved in the marketing field, based on behavioral psychology, to address user resistance. Sheth (1981) defined innovation resistance from the perspective of users’ intention to resist, and subsequent studies conceptualized it as an attitude of maintaining the current state rather than accepting innovation.2–4
Rogers (1983) stated that an innovation is an idea, practice, or object perceived as new by an individual or group adopting it, and the degree of innovation acceptance intention depends on how individuals perceive its characteristics. 6
In this theory, the acceptance process is defined as a microscopic process in which a non-user decides whether to accept or reject an innovation, whereas the diffusion process is defined as a macroscopic process among members. This study therefore investigates how innovation resistance toward digital therapeutics affects acceptance intention.2–4,6
This study designed the overall research model based on UTAUT2 and the Innovation Resistance Model to analyze the intention to use digital therapeutics. The purpose of this research is to empirically elucidate the relationships between acceptance-related and resistance-related factors associated with digital therapeutics. Ram suggested that acceptance and resistance coexist throughout the innovation process and that acceptance occurs when innovation resistance is overcome.4,6
The purpose of this study is to identify factors influencing the acceptance intention of digital therapeutics by applying the UTAUT2 and MIR. The rationale for establishing this particular model is rooted in the understanding that comprehending the acceptance intention behavior of potential users is crucial for the development and growth of the digital therapeutics industry. This approach aims to derive factors influencing digital therapeutics user acceptance intention and specifically utilizes the UTAUT2 and MIR, which are well-suited for research directly relevant to digital therapeutic acceptance. The reasons for setting up the model as described below in this study are threefold: First, it is essential to understand the acceptance intention behavior of potential users for the advancement and growth of the digital therapeutics industry. Second, the study aims to identify the factors influencing digital therapeutic user acceptance. Third, it employs the appropriate extended unified technology acceptance model and innovation resistance model, which have a direct relevance to the acceptance intention of digital therapeutics. Through this, the study seeks to verify hypotheses and analyze the factors affecting digital therapeutic acceptance.2–4
2.2. Survey methodology
The structured questionnaire included validated items adapted from previous studies. The survey was conducted online, and participants were recruited through convenience sampling. The sample consisted of 528 respondents residing in South Korea. This study employed a cross-sectional survey design conducted between July and August 2024 in South Korea
A structured online survey was conducted using convenience sampling through university and healthcare networks. A total of 528 valid responses were collected. Data were collected exclusively in South Korea, which may limit generalizability to countries with different digital health infrastructures. The sample size of 528 was determined based on prior studies and statistical power considerations. To gather empirical data, a survey was conducted using a structured questionnaire designed to measure the variables identified in the research model, specifically those derived from UTAUT2 and MIR.1,7
The questionnaire included items to assess performance expectancy, which refers to users’ beliefs about the benefits of using digital therapeutics, and effort expectancy, which gauges the perceived ease of use. It also covered hedonic motivation, concerning the enjoyment or pleasure derived from using digital therapeutics, and price value, reflecting users’ assessment of their value relative to cost. Furthermore, the survey measured economic risk, encompassing concerns related to the financial burden of digital therapeutics, and privacy risk, addressing anxieties regarding the security and protection of personal data during use. Finally, the questionnaire sought to ascertain acceptance intention, representing the likelihood of users adopting and utilizing digital therapeutics. 5
This study employed a cross-sectional survey design conducted between July and August 2024 in South Korea. Participants were recruited via convenience sampling through online platforms. A total of 528 valid responses were collected. The survey instrument was developed based on validated scales from UTAUT2 and MIR, each administered using Google Forms. Participants provided response options for each question, using a 5-point Likert scale to analyze their experiences and feelings. This facilitated quantitative analysis, thereby enhancing the reliability of the study and obtaining variable results. As a result, data from 528 participants were ultimately collected. 1
2.3. Measurement items
The questionnaire consisted of 45 items across 9 constructs, adapted from validated UTAUT2 and MIR instruments. 1
Example items include: “Using digital therapeutics is enjoyable” (Hedonic Motivation), “I am concerned about the misuse of personal data” (Privacy Risk). The full questionnaire is available as supplementary material.The operational definition of Hedonic Motivation was revised to reflect enjoyment and pleasure rather than usefulness.Definitions for Attitude and Innovation Resistance were clarified to reflect user preference and reluctance, respectively.2–4
Operational definitions and measurement constructs used in this study.

The measurement items used in this study were adapted from previously validated constructs in the literature, particularly those based on the UTAUT2.8,9
2.4. Measurement tool evaluation and convergent validity testing
In this study, the reliability and validity of the selected measurement tools were examined prior to verifying the structural relationships between variables. For factor loadings, which indicate the construct validity of measurement items, a threshold of 0.5 or higher was set. The critical ratio (CR) was set to be significant at ±1.96 or higher (Woo Jong-pil, 2012). 10 Analysis of reliability and validity was performed through confirmatory factor analysis (CFA) based on structural equation modeling.8,10,11
CR values exceeded 0.7 for all constructs. AVE values were above 0.5 for most constructs, except hedonic motivation (0.444) and financial risk (0.474), indicating marginal convergent validity.
Hedonic Motivation item 2 had a low factor loading of 0.202, suggesting measurement refinement is needed.
For reliability, composite reliability (CR), an indicator of internal consistency, which represents the correlation between the latent variable and its items, was confirmed. Performance expectancy ranged from 0.602 to 0.839, effort expectancy from 0.813 to 0.824, hedonic motivation from 0.202 to 0.856, price value from 0.670 to 0.787, attitude from 0.425 to 0.854, acceptance intention from 0.685 to 0.766, innovation resistance from 0.734 to 0.890, financial risk from 0.594 to 0.795, and privacy from 0.820 to 0.908. Cronbach’s α values were 0.909, 0.864, 0.741, 0.838, 0.827, 0.849, 0.912, 0.820, and 0.853, respectively, indicating high reliability across all variables. Composite reliability (CR) also confirmed reliability with values of 0.853, 0.910, 0.770, 0.845, 0.831, 0.846, 0.912, 0.817, and 0.856, respectively. This signifies that each item of the independent variables possesses validity. In conclusion, while the measurement tools used in this study showed low validity for “interestingness of hedonic motivation,” “excessive personal information collection,” and “financial loss due to purchase,” other parts demonstrated a high level of validity. It was confirmed that the paths between variables could be reliably measured. In this study, confirmatory factor analysis was conducted to verify the convergent validity of the measurement tools.
Hedonic motivation and financial risk showed AVE values below the 0.5 threshold, indicating limited convergent validity for these constructs.
Confirmatory factor analysis results for measurement variables.

***: P ≤ 0.001
Convergent validity test results for measurement instruments.

For performance expectancy, the composite reliability (CR) was 0.853 and the average variance extracted (AVE) was 0.541, satisfying convergent validity. For effort expectancy, the composite reliability (CR) was 0.910 and the average variance extracted (AVE) was 0.668. For hedonic motivation, the composite reliability (CR) was 0.770, but the average variance extracted (AVE) was 0.444, which was found to be below the appropriate criterion of 0.5 for AVE. For price value, the composite reliability (CR) was 0.845 and the average variance extracted (AVE) was 0.523. For attitude, the composite reliability (CR) was 0.831 and the average variance extracted (AVE) was 0.511. For acceptance intention, the composite reliability (CR) was 0.846 and the average variance extracted (AVE) was 0.525. For innovation resistance, the composite reliability (CR) was 0.912 and the average variance extracted (AVE) was 0.676. For financial risk, the composite reliability (CR) was 0.817, but the average variance extracted (AVE) was 0.474, which was found to be below the appropriate criterion of 0.5 for AVE. Lastly, for privacy, the composite reliability (CR) was 0.856 and the average variance extracted (AVE) was 0.748. To verify discriminant validity, a correlation analysis was performed. According to the verification method by Fornell et al. (1981) (8), discriminant validity is achieved if the average variance extracted (AVE) of each variable is greater than the squared correlation between that variable and other variables. 11
Specifically, the average variance extracted (AVE) values were 0.541 for performance expectancy, 0.668 for effort expectancy, 0.444 for hedonic motivation, 0.523 for price value, 0.511 for attitude, 0.525 for acceptance intention, 0.676 for innovation resistance, 0.474 for financial risk, and 0.748 for privacy. All these values were higher than their respective squared correlations. Therefore, it was confirmed that the measurement tools used in this study possess a high level of discriminant validity, indicating that they are suitable instruments for analyzing causal relationships between variables.2–4
To ensure measurement validity, we followed a two-step validation procedure. First, content validity was established by adapting items from previously validated UTAUT2 and MIR instruments and reviewing them with two experts in digital health and health informatics. Second, construct validity was assessed through confirmatory factor analysis (CFA). Internal consistency was evaluated using Cronbach’s α and composite reliability (CR), with thresholds of 0.70 or higher. Convergent validity was examined using average variance extracted (AVE), with recommended values above 0.50. Discriminant validity was confirmed when the square root of each construct’s AVE exceeded inter-construct correlations. These procedures indicate that the measurement model demonstrates acceptable reliability and validity.1,7
Although hedonic motivation and financial risk showed AVE values slightly below the recommended threshold, their composite reliability values exceeded 0.70, suggesting acceptable internal consistency. Therefore, these constructs were retained for theoretical completeness.
2.5. Statistical analysis
Data were analyzed using SPSS 25.0 and AMOS 22.0. Reliability and validity were assessed through Cronbach’s α and composite reliability (CR). Confirmatory factor analysis (CFA) was used to test convergent and discriminant validity. Structural equation modeling (SEM) was employed to evaluate the hypothesized relationships among variables. Significance was determined at p < .05.8,10,11
3. Results
3.1. Demographic statistics of survey participants
A total of 528 valid responses were analyzed (n = 528). Among the 528 respondents, 55.1% were male and 44.9% female. The majority were in their 20s (40.5%) and held university-level education (71.4%). Occupations included office workers (40.9%) and students (32.6%). This sample skew toward younger, educated participants may limit generalizability to the broader patient population.
Among the total respondents, 291 (55.1%) were male and 237 (44.9%) were female. Regarding age, 39 (7.3%) were in their teens, 214 (40.5%) in their 20s, 162 (30.6%) in their 30s, 103 (19.6%) in their 40s, and 11 (2.0%) were 50 or older, with respondents in their 20s being the most numerous. For occupation, students comprised 172 (32.6%), office workers 215 (40.9%), skilled workers 15 (2.9%), professionals 40 (7.6%), service workers 25 (4.7%), housewives 23 (4.3%), others 32 (6.0%), and unemployed individuals 5 (1.0%), with office workers being the most common.Regarding education level, 60 (11.3%) were enrolled in or graduated from high school or below, 377 (71.4%) were enrolled in or graduated from university, 56 (10.6%) were enrolled in or graduated with a master’s degree, and 35 (6.6%) were enrolled in or graduated with a doctorate, with university students/graduates being the most numerous.
3.2. Measurement model evaluation
Hedonic motivation and financial risk showed AVE values below the 0.5 threshold, indicating limited convergent validity for these constructs.
The assumption of normality for the measurement variables was tested, and the results showed that the skewness for each variable ranged from 0.11 to 0.49, while the kurtosis ranged from -0.81 to 0.08. Since the absolute values of skewness for all measurement variables did not exceed 2, and the absolute values of kurtosis did not exceed 4, it’s concluded that all measurement variables follow a normal distribution (West, Finch, & Curran, 1995). 8 The skewness and kurtosis values of each measurement variable satisfying the criteria for normal distribution indicate that the variables follow a normal distribution. This provides a basis for assuming a normal distribution when analyzing the relationships between variables, thereby enhancing the reliability of the study. The results of the correlation analysis for the measurement variables are as follows:
When examining the correlations among variables, performance expectancy showed the strongest positive correlation with effort expectancy (r=.811,p<.01). It also exhibited significant positive correlations with hedonic motivation (r=.522,p<.01), price value (r=.371,p<.01), attitude (r=.241,p<.01), and acceptance intention (r=.319,p<.01). Effort expectancy showed significant positive correlations with hedonic motivation (r=.602,p<.01), price value (r=.386,p<.01), attitude (r=.269,p<.01), and acceptance intention (r=.290,p<.01). Hedonic motivation showed significant positive correlations with price value (r=.692,p<.01), attitude (r=.576,p<.01), and acceptance intention (r=.530,p<.01). Price value showed significant positive correlations with attitude (r=.711,p<.01), acceptance intention (r=.644,p<.01), innovation resistance (r=.697,p<.01), financial risk (r=.807,p<.01), and privacy (r=.673,p<.01). Attitude showed significant positive correlations with acceptance intention (r=.753,p<.01), innovation resistance (r=.794,p<.01), financial risk (r=.686,p<.01), and privacy (r=.747,p<.01). Acceptance intention showed significant positive correlations with innovation resistance (r=.683,p<.01), financial risk (r=.700,p<.01), and privacy (r=.663,p<.01). Innovation resistance showed a strong positive correlation with financial risk (r=.758,p<.01) and a very high positive correlation with privacy (r=.871,p<.01). Financial risk also showed a strong positive correlation with privacy (r=.733,p<.01) and significant correlations with most other variables. Finally, privacy showed significant positive correlations with all variables, particularly a very high positive correlation with innovation resistance (r=.871,p<.01).2–4
3.3. Correlation analysis
All constructs showed significant correlations. A correlation matrix is presented in Table 2.
Structural equation modeling results and hypothesis testing.

The hypotheses regarding performance expectancy and effort expectancy were rejected due to non-significant or negative effects on attitude, contrary to expectations.
3.4. Hypothesis testing
SEM results (Table 3) revealed: • Hedonic Motivation → Attitude: β = 0.456, p < .001 (Supported) • Price Value → Attitude: β = 0.529, p < .001 (Supported) • Performance Expectancy → Attitude: β = -0.023, p = .572 (Rejected) • Effort Expectancy → Attitude: β = -0.108, p = .007 (Rejected) • Innovation Resistance → Acceptance Intention: β = -0.445, p < .001 (Supported) Effort Expectancy had a significant but negative effect on attitude, which contradicts prior expectations and warrants further discussion.Performance Expectancy did not significantly influence attitude, suggesting that perceived usefulness may not be a decisive factor in this context.1,7
In this study, we conducted a Confirmatory Factor Analysis (CFA) to assess how accurately the measurement variables reflect their latent constructs. The analysis showed that the fit indices of the measurement model were statistically significant, confirming that the research model was a good fit for the data. Figure 2 illustrates the direct effects and their verification results, including the standardized path coefficients of our research model. Standardized path coefficients of the research model.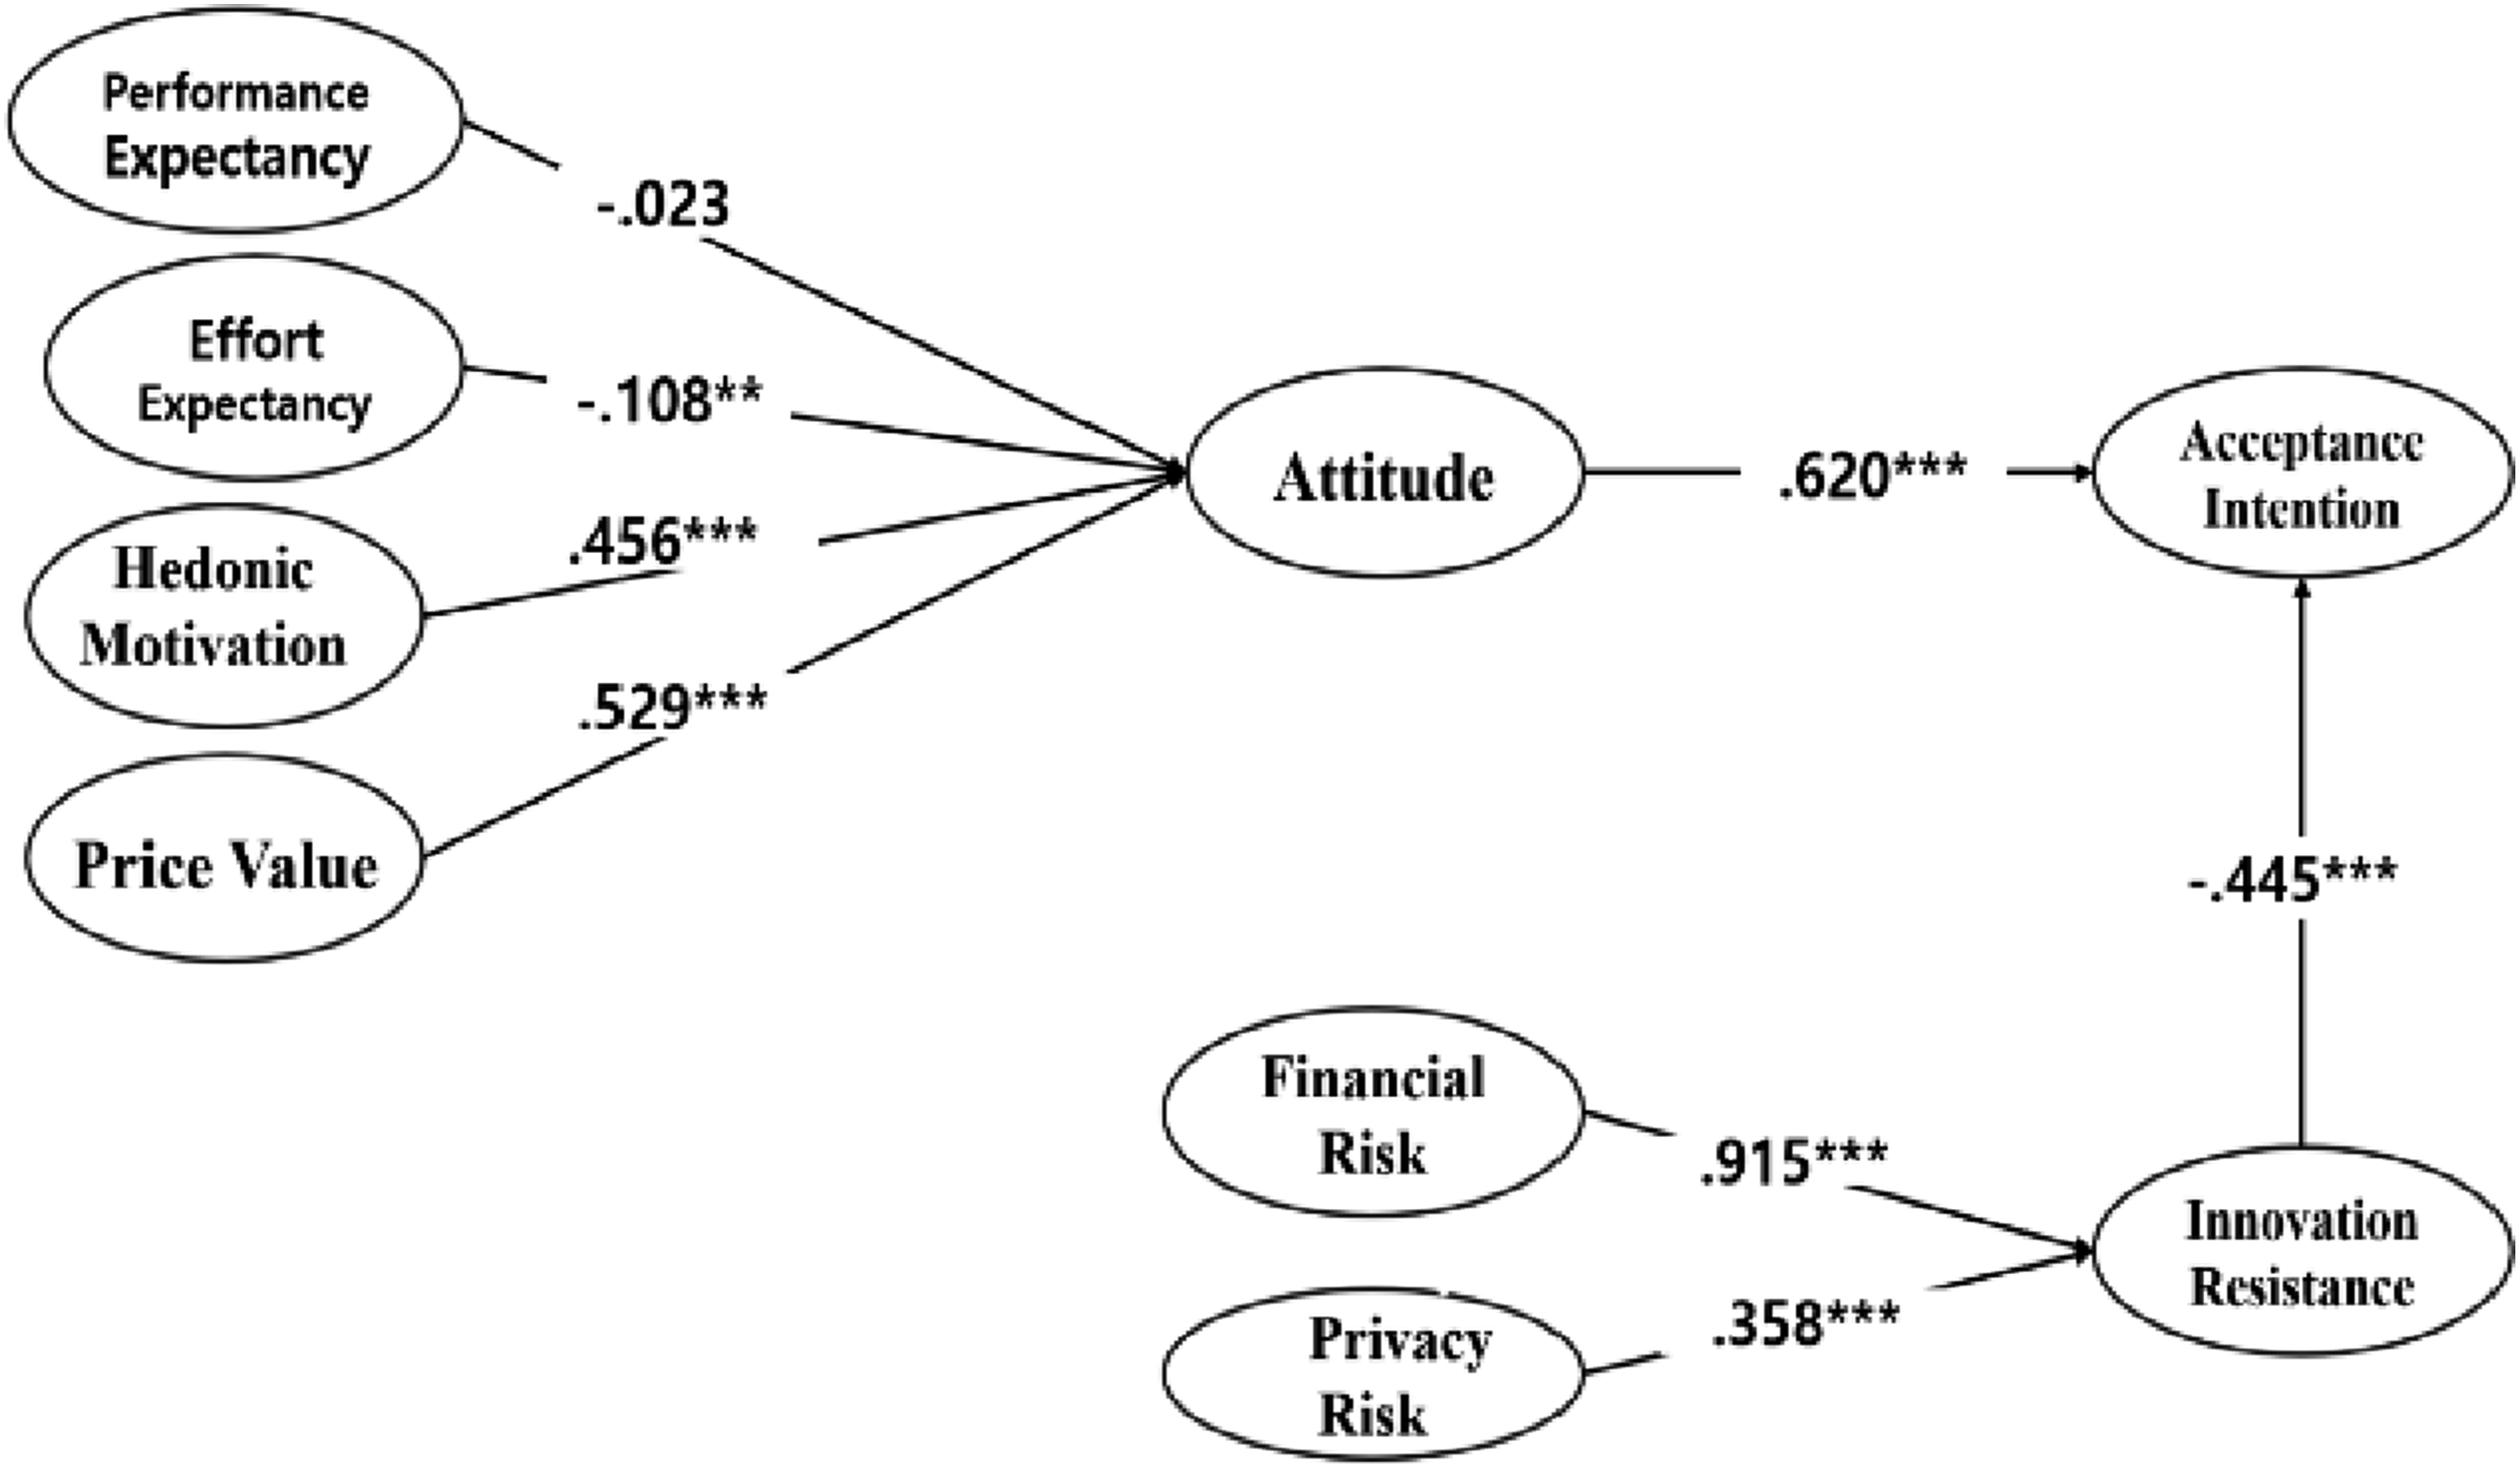
The analysis of the main paths between variables yielded the following results: Our hypothesis predicting that performance expectancy would influence attitude was rejected. The standardized coefficient was -0.015, with t=−0.566 and p>.05. Similarly, the hypothesis that effort expectancy would influence attitude was also rejected; the standardized coefficient was -0.071, with t=−2.708 and p<.01. Conversely, the hypothesis that hedonic motivation would influence attitude was supported.
The standardized coefficient was 0.604, with t=5.794 and p<.001. The hypothesis that price value would influence attitude was also supported; the standardized coefficient was 0.354, with t=9.068 and p<.001. Furthermore, the hypothesis that attitude would influence acceptance intention was supported. The standardized coefficient was 0.740, with t=9.088 and p<.001. The hypothesis that innovation resistance would influence acceptance intention was also supported, with a standardized coefficient of 0.360, t=9.604, and p<.001.
Regarding resistance factors, the hypothesis that financial risk would influence innovation resistance was supported. The standardized coefficient was 0.831, with t=21.539 and p<.001. Lastly, the hypothesis that privacy would influence innovation resistance was supported, with a standardized coefficient of 0.454, t=10.945, and p<.001.
3.5. Model fit
Model fit indices were satisfactory: CFI = 0.94, TLI = 0.92, RMSEA = 0.05.
4. Discussion
This study designed a research model based on UTAUT2 and the MIR. We empirically analyzed factors influencing user acceptance intention of digital therapeutics through surveys, aiming to identify factors that impact the acceptance intention of digital therapeutics, which provides safe and effective treatment. 5
The findings suggest that emotional appeal (hedonic motivation) and perceived value (price value) are stronger predictors of DTx acceptance than usability or performance. The unexpected rejection of Performance Expectancy and Effort Expectancy may reflect skepticism toward unfamiliar medical technologies or the clinical nature of DTx, where trust and efficacy outweigh ease of use.
This counterintuitive result suggests that users may prioritize emotional engagement and affordability over technical ease of use. Successful implementation of digital health tools also depends on user acceptance, perceived value, and readiness for engagement. 7
Future research should explore public readiness for active engagement with DTx, shifting focus from passive acceptance to participatory use. 7
Interestingly, Effort Expectancy showed a significant negative effect on Attitude (β = -0.108, p = .007). This suggests that ease of use may not enhance user perception in the context of DTx, possibly because users prioritize clinical trust and efficacy over usability.
The AVE values for Hedonic Motivation (0.444) and Financial Risk (0.474) were below the recommended threshold of 0.5, indicating measurement limitations. Notably, Hedonic Motivation had a low factor loading (0.202), which may have affected construct validity.
The sample was skewed toward young, educated individuals, which may limit generalizability. Future studies should include more diverse populations.
We also emphasize the importance of provider readiness in successful DTx implementation and recommend exploring active patient engagement in future research. 7
Although effort expectancy is traditionally considered a positive predictor of technology acceptance, our findings revealed a significant negative effect on attitude (β = -0.108, p = .007). This counterintuitive result suggests that in the context of digital therapeutics, ease of use may not enhance user attitude. One possible explanation is that users may prioritize clinical efficacy and trust over usability, especially in health-related applications. 5
This study highlights the importance of hedonic motivation and price value in shaping user acceptance of digital therapeutics.
These findings align with prior studies applying UTAUT2 in digital health contexts in Europe and North America.
The rejection of PE and EE may reflect users’ unfamiliarity with digital therapeutics or skepticism about their usability and effectiveness. 5
5. Conclusions
This study demonstrates that emotional engagement (hedonic motivation) and perceived economic value (price value) are key drivers of digital therapeutics acceptance. In contrast, perceived ease of use and performance expectancy did not significantly enhance user attitude, highlighting the unique nature of health-related technologies. Privacy and financial concerns emerged as major resistance factors. These findings offer actionable insights for developers and policymakers aiming to improve DTx acceptance intention. Future research should explore active patient engagement and provider readiness to support a more resilient digital health ecosystem. 7 This study reveals that emotional appeal and perceived cost are stronger predictors of DTx acceptance than usability or performance. Privacy and financial concerns remain key barriers. 5
This study confirms that hedonic motivation and price value significantly influence acceptance intention, while economic and privacy risks hinder adoption. These insights can inform strategies to improve user engagement and policy design for digital therapeutics.12,13
Supplemental material
Supplemental material - A study on the acceptance intention of digital therapeutics based on UTAUT2 and MIR
Supplemental material for A study on the acceptance intention of digital therapeutics based on UTAUT2 and MIR by Taesung Chung, Sungmin Kim in DIGITAL HEALTH
Supplemental material
Supplemental material - A study on the acceptance intention of digital therapeutics based on UTAUT2 and MIR
Supplemental material for A study on the acceptance intention of digital therapeutics based on UTAUT2 and MIR by Taesung Chung, Sungmin Kim in DIGITAL HEALTH
Footnotes
Acknowledgements
The authors thank the participants for their contributions to this study.
Ethical considerations
This study was conducted in accordance with the Declaration of Helsinki and approved by the Institutional Review Board of Dongguk University (IRB No. DGU-IRB-2023-02-001).
Consent to participate
All participants provided electronic informed consent prior to participation. No personally identifiable information was collected, and all data were anonymized and stored securely. Collected data were stored on password-protected servers accessible only to the research team and will be retained for five years in accordance with institutional guidelines before secure deletion.
Authors contribution
Chung conceptualized the study. Kim performed data analysis and interpretation. Both authors reviewed and approved the final manuscript.
Funding
The authors disclosed receipt of the following financial support for the research, authorship, and/or publication of this article: This work was supported and funded by the training program for advanced medical device industry professionnal manpower of Korea Health Industry Development Institute funded by the Ministry of Health and Welfare, Republic of Korea and the Dongguk University Research Fund of 2025.
Declaration of conflicting interests
The authors declared no potential conflicts of interest with respect to the research, authorship, and/or publication of this article.
Data Availability Statement
Due to privacy and proprietary considerations, they can be made available through appropriate data sharing agreements upon reasonable request to the corresponding author.
AI disclosure
No AI tools were used in the writing, editing, or analysis of this manuscript.
Measurement validation
To ensure measurement validity, items were adapted from validated UTAUT2 and MIR instruments. Reliability was assessed using Cronbach’s alpha and composite reliability (>0.70). Convergent validity was assessed using AVE (>0.50). Although some constructs showed slightly lower AVE, CR values exceeded acceptable thresholds, supporting retention.1,7
Supplemental material
Supplemental material for this article is available online.
References
Supplementary Material
Please find the following supplemental material available below.
For Open Access articles published under a Creative Commons License, all supplemental material carries the same license as the article it is associated with.
For non-Open Access articles published, all supplemental material carries a non-exclusive license, and permission requests for re-use of supplemental material or any part of supplemental material shall be sent directly to the copyright owner as specified in the copyright notice associated with the article.