
Abstract
Objective
Acute kidney injury (AKI) poses a lethal risk in intensive care unit (ICU) patients, where early detection is challenging. This study was to establish a prediction model for AKI 24 hours in advance for ICU patients and to help clinicians monitor patients at an early stage by key features.
Methods
In this study, the Medical Information Mart for Intensive Care (MIMIC) databases were used to construct a dataset of critically ill patients. Predictive models were constructed using five machine learning algorithms based on MIMIC-IV data, and the best predictive model was selected by multiple model evaluation metrics. MIMIC-III data were used for external validation. We conducted an interpretability analysis of the model using SHapley Additive exPlanations (SHAP) to clarify key features and decision-making mechanisms.
Results
A total of 18,186 patient data were included in this study. The analysis combining calibration and decision curves demonstrated that the eXtreme Gradient Boosting (XGBoost) exhibited superior performance among the five algorithms, achieving an area under the receiver operating characteristic curve of 0.88. Interpretability analysis based on the XGBoost model showed diuretic use, mechanical ventilation, vasopressor use, age, and antibiotic use as the most important decision factors of the model. The SHAP summary plot was used to illustrate the effects of the top 19 features attributed to the XGBoost.
Conclusions
The XGBoost algorithm can predict the occurrence of AKI more accurately. Interpretative analysis of the model reveals the mechanisms of key features, and reflects the individual differences between patients, providing an important clinical reference.
Introduction
Acute renal injury is common in patients in intensive care unit (ICU), 1 which is an independent risk factor for mortality in critically ill patients. 2 It is characterized by rapid onset and high incidence rate. At present, diagnosis often relies on two late-stage and nonspecific indicators: serum creatinine (SCr) level and urine excretion. So far, there have been no specific treatment measures that can reverse acute kidney injury (AKI), and only a small number of surviving patients have their renal function fully restored to normal. 3 Therefore, if all indicators can be monitored in time to predict the occurrence of AKI in advance and medical intervention can be carried out in time, it may be possible to reduce both the incidence and mortality rates among patients.
Interpretable machine learning refers to the ability to explain the prediction process and results of machine learning models to end-users in a clear visual manner or in plain text during prediction and decision making. 4 The research on clinical prediction machine learning models should design explanatory methods from the perspective of physicians and provide explanations for specific diseases to meet specific needs and knowledge levels. By adopting a user centered approach, it can be demonstrated that machine learning has the potential to fully empower end users. 5 Among them, feature importance is one of the most common interpretable methods for models, used to assess the influence of features on the model's prediction outcomes. 6
Machine learning algorithms can be used to predict AKI in scenarios such as general surgery, liver transplantation, cardiac surgery, liver resection, severe burns, sepsis, and after percutaneous coronary intervention.7–12 However, the prediction process of some machine learning algorithms resembles a “black box,” 13 and clinicians cannot rely solely on prediction models for diagnosis and treatment. Researchers have developed the Transparent Reporting of a Multivariable Prediction Model for Individual Prognosis or Diagnosis (TRIPOD) statement to improve the quality of predictive model research. 14 Healthcare providers and policymakers also recommend the use of predictive models in clinical practice guidelines. Therefore, research on AKI predictive models should be guided by clinical applications, clarifying the key details of report development and validation of predictive models, so that clinicians can comprehensively evaluate and apply all relevant information.
In summary, current research on predicting AKI based on machine learning methods has some limitations: the prediction mechanism for acute kidney injury, based on data from specific single clinical centers, is applicable only to patient populations with certain common characteristics. Many studies face many challenges, such as outdated samples, severe data missing, and relatively single etiological analysis; Most studies lack in-depth qualitative and quantitative analysis of important features, which cannot provide intuitive references for doctors. Therefore, this study constructed an ICU patient dataset based on the Medical Information Mart for Intensive Care (MIMIC) database, and used five machine learning algorithms to establish ICU patient acute kidney injury prediction models. We evaluated the models from multiple perspectives, and selected the prediction model with the best comprehensive quality. Additionally, the study used the open-source public database MIMIC-III with the same large amount of data, rich information, and diversity for external verification. Finally, we explained the clinical features and model validity, and conducted in-depth analysis of the key features that affect the occurrence of AKI.
Methods
Data source and study population
This study used data from the MIMIC-IV v2.2 15 and MIMIC-III 16 databases. As these datasets are publicly accessible and all personally identifiable patient information has been removed during the data acquisition process, clinical ethical review was not necessary. In addition, the development and validation of the prediction model strictly followed the guidelines of the TRIPOD statement. 14
We extracted ICU patient data from the MIMIC-IV and MIMIC-III datasets between 2008 and 2019 for a retrospective study, incorporating information from five main categories: patient demographic information, physiological indices, laboratory tests, relevant interventions, and comorbid conditions. The MIMIC-IV dataset was used to build the predictive model and the MIMIC-III dataset was used for external validation. In accordance with the staging of AKI according to the Kidney Disease: Improving Global Outcomes (KDIGO) guidelines, 1 and considering that the condition of ICU patients may change significantly shortly after admission, the data collection time window was set to be within the first 24 hours after the patients were admitted to the ICU (Figure 1). Data was extracted according to the following nadir criteria: we included patients who were adults (18+) and had their first ICU stay, and excluded patients who (1) had an ICU stay of less than 24 hours; (2) had an admission SCr greater than 353.6 μmol/L; (3) had an AKI within the first 24 hours after ICU entry; and (4) had end-stage renal disease (glomerular filtration rate less than 15 mL/min). AKI was defined according to the KDIGO guidelines, 1 and AKI ratings were extracted after patients’ admission to the ICU, combining grades 1, 2, and 3 of AKI into a single group of AKI patients and comparing them with non-AKI patients.

Data acquisition window schematic.
Chained equations were implemented based on the miceforest tool in Python, and multiple interpolation was performed for features with less than 60% missing. After deleting the missing data, the total number of eligible samples was 18,186, including 12,703 items for MIMIC-IV patients and 5483 items for MIMIC-III patients. The numerical variables were then Min-Max standardized so that the minimum value of the standardized variable was 0 and the maximum value was 1. According to Gabriel's study on predicting convulsive epilepsy 17 and the prediction model established by Dong for predicting AKI in the pediatric ICU, 18 this study divided the dataset into a training set and a test set with a ratio of 70/30. In this case, the number of samples in the training and test sets was 9138 and 3565, respectively. There were 6286 non-AKI patients and 2852 AKI patients in the training set, and the baseline information of patients in the training set was detailed in Supplemental Table S1.
In this study, considering the interpretability and stability of the model, one-way analysis of variance and the least absolute shrinkage and selection operator (LASSO) regression were used for feature selection. Firstly, one-way analysis was performed on the training set. The training set of 9138 samples was selected, in which the categorical variables were subjected to the chi-square test and the numerical variables were subjected to the Mann-Whitney U rank sum test, and 94 significant features were retained. Secondly, feature selection was performed by LASSO regression. 19 Finally, 82 features were retained to build the predictive model (Supplemental Table S2).
Modeling
We tried the following five most popular and latest machine learning methods for classification problems to develop AKI prediction models including logistic regression (LR), k nearest neighbors (KNN), Light Gradient Boosting Machine (LightGBM), Backpropagation Neural Network (BP Neural Network), and XGBoost algorithm. AKI prediction models dealing with binary classification problems were developed through LR. 20 The KNN algorithm, a widely used class of supervised learning techniques, could quickly and efficiently predict AKI classifications without generating specific prediction models. 21 In this study, LightGBM, a gradient boosting framework based on decision tree algorithm, was used to learn and predict AKI dataset by constructing a decision tree model. 22 BP Neural Network was able to train multilayer neural networks by back propagating the error to solve the complex nonlinear problems, which was usually supported by complex mathematical principles. 23 XGBoost did not only break the computational limitations of gradient boosting algorithms, but also achieved faster computation speed and better performance than traditional gradient boosting algorithms with significant optimization and enhancement. All analyses were developed in Python. Models were imported using training set data, and the best hyperparameters were selected through five-fold cross-validation to reduce the variance of performance estimates and improve model generalization performance.
To assess the prediction and accuracy of various machine learning models, five evaluation metrics, accuracy, sensitivity, F1 score, and area under the receiver operating characteristic curve (AUC) value, were calculated and calibration curves and decision curves were plotted. Correctly interpreting machine-learning predictive models was very important to increase clinical applicability. Based on the Shapley value in cooperative game theory, SHapley Additive exPlanation (SHAP) could explain the prediction results given by any machine learning model and provided a quantitative measure of the importance of features. 24 SHAP has become one of the most commonly used interpretable frameworks in machine learning.25,26 Therefore, we used SHAP values for in-depth qualitative and quantitative analysis of key features to measure how much each feature affected the predictive model and to increase the interpretability of the model.
Results
We evaluated the prediction and accuracy of various machine learning models by calculating five evaluation metrics: accuracy, sensitivity, F1 value, and AUC value of the models (Table 1). It could be seen that the KNN model performed relatively poorly, and the XGBoost model, LightGBM model and BP neural network had higher accuracy and AUC values. Therefore, we further used the test set to evaluate and analyze the models (Table 2). To ensure that the AUC values were comparable across models, we added the paired DeLong test. 27 The prediction results of BP neural network, LightGBM and XGBoost models were close to each other and significantly better than those of LR and KNN (Figure 2).
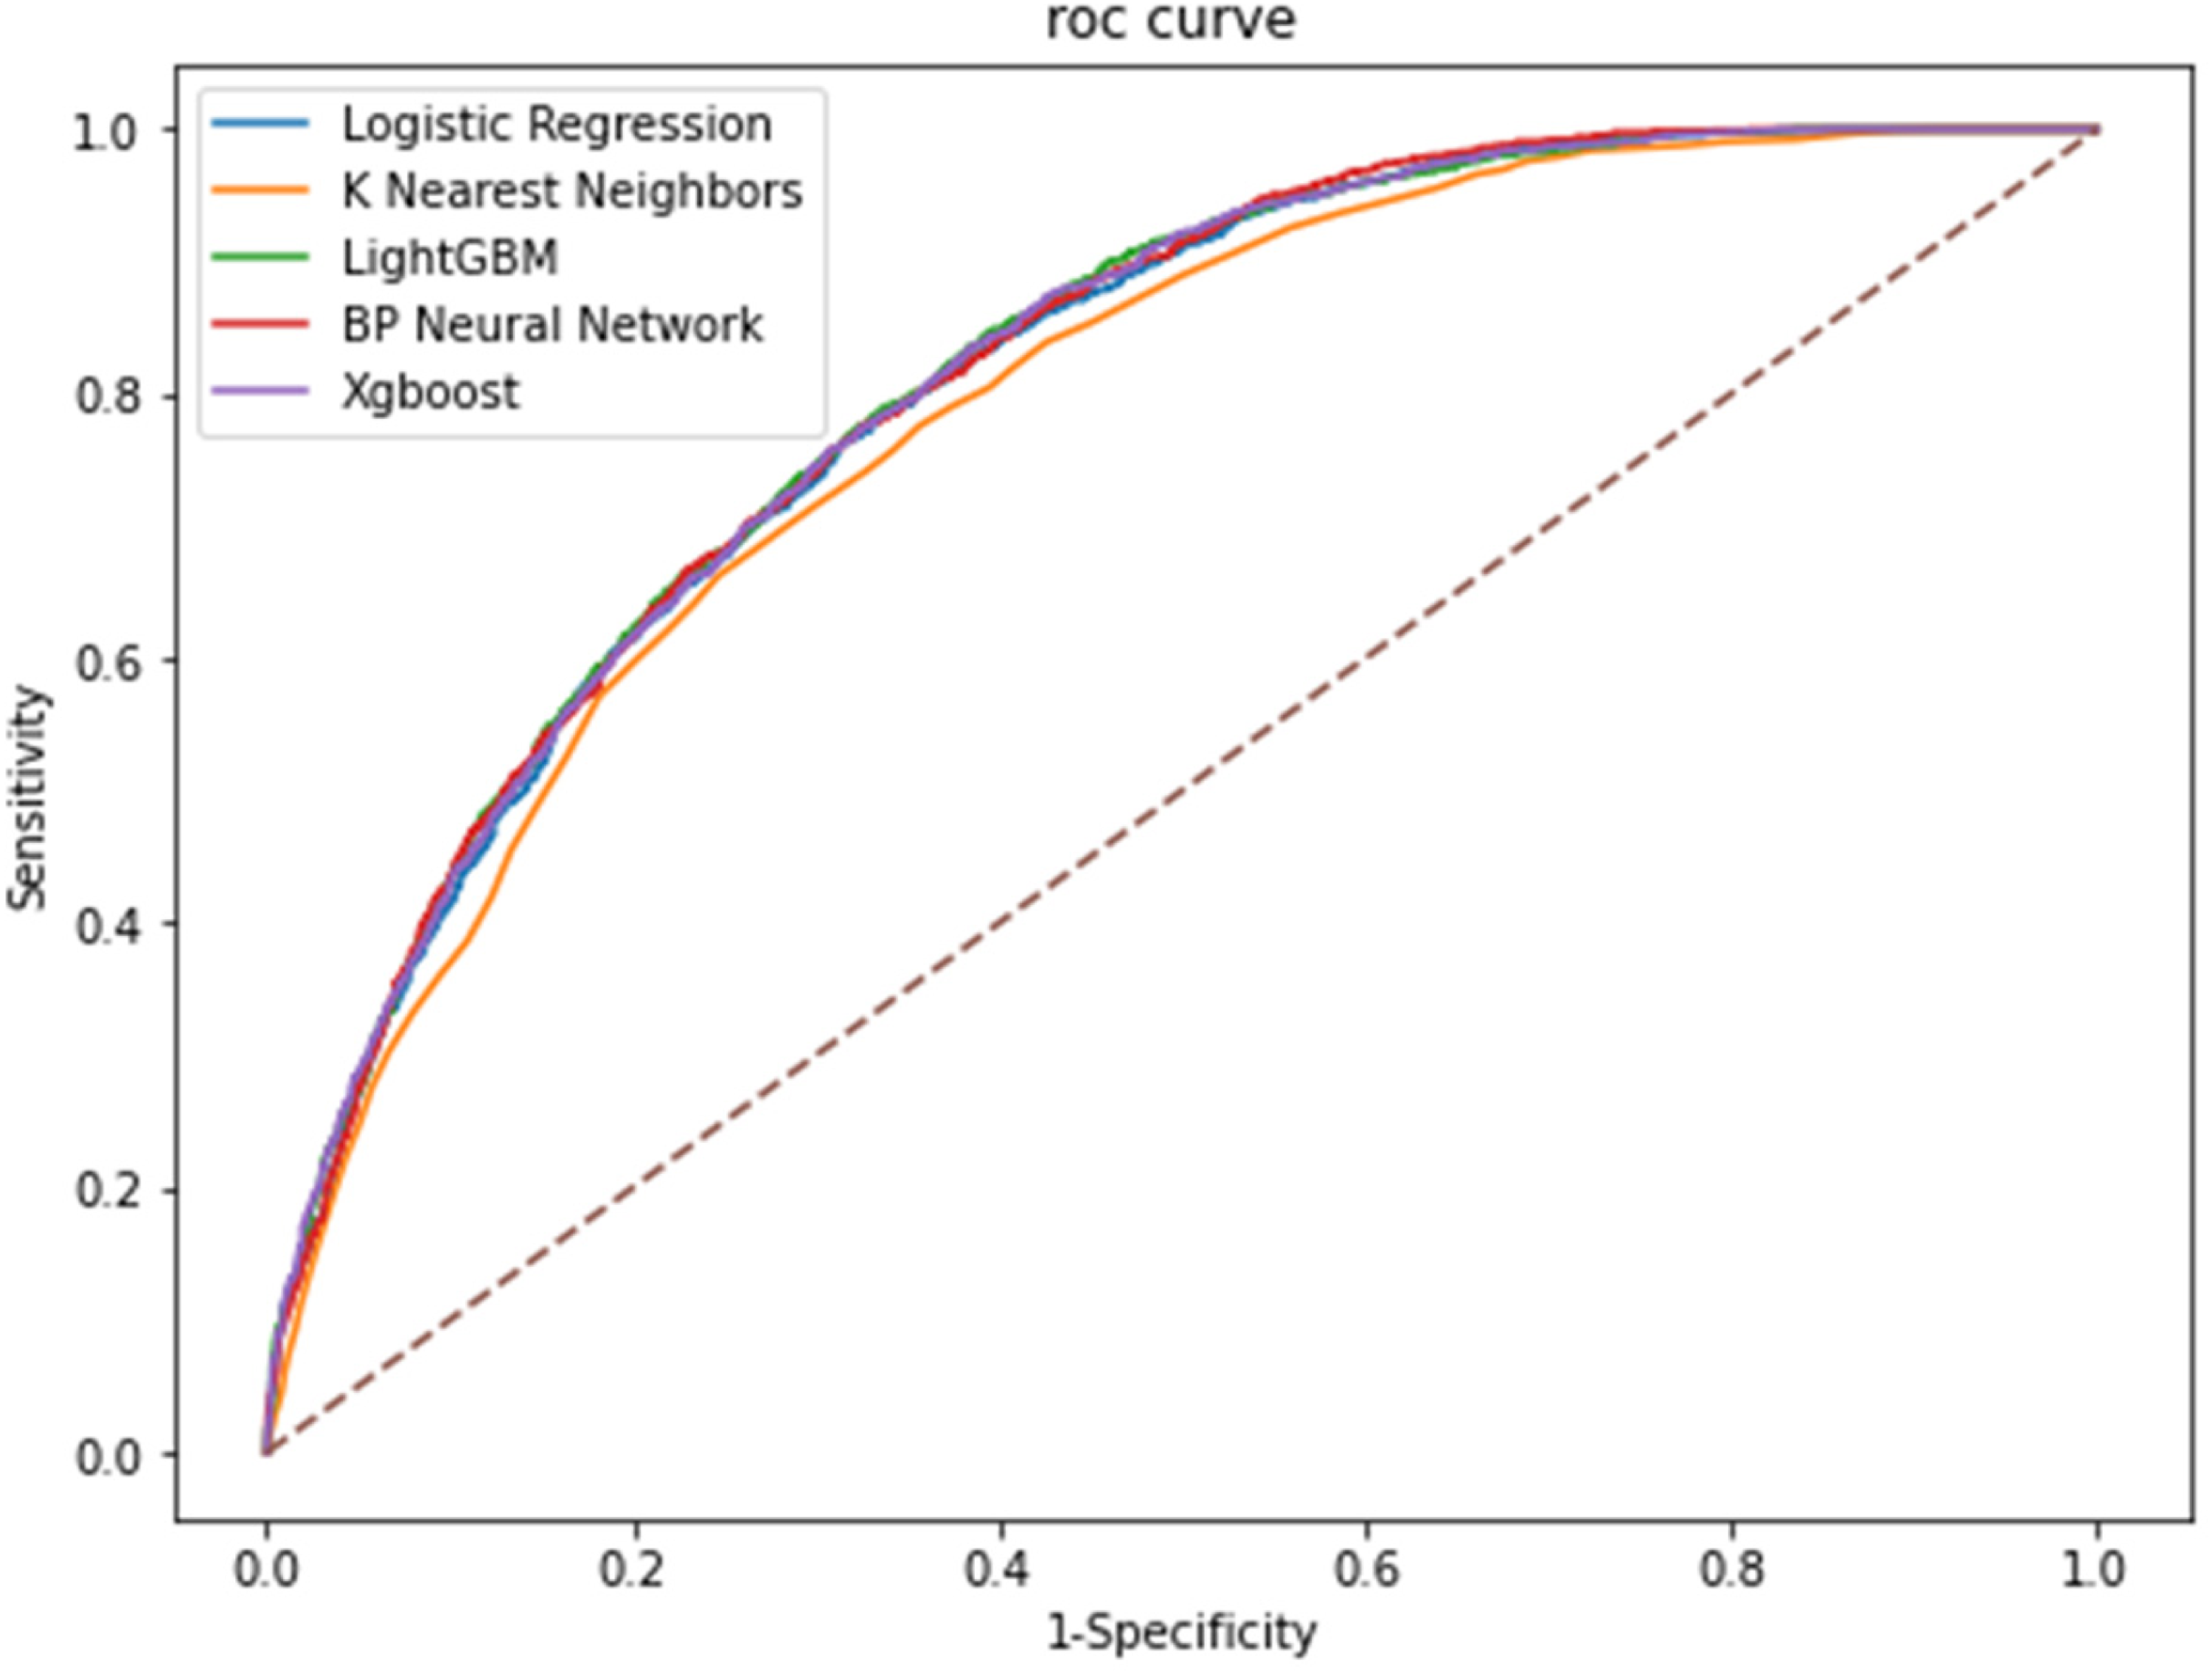
Comparison of AUCs among machine learning models. AUC: area under the receiver operating characteristic curve.
Training set model evaluation indicator results.

Note: aComparison between XGBoost model and other models using DeLong test. AUC: area under the receiver operating characteristic curve.
Test set model evaluation indicator results.

Note: aComparison between XGBoost model and other models using DeLong test. AUC: area under the receiver operating characteristic curve.
In order to select the best prediction model, we plotted the calibration curves of the five-model models (Figure 3). It could be intuitively observed that the XGBoost model had higher reliability, with the smallest mean absolute error (MAE) of 0.016880. The BP neural network, although ranked well in terms of the AUC value, the model had more obvious bias or calibration errors.

Calibration curve among machine learning models.
Further decision curve analysis was performed to plot the decision curve (Figure 4). The decision curve analysis (DCA) results of the model (Table 3) showed that the XGBoost model had a higher net gain under the same probability threshold. Therefore, this study concluded that the combined effect of the XGBoost model was better than the other models.

The decision curve analysis among machine learning models.
Decision curve analysis results among machine learning models.

Finally, the optimal XGBoost model was subjected to external validation using the MIMIC-III dataset to assess its generalizability. The external validation set comprised 5483 items. The results of the XGBoost model on this external validation set were as follows: accuracy was 0.7511, and the AUC value was 0.8099. These results were consistent with the performance on the test set, indicating that the XGBoost model had good generalization capabilities.
In order to identify the most influential features in the XGBoost model, we plotted a bar graph of the top 19 features in terms of importance (Figure 5). The top 5 most important features to the model were diuretic use, mechanical ventilation, vasopressor use, admission age, and antibiotic use. In addition, we plotted SHAP-dependent scatter plots, which could be used to visualize and understand the influence of features on the prediction results (Supplemental Figures 1–5). When the SHAP value was greater than 0, it indicated an increased risk of AKI.
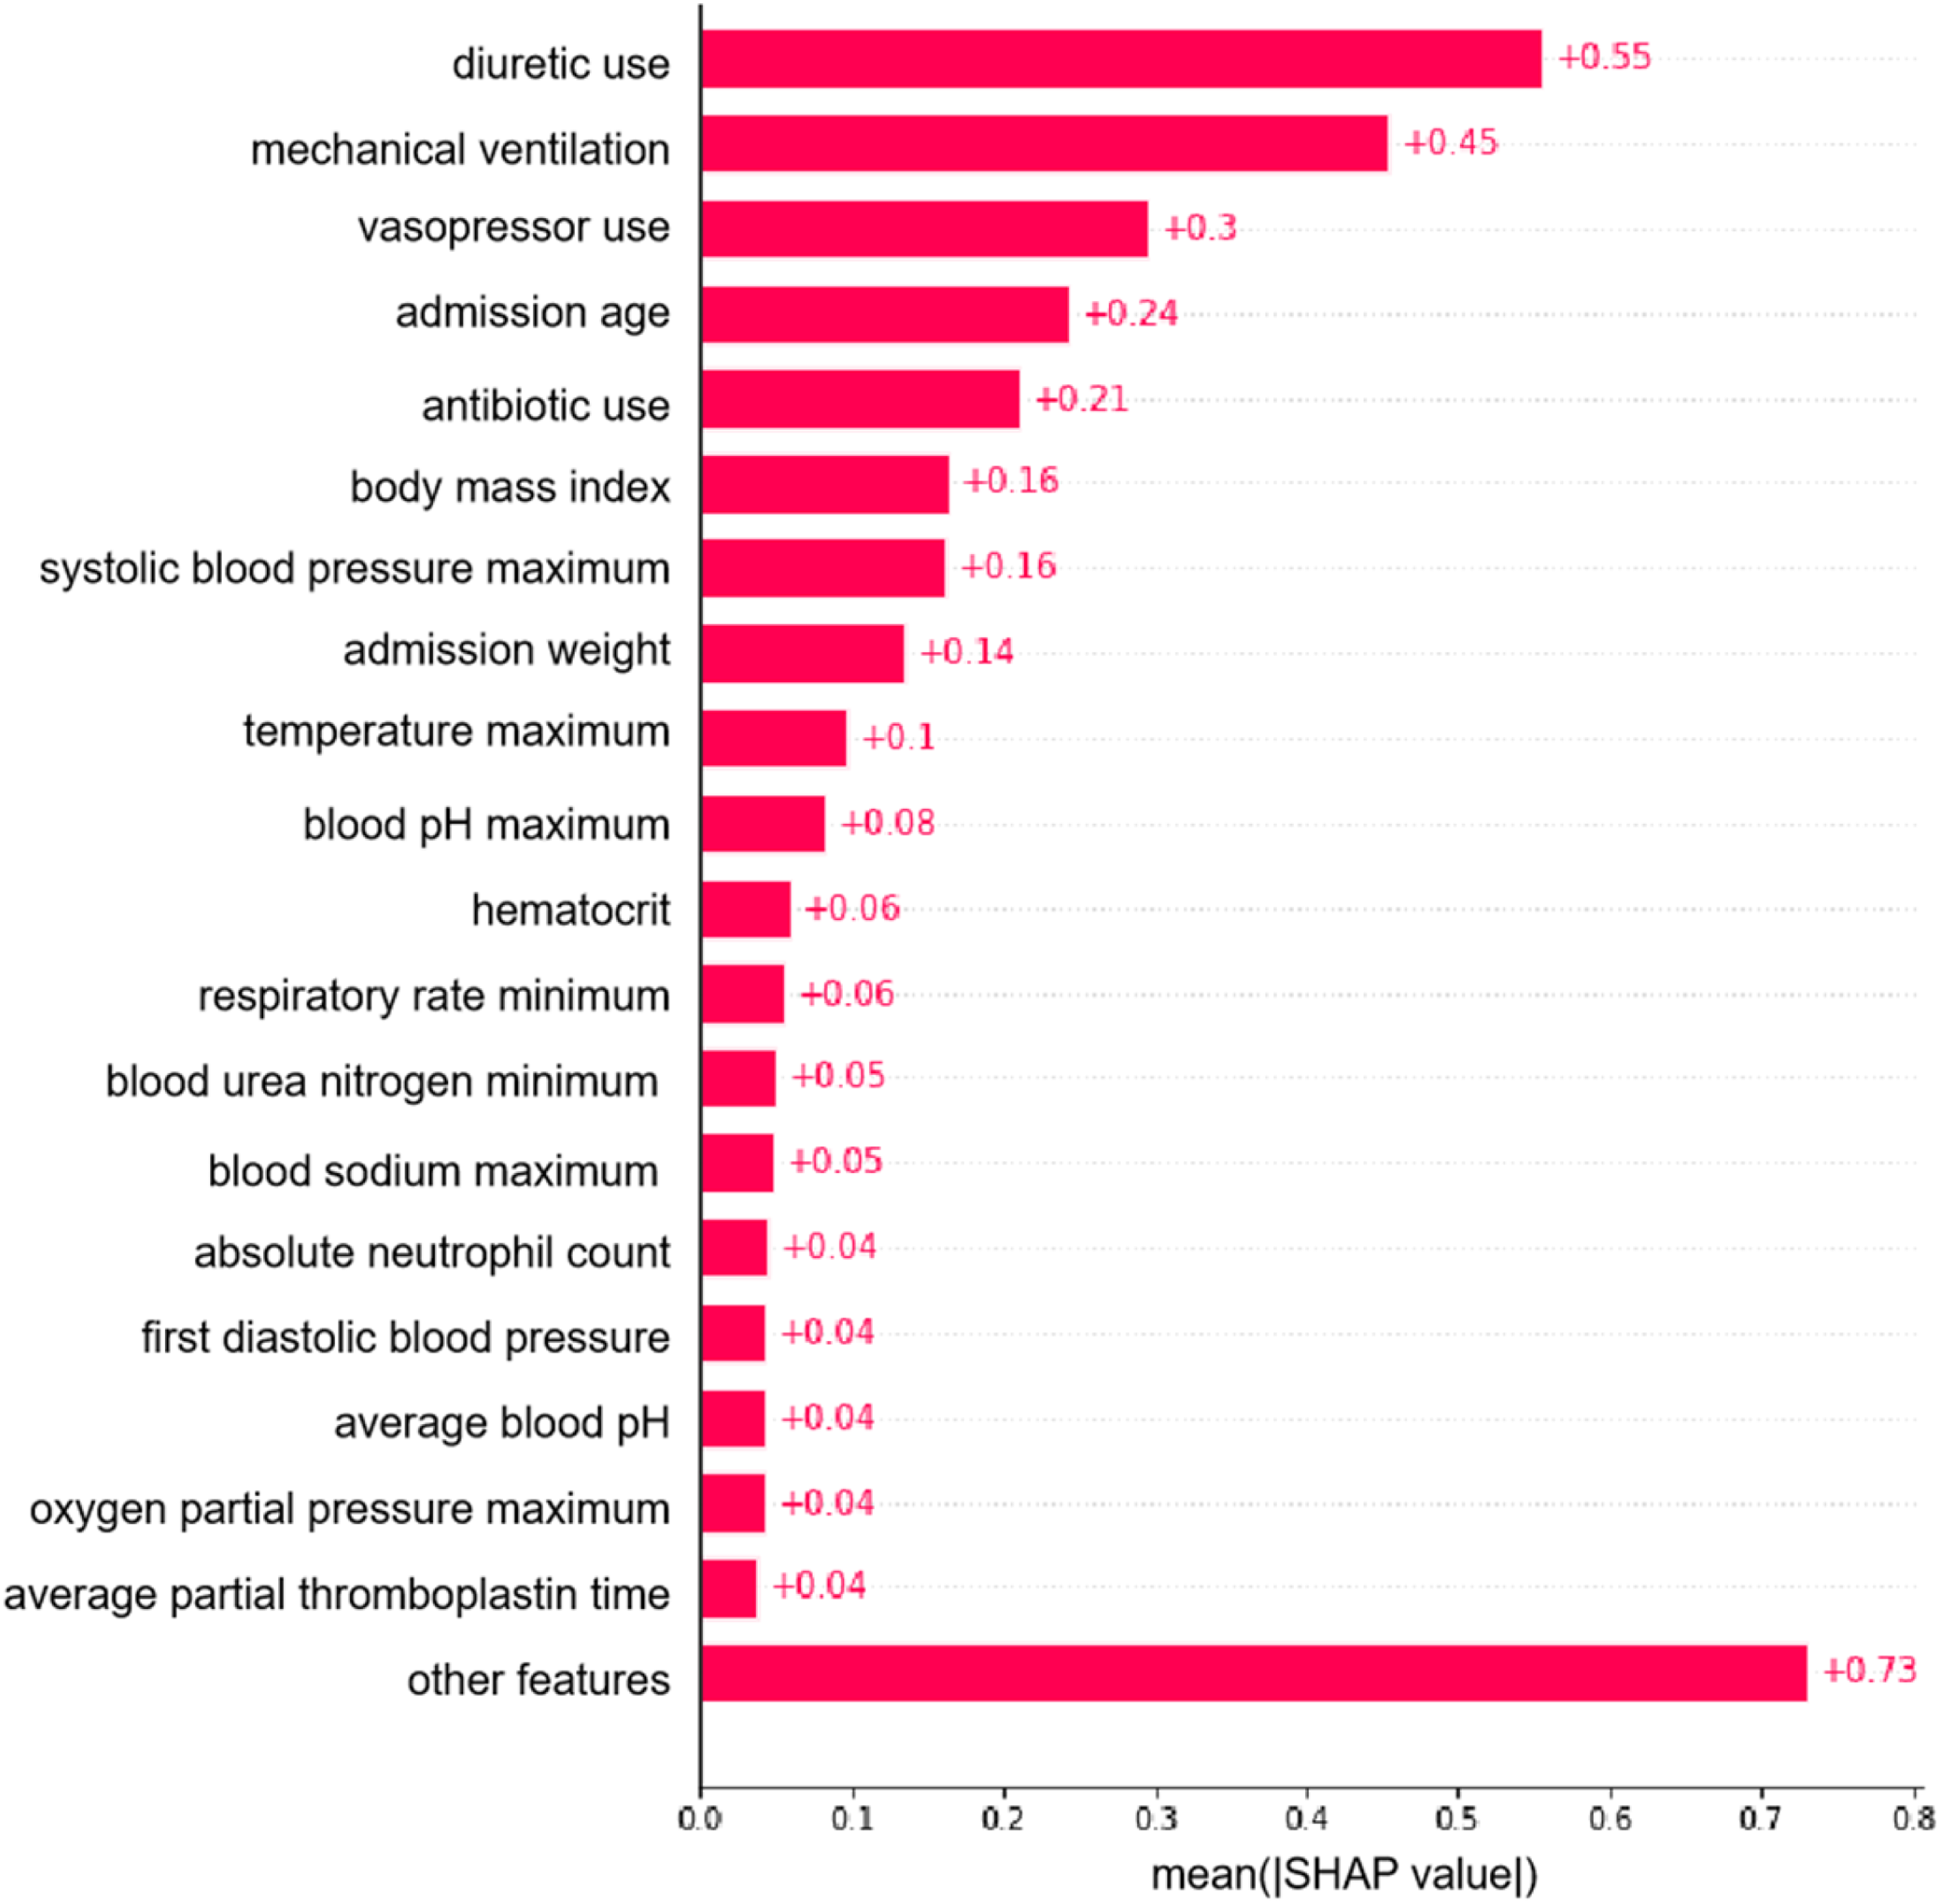
Importance matrix plot of the XGBoost model.
Robustness test
This study ensured research robustness by re-selecting the features included in the model. Specifically, we further limited the missing proportion of features and performed multiple interpolation on features with a missing proportion of less than 50%. Subsequently, univariate analysis and LASSO regression methods were used for feature selection, and 74 features were finally retained to establish a prediction model. For the new features, we used the same five machine learning methods (LR, KNN, LightGBM, BP neural network, and XGBoost algorithm) and the same training and test sets as the main study to model the new features. The results were shown in Supplemental Tables S3 and S4. The results showed that the XGBoost model still had high performance, ensuring the robustness of the study.
Discussion
In this retrospective cohort study, we developed and validated a machine learning algorithm using 82 features to predict the occurrence of AKI in ICU patients. Compared with other machine learning algorithms, the XGBoost model showed the best performance in terms of prediction accuracy, stability, and clinical applicability, and its externally validated generalization performance was superior and could be generalized to different settings.
Interpretability analysis of key features
In line with previous studies, diuretic use, 28 mechanical ventilation, 29 vasopressor use, 30 admission age, 31 and antibiotic use 32 were key risk features. For example, increasing patient age was associated with a higher likelihood of the model predicting AKI, which was consistent with the current clinical understanding of the correlation between age and the risk of AKI. 33 Furthermore, this article clarified the key features of AKI occurrence as well as the mechanisms by which important features influenced the predictive outcomes, thereby enhancing the interpretability and practicality of the predictive model. For instance, the SHAP dependency scatter plot indicated that the absence of vasopressors exerted a detrimental influence on the progression of AKI; in contrast, the use of vasopressors had a positive effect on the development of AKI. Therefore, the use of vasopressors was a risk factor for AKI, and patients who used vasopressors were more likely to develop AKI. In terms of interaction effects, ICU patients who had used vasopressors and were on mechanical ventilation were more likely to develop AKI within the subsequent 24 hours. During clinical surgery, there were numerous reasons for hypotension and the use of vasopressors, including inadequate blood volume, pre-existing cardiovascular diseases, and aging, as well as the possibility of hypotension due to excessive anesthesia. 34 Intraoperative hypotension was a common complication of general anesthesia and surgery, and it was associated with postoperative acute kidney injury. 35 Therefore, the AKI caused by the use of vasopressors was essentially possibly due to hypotension-induced AKI. This study also suggested that clinicians should be attentive to the possibility of ICU patients with hypotension developing into AKI during actual diagnosis and treatment.
Cross-system validation
Most of the studies have validated the models through cross-validation, and very few studies have performed external validation. The cross-system validation was particularly important for predicting the generalization ability of a model. 36 For example, single-center studies for post-war trauma populations could ensure comprehensive capture of specific patient characteristics, effectively improving the reliability of single-center data, but could not confirm the applicability of findings to post-war trauma populations in other regions. 37 Therefore, in this study, the predictive model was externally validated using MIMIC-III data to assess the ability of the model to generalize.
The early risk prediction model of AKI constructed in this study had high clinical application value. First, this predictive model could help physicians identify high-risk patients 24 hours before the onset of AKI so that timely and effective interventions could be taken to reduce the incidence of AKI and mortality. 38 Second, the key features revealed through interpretable analytics could provide important reference information for physicians, guiding them to more accurately assess the patient's condition and formulate treatment plans. 39 Third, the model could be used as part of a clinical decision support system to assist physicians in more scientific and efficient diagnosis and treatment.
The model we have constructed may impact the daily clinical workflow in the ICU as follows: (1) By performing real-time analysis of patient data, the model is capable of identifying patients at high risk for AKI, enabling healthcare providers to implement more targeted monitoring strategies and thus take preventive measures in advance. (2) The predictive information provided by the model can assist physicians in dynamically adjusting treatment plans, implementing more aggressive fluid management and pharmacological therapies for patients at high risk, thereby reducing the incidence of AKI. (3) The XGBoost model can serve as part of a clinical decision support system, offering evidence-based predictions to physicians, enhancing clinical judgment, and improving patient prognosis. (4) The model can aid ICU staff in identifying and managing patients at high risk for AKI, reducing unnecessary monitoring for other patients, and increasing overall nursing efficiency.
Strengths and limitations
The strengths of this study are (1) the combination of two databases of critically ill patients, MIMIC-IV v2.2 and MIMIC-III, which provided sufficient sample size and diverse feature dimensions to construct a prediction model for ICU patients 24 hours in advance. (2) A variety of machine learning methods were used for prediction, and not only the evaluation indexes of the model itself, but also the calibration curve analysis and decision curve analysis were used in selecting the best prediction model, which improved the prediction accuracy, stability and clinical applicability of the model. (3) An exhaustive interpretability analysis of the best model was conducted, not only qualitatively assessing the key features, but also deeply exploring the mechanism of these features on the prediction results, providing specific guidance for clinical practice.
The limitations of this study are as follows: (1) Although there is no crossover of patients between the two databases, all patients are from the US region, and the applicability of the model results to domestic patients needs to be further tested. (2) The data preprocessing process used a direct deletion strategy for the high level of missing data, which probably deleted the features that had a greater impact on AKI. In the future, it is hoped that the data preprocessing process will be further optimized to maintain the integrity of the original data information to the greatest extent possible. (3) Due to data limitations, the laboratory tests included in the prediction model were all routine tests, and the AKI biomarkers in the latest study were not included in the study. (4) The medical histories included in the model were broad due to the constraints of the data source, and the patient's specific history of AKI could not be included in the variables.
Conclusion
The machine learning model described in this study is capable of accurately predicting the onset of AKI in ICU patients up to 24 hours in advance. Validated within the MIMIC-IV and MIMIC-III databases, the model demonstrates commendable performance and has the potential to improve AKI outcomes in the ICU by providing early warnings and actionable feedback.
Supplemental Material
sj-docx-1-dhj-10.1177_20552076241311173 - Supplemental material for Prediction of acute kidney injury in intensive care unit patients based on interpretable machine learning
Supplemental material, sj-docx-1-dhj-10.1177_20552076241311173 for Prediction of acute kidney injury in intensive care unit patients based on interpretable machine learning by Li Zhang, Mingyu Li, Chengcheng Wang, Chi Zhang and Hong Wu in DIGITAL HEALTH
Footnotes
Acknowledgments
We appreciate the MIMIC-IV and MIMIC-III databases for their tremendous work in making the survey data freely available to researchers.
Declaration of conflicting interest
The authors declared no potential conflicts of interest with respect to the research, authorship, and/or publication of this article.
Ethical considerations
Ethical approval was not required as this study data is open sourced, and the original research have already conducted.
Funding
The authors disclosed receipt of the following financial support for the research, authorship, and/or publication of this article: This work was supported by the National Natural Science Foundation of China (grant number 72001087; 72371111).
Supplemental material
Supplemental material for this article is available online.
References
Supplementary Material
Please find the following supplemental material available below.
For Open Access articles published under a Creative Commons License, all supplemental material carries the same license as the article it is associated with.
For non-Open Access articles published, all supplemental material carries a non-exclusive license, and permission requests for re-use of supplemental material or any part of supplemental material shall be sent directly to the copyright owner as specified in the copyright notice associated with the article.