
Abstract
Background
Elderly patients are more likely to suffer from severe ischemic stroke (IS) and have worse outcomes, including death and disability. We aimed to develop and validate predictive models using novel machine learning algorithms for the 3-month mortality in elderly patients with IS admitted to the intensive care unit (ICU).
Methods
We conducted a retrospective cohort study. Data were extracted from Medical Information Mart for Intensive Care (MIMIC)-IV and International Stroke Perfusion Imaging Registry (INSPIRE) database. Ten machine learning algorithms including Categorical Boosting (CatBoost), Random Forest (RF), Support Vector Machine (SVM), Neural Network (NN), Gradient Boosting Machine (GBM), K-Nearest Neighbors (KNNs), Multi-Layer Perceptron (MLP), Naive Bayes (NB), eXtreme Gradient Boosting (XGBoost) and Logistic Regression (LR) were used to build the models. Performance was measured using area under the curve (AUC) and accuracy. Finally, interpretable machine learning (IML) models presenting as Shapley additive explanation (SHAP) values were applied for mortality risk prediction.
Results
A total of 1826 elderly patients with IS admitted to the ICU were included in the analysis, of whom 624 (34.2%) died, and endovascular treatment was performed in 244 patients. After feature selection, a total of eight variables, including minimum Glasgow Coma Scale values, albumin, lactate dehydrogenase, age, alkaline phosphatase, body mass index, platelets, and types of surgery, were finally used for model construction. The AUCs of the CatBoost model were 0.737 in the testing set and 0.709 in the external validation set. The Brier scores in the training set and testing set were 0.12 and 0.21, respectively. The IML of the CatBoost model was performed based on the SHAP value and the Local Interpretable Model-Agnostic Explanations method.
Conclusion
The CatBoost model had the best predictive performance for predicting mortality in elderly patients with IS admitted to the ICU. The IML model would further aid in clinical decision-making and timely healthcare services by the early identification of high-risk patients.
Introduction
Ischemic stroke (IS) accounts for approximately 80% of strokes and has become the second leading cause of mortality. 1 Previous research has revealed that over 75% of strokes occur in the elderly, leading to a significant financial burden.2,3 By 2050, the global population of elderly individuals will exceed that of individuals under 65 for the first time in recorded history. 4 With prolonged life expectancy, an aging population leads to significantly increased stroke rates. 5 By 2050, the number of stroke survivors is projected to exceed 200 million. 6 Therefore, it is important to focus on managing acute stroke in the elderly to decrease the occurrence and enhance outcomes in this vulnerable group. 7
The risk factors for stroke and mechanisms of ischemic injury differ between young and elderly patients. Additionally, elderly patients with ischemic stroke frequently receive ineffective therapy and experience worse outcomes compared to younger individuals with the condition. 7 Because of the different profiles of risk factors and different frequencies of stroke etiologies and subtypes, 8 the models established from younger cohorts may lead to suboptimal care for elderly patients, 9 and special models are needed for the elderly. When stroke-related cerebral impairment impairs the function of other vital organs, patients may require intensive care unit (ICU) care. There were significant differences between those admitted to the ICU and those admitted to the neurological ward. The ICU group was characterized by higher neurological severity, measured using validated instruments (e.g. the National Institutes of Health Stroke Scale, NIHSS 10 ); moderate to severe impairment of consciousness; need for mechanical ventilation in many cases 11 ; and high in-hospital mortality. What's more, functional outcomes in survivors entering ICU appear to be poor, especially in elderly patients. 12 Except for stroke severity scoring systems, such as NIHSS, outcome assessment should include the clinical evolution and the quality of survival, using appropriate tools. 13 Therefore, special models should be constructed for managing elderly ICU individuals with IS.
Artificial intelligence is increasingly being used in medicine, and clinical decision aid systems that rely on artificial intelligence have become a research hotspot. 14 Recently, new machine learning algorithms have shown superior performance in various competitions, such as Categorical Boosting (CatBoost), and eXtreme Gradient Boosting (XGBoost).15,16 What's more, the studies using machine learning (ML) algorithms to predict three-month ICU mortality in elderly stroke patients are limited.
Therefore, the aim of our study was to develop a prognostic model for elderly ICU individuals with IS that could reliably identify patients at a very high risk of death. We developed interpretable machine learning models for predicting three-month in-hospital mortality. We further analyzed the contribution of each variable of the interpretable machine learning (IML) Model outcome using the Shapley Additive exPlanation (SHAP) values.
Methods
Design and participants
Our study was conducted in accordance with the TRIPOD checklist, 17 and details are shown in Supplement Figure 6. We did a multicenter, retrospective study. For model training and testing, we used the data from the Medical Information Mart for Intensive Care (MIMIC). Data of elderly patients with IS were extracted from the publicly available critical care database, MIMIC-IV 2.0. 18 All data were extracted from MIMIC-IV 2.0 (certification ID: 43357625). Philips Healthcare provided the MIMIC-IV database in partnership with Massachusetts Institute of Technology (MIT) Laboratory for Computational Physiology. It included de-identified death data for 23,844 ICU patients admitted between 2008 and 2019. Based on the de-identified patient information, the database's official ethics committee approved the public distribution of these clinical data. Consent was waived because retrospective patient data were anonymized.
The inclusion criteria were as follows: (1) diagnosis of IS according to ICD-9-CM diagnoses: 434.91 (cerebral artery occlusion, unspecified with cerebral infarction) or ICD-10-CM diagnoses of IS: I63.50 (cerebral infarction due to unspecified occlusion or stenosis of unspecified cerebral artery); (2) first-time ICU visit; (3) age ≥65 years. The exclusion criteria were as follows: (1) ICU stay of less than 24 hours; (2) individuals with missing values of more than 30%.
The external validation set is from the International Stroke Perfusion Imaging Registry (INSPIRE) dataset Version 1.2, a publicly accessible research dataset dedicated to perioperative medicine. It encompasses around 130,000 patients, involving patients at a South Korean academic institution over the period 2011 to 2020. The inclusion criteria were as follows: (1) diagnosis of IS; (2) age ≥65 years. Patients with personal data missing of more than 30% were excluded. Finally, the external validation set of 515 patients came from the INSPIRE dataset.
Outcome variables and predictors
The primary outcome was death of elderly stroke patients within three months after ICU admission, either in or out of the hospital. Data on deaths in discharged patients were collected during the follow-up. Clinical information was gathered within 24 hours of admission. A literature review was used to identify candidate predictor factors, with an emphasis on those available in the ICU. The 52 candidate variables were listed in Table 1. The variables include: (1) Demographic data: gender, age (years), race, and smoking. (2) Vital sign data: body mass index (BMI, kg/m2), heart rate (bpm), systolic blood pressure (SBP, mmHg), diastolic blood pressure (DBP, mmHg), mean blood pressure (MBP, mmHg), pulse oximetry (SpO2, %), respiratory rate (bpm), and temperature (degrees C). (3) Laboratory test data: glucose (mg/dL), hematocrit (%), hemoglobin (g/dL), platelets (K/µL), white blood cell count (WBC, K/µL), mean corpuscular hemoglobin (MCH, pg), mean corpuscular hemoglobin concentration (MCHC, %), mean corpuscular volume (MCV, fL), red blood cell count (RBC, m/µL), red blood cell volume distribution width (RDW, %), blood urea nitrogen (BUN, mg/dL), alanine aminotransferase (ALT, IU/L), alkaline phosphatase (ALP, IU/L), aspartate aminotransferase (AST, IU/L), LDH (lactic dehydrogenase, IU/L), international normalized ratio (INR), prothrombin time (PT, seconds), partial thromboplastin time (PTT, seconds). 4) Disease information: myocardial infarction, congestive heart failure, dementia, chronic obstructive pulmonary disease (COPD), diabetes mellitus (DM), renal disease, malignant cancer, severe liver disease, and types of endovascular surgery (Type). 5) Score data: Acute Physiology Score III (APSIII), Logistic Organ Dysfunction System (LODS), Sequential Organ Failure Assessment (SOFA), and minimum Glasgow Coma Scale values (GCS min). Instead of selecting the extreme value, we chose the average value of the features recorded multiple times in the electronic medical record system of a patient's hospital, thus mitigating the impact of data fluctuations on the outcome. Variables with more than 30% missing values were excluded from analysis to ensure accuracy. Missing values for the variables of the derivation cohort were listed in Supplementary Table 3. The K-Nearest Neighbor (KNN) algorithm was used to fill in the missing values for the variables with missing values less than 30%, which was fitted to the train data and applied to both the train and the test sets. Using the R package “DMwR” and the function “Knn Imputation”, the remaining variables with missing values were imputed with default parameters (including k = 5).
The population demographics and clinical characteristics.

BMI: body mass index; COPD: chronic obstructive pulmonary disease; DM: diabetes mellitus; APSIII: Acute Physiology Score III; LODS: Logistic Organ Dysfunction System; SOFA: Sequential Organ Failure Assessment; GCS min: minimum Glasgow Coma Scale values; SBP: systolic blood pressure; DBP: diastolic blood pressure; MBP: mean blood pressure; SpO2: pulse oximetry; WBC: white blood cell count; MCH: mean corpuscular hemoglobin; MCHC: mean corpuscular hemoglobin concentration; MCV: mean corpuscular volume; RBC: red blood cell count; RDW: red blood cell volume distribution width; BUN: blood urea nitrogen; ALT: alanine aminotransferase; ALP: alkaline phosphatase; AST: aspartate aminotransferase; LDH: lactic dehydrogenase; INR: international normalized ratio; PT: prothrombin time; PTT: partial thromboplastin time; Type: types of endovascular surgery.
Model training and testing
The entire study population were randomly divided into training and testing sets at an 8:2 ratio.
Selection procedure
Recursive feature elimination (RFE) was applied to select the most influential features for predicting outcome events using the training set. Area under the curve (AUC) values were then measured using the RFE algorithm.
Machine learning model development
The study employed ten common machine learning algorithms, including CatBoost, Random Forest (RF), Support Vector Machine (SVM), Neural Network (NN), Gradient Boosting Machine (GBM), KNN, Multi-Layer Perceptron (MLP), Naive Bayes (NB), XGBoost, and Logistic Regression (LR), to predict the three-month mortality in elderly ICU patients with IS. We employed five-fold cross-validation on the training set to optimize the parameters. For each classifier, the hyperparameters that produced the highest average receiver operating characteristic curve (AUROC) in the five-fold cross-validations were chosen and adjusted before model testing. To evaluate the performance of these algorithms, we used a testing set that included 355 patients who were not part of the model training process. The AUROC, sensitivity, specificity, positive predictive value (PPV), negative predictive value (NPV), accuracy, and F1 score were used to assess the performance. Additionally, we drew calibration curves and calculated the Brier score. We also did a decision curve analysis (DCA) to evaluate the net clinical benefit.
Statistical analysis
Data are expressed as mean ± standard deviation (SD) when normally distributed and as median and interquartile range (IQR) in the presence of skewed distribution. Categorical variables were expressed as frequencies and percentages and were compared using chi-squared analysis or Fisher's exact test. Outliers were identified and removed. For univariate analysis, the R packages “Nortest” and “CBCgrps” were used. The RFE feature selection was achieved using the rfe function of the “caret” package, within a cross-validation. The R package “caret” was used to propose the machine learning models. The receiver operating characteristic (ROC) analysis and area under the curve (AUC) calculations were performed using R package “pROC”. Interpretability analysis based on SHAP. Local Interpretable Model-Agnostic Explanations (LIME) was performed by “modelstudio” package, and “lime” package in R (version 4.2.0). P < 0.05 was considered statistically significant.
Results
Population demographics
There were 3115 admissions for IS. The 1826 IS patients were eligible for further analysis according to the inclusion and exclusion criteria (Figure 1), of which 54% (995) were women and 46% (831) were men, with a median age of 78 years (IQR, 71–85 years). A total of 1202 patients with IS survived for three months in the hospital, and 624 died. Table 1 shows the characteristics of the survival and mortality groups.

(a) Flow diagram of the study population. (b) Model development and performance comparison.
Compared to the death group, the BMI, SBP, temperature, SpO2, hematocrit, hemoglobin, RBC, MCH, MCHC, albumin, blood calcium, and bicarbonate were significantly higher in the survival group (P < 0.05). Nevertheless, the levels of bilirubin, age, heart rate, GCS min, LODS, SOFA score, respiratory rate, glucose, WBC, RDW, anion gap, BUN, creatinine, potassium, ALT, AST, ALP, LDH, INR, and PT were higher in the death group. The proportion of patients with mild liver disease was higher in the death group (P < 0.05). In addition, we compared the baseline data of patients who died in-hospital and those who died out-of-hospital (Supplementary Table 1). The differences in age, dementia, malignant cancer, glucose, WBC, bicarbonate, calcium, PT, BMI, GCS, LODS, SOFA, and APSIII in the two groups were statistically significant (P < 0.05).
The external validation set baseline table is shown in Supplementary Table 2. Compared to the death group, the BMI, albumin, and GCS min were higher in the survival group (P < 0.05).
Feature selection
The RFE method was applied for feature selection (Figure 1), after which the most important eight features were selected. The prediction models could be built using features such as GCS min, albumin, LDH, age, ALP, BMI, platelets, and types of surgery.
Model evaluation and comparison
The prediction models were constructed using several widely used machine learning algorithms (CatBoost, RF, SVM, NN, GBM, KNN, MLP, NB, and XGBoost and LR). The ROC curve, cutoff value, Youden index, F1 score, accuracy, specificity, sensitivity, PPV, and NPV were used to evaluate the prediction model. As shown in Figure 2, CatBoost had the best predictive performance in the testing set, with an AUC of 0.737, which is better than that of the other models. In terms of the F1 index and Youden index, as well as the accuracy, the CatBoost model also exhibited excellent predictive performance in the testing set. Comparison of the AUC values of the CatBoost model with other models by DeLong test is shown in Supplementary Table 4. In both the training set and the test set, the P-values are less than 0.05, suggesting that the difference in AUC of CatBoost compared with other models is statistically significant.
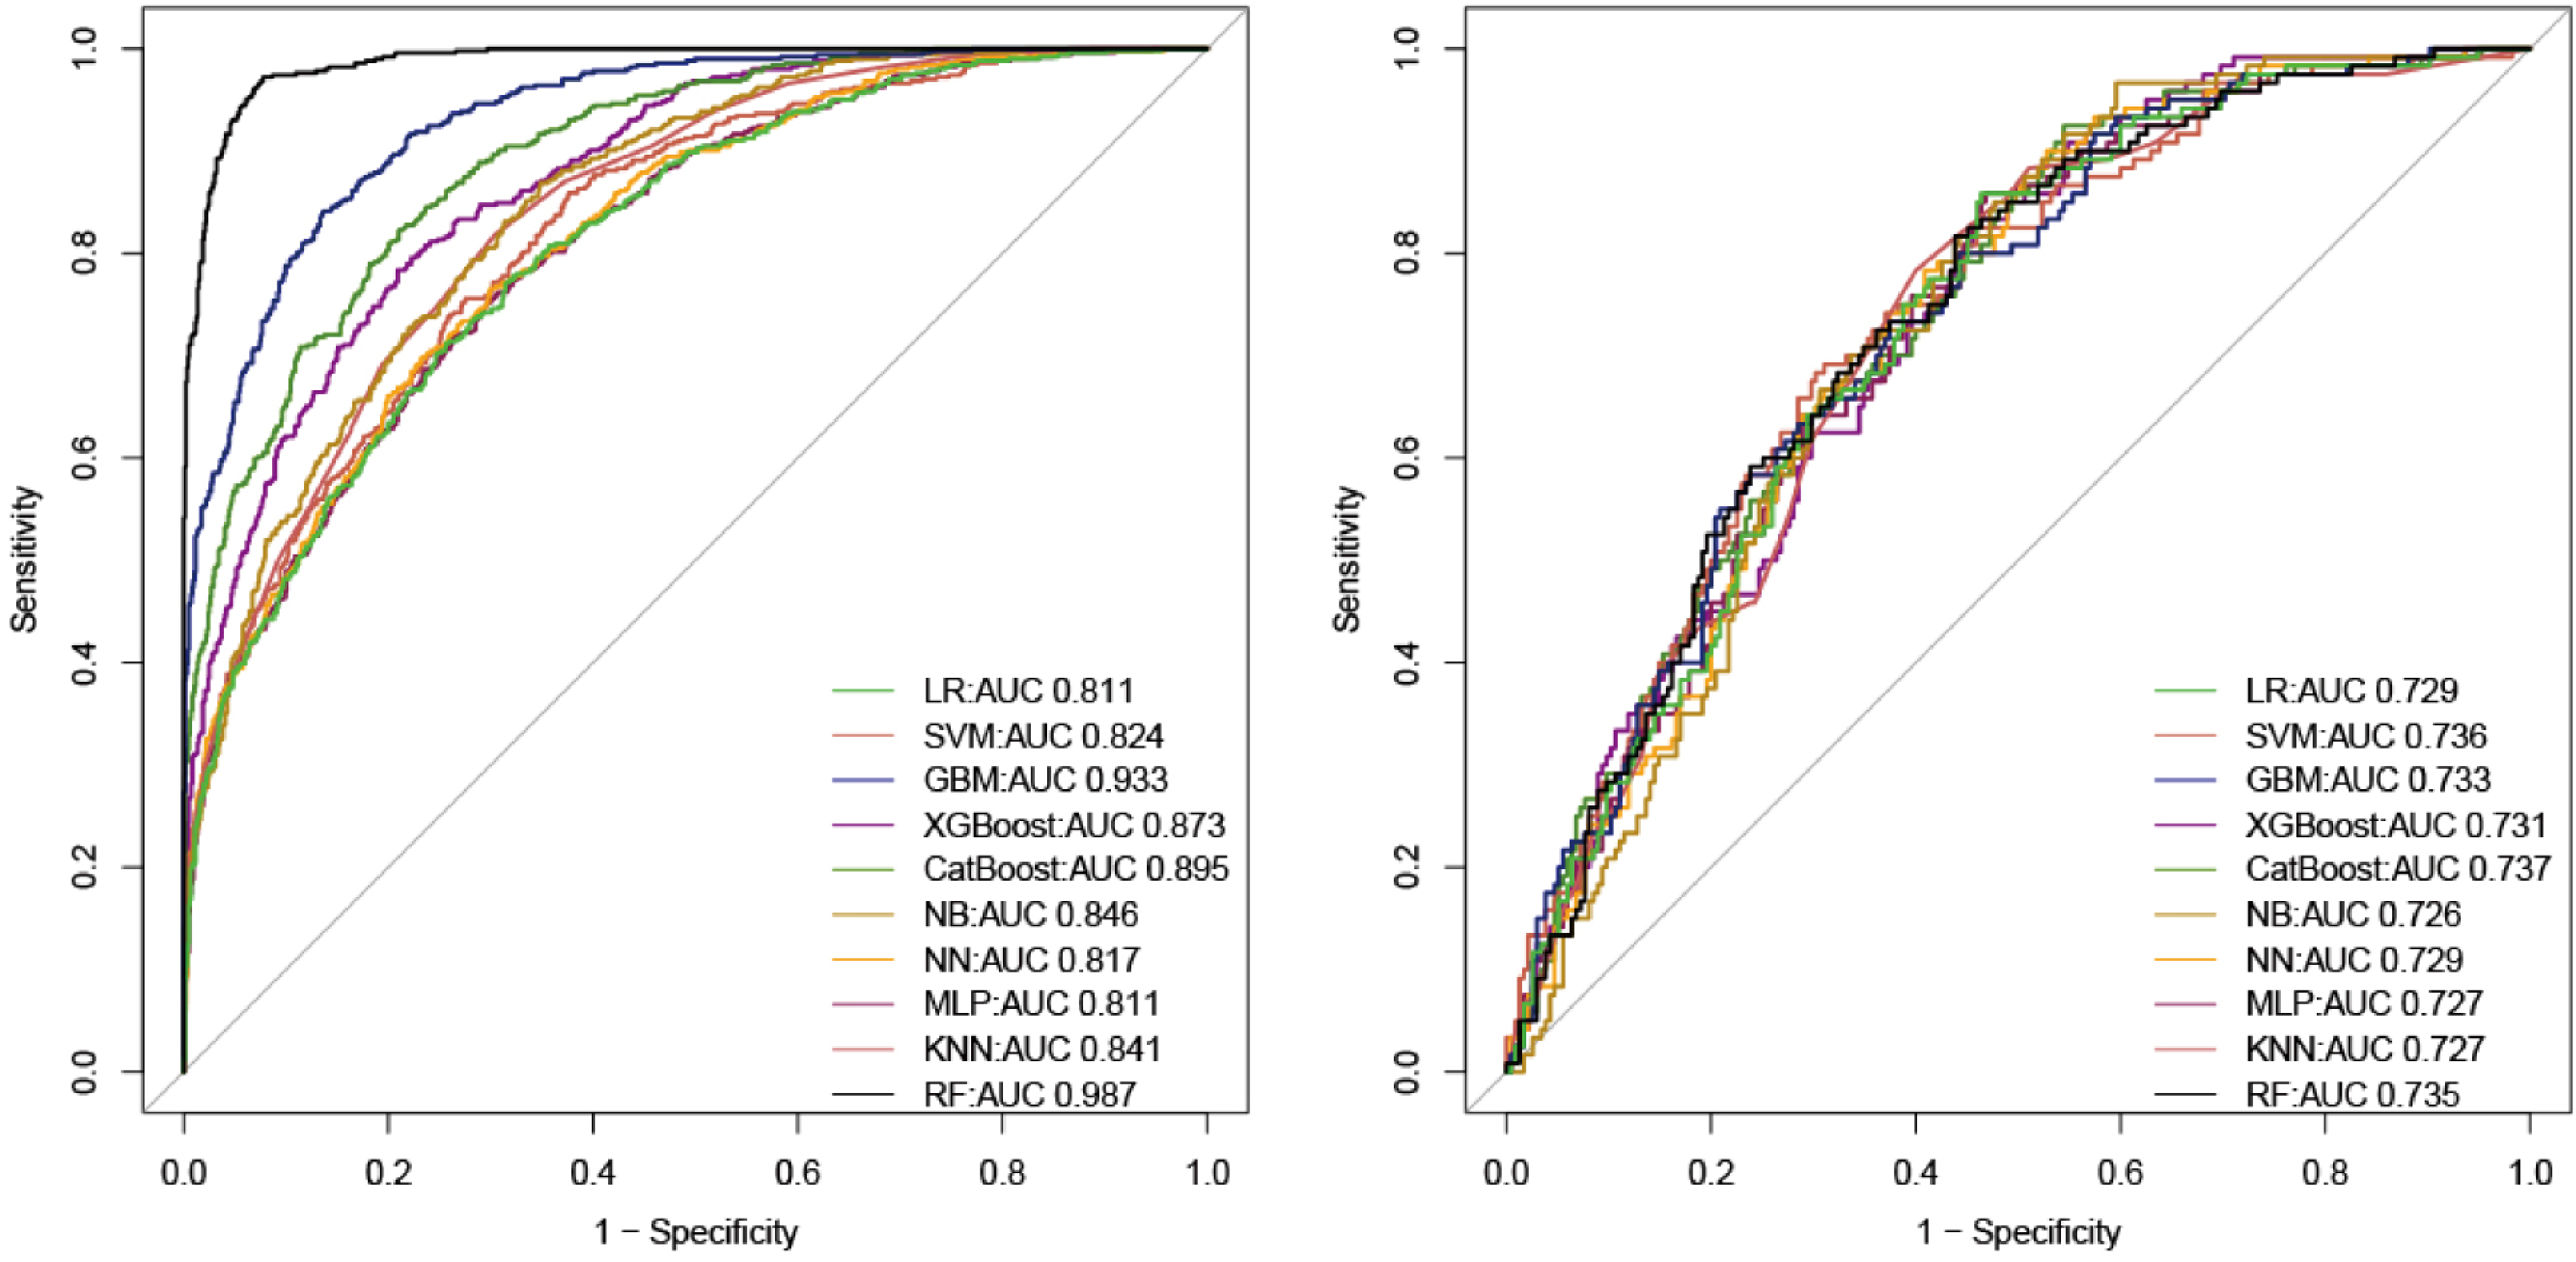
ROC curve of model. (a) AUC values of all models in the training set. (b) AUC values for all models in the testing set.
The accuracy of the CatBoost mode in the training set was 0.821, which was higher than the accuracy of the LR model. Table 2 displays all parameters of the models developed using different algorithms. The AUC value of the model in the external validation set was 0.709 (Supplementary Figure 3).
Model performance metrics in the training set and in the validation set.

In the training set, the CatBoost model had a Brier score of 0.12, and in the testing set, it had a Brier score of 0.21. When the Brier score <=0.25, the model was considered to have favorable calibration. 19 In both training and testing sets, the DCA curve indicated a net benefit and threshold probability for the CatBoost model (Figure 3(a) and (b)). According to the calibration plot (Figure 3(c) and (d)), the CatBoost model adequately predicted mortality in both training and testing sets. The DCA curves of the other models in the training sets and testing sets are shown in Supplementary Figures 7 and 8, respectively.

Assessment of CatBoost model. (a) The calibration plot of model in the training set. (b) The calibration plot of model in the testing set. (c) The DCA curve of model in the training set. (d) The DCA curve of model in the testing set.
Model interpretation
As shown in Figure 4, CatBoost analyzes an independent testing set using the Tree-Explainer class imported from Shapley additive explanation (SHAP). 20 Among the characteristics associated with the three-month mortality in elderly patients with IS admitted to the ICU, as shown in SHAP summary plots, GCS min, LDH, type, albumin, age, ALP, platelets, and BMI had the highest importance scores.

(a/b) SHAP summary plot for the eight clinical features contributing to model prediction for mortality, GCS min, LDH, type, albumin, age, ALP, platelets, and BMI. (c/d) SHAP explanation force plot for two patients from the held-out testing set of the ML model.
ML explainability results for two patients
The SHAP force plot visualizes the Shapley value, which indicates whether a prediction increases or decreases from its baseline. 21
Patient 1
Patient 1 was an elderly individual admitted to the ICU for IS. Indeed, the patient passed away on the 90th day after the admission. The factors identified by the model that contributed to the higher mortality prediction for this patient included age, LDH level, platelet count, ALP, albumin level, and GCS min score. The IML model predicting that the patient had a high risk of death, the patient's actual outcome during the 3 months of follow-up after ICU admission was death (Figure 4(c)). The SHAP plot indicates that this patient is at a high risk of poor prognosis after three months, which means a higher short-term risk of mortality. This is due to the patient's higher age, LDH levels, and lower GCS min score at the time of admission to the ICU. Specifically, the elderly the patient, the higher the risk of death (as shown in the dependent plot, Figure 5(e)). LDH levels greater than 300 were followed by a SHAP value greater than 0, indicating an increased risk of death (Figure 5(d)). A GCS min score of less than 8 was followed by a SHAP value greater than 0, also indicating an increased risk of death (Figure 5(a)).
Patient 2
This was an elderly patient admitted to the ICU because of IS. After 90 days, the patient is still alive. The ML model predicted that the patient had a low risk of death, which was correct (Figure 4(d)). Given that patient's indicators were relatively stable in the ICU, observing this result of the IS patient in the ICU is reasonable. What's more, the patient has lower levels of LDH, platelet, and age, and higher levels of GCS min score and BMI. These instructions indicate that the patient has a clearer level of consciousness, a better physical recovery state, a better nutritional status of the body, lower level of bodily nerve damage, and a lighter inflammatory state.
The contribution of the feature to the outcome
Decreased GCS min scores, BMI and albumin, increased age, LDH, ALP, platelet levels, would have a positive effect on the occurrence of outcome events (Figure 5). Figure 5 shows that the minimum GCS score of the patient was negatively correlated with the SHAP value, which is consistent with clinical practice. The clearer the consciousness of the patient, the better is condition of the patient. Higher ALP, LDH, and age result in more positive SHAP values, suggesting that higher values of ALP, LDH, or the patient's age are associated with a higher SHAP value and a greater likelihood of mortality. Higher albumin levels are associated with a smaller SHAP value, which is also consistent with clinical practice. The contribution of the features to the outcomes is shown in Supplementary Figure 1. The plots of feature importance, feature distribution, Shapley values, accumulated dependence, ceteris paribus, target versus feature, and break down are shown in Supplementary Figure 2 (example for age (A) and GCS min (B) of one positive patient) and Supplementary Web attachment.
The level of the feature corresponds to the SHAP value. (a) GCS min, (b) ALP, (c) albumin, (d) LDH, (e) age.
Model performance in different subgroups
Subgroup analyses provide more insight into the diagnostic performance of models in specific patient populations. Therefore, model performance was studied in different subgroups (age, gender). Previous studies have shown that age (≥80 years old) is a significant independent predictor of the three-month mortality, 22 so the age subgroups were divided at the 80-year mark. In the training set, the AUC values of the CatBoost model in the subgroups aged greater than 80 years old and aged between 65 and 80 years old were 0.869 and 0.886, respectively (Supplementary Figure 4(A) and (B)). In the test set, The AUC values of the CatBoost model in the subgroups aged greater than 80 years old and aged between 65 and 80 years old were 0.752 and 0.746, respectively (Supplementary Figure 4(C) and (D)).
In the training set, the AUC values of the CatBoost model in the subgroups male and female were 0.890 and 0.882, respectively (Supplementary Figure 5(A) and (B)). In the test set, The AUC values of the CatBoost model in the subgroups male and female were 0.793 and 0.743 respectively (Supplementary Figure 5(C) and (D)).
Discussion
Ischemic stroke is the most common type of stroke, predominantly affecting elderly individuals. Short-term mortality rates after stroke hospitalization are particularly high. To stratify elderly patients with IS admitted to the ICU, a death prediction model is essential and helps improve healthcare quality and clinical decision-making by early identification of high-risk patients.
This is the first interpretable machine learning prediction model for the three-month mortality in patients with IS in an ICU cohort in the United States. In addition, the influence of endovascular treatment on the occurrence of outcome events was analyzed, and the contribution of thrombectomy and thrombolysis to the occurrence of outcome events is presented in the figure.
Among the ten models used in this study, the CatBoost model demonstrated the best overall performance, followed by SVM. RF, XGBoost, LR, NN, GBM, KNN, MLP, and NB showed lower performance levels. LR is the most commonly used model to describe the relationship between a dependent variable and one or more explanatory variables. Our research shows that the LR model does not perform as well as the CatBoost model. This may be due to the imbalance in our data outcome variables and the non-linear nature of the prediction results and features. Therefore, we resampled the data and used cross-validation to adjust for overfitting. KNN can be extremely valuable in improving prediction accuracy when outcomes and interrelationships between variables may be non-linear or unknown. In this study, the performance of the KNN model was slightly worse, which may be attributed to the poor performance of the Euclidean distance metric used by KNN. The SVM model can be affected by sample imbalance, which may cause the model to be biased toward the class with a large sample number, thereby reducing the model's prediction efficiency. In this study, when the outcome event is a binary classification problem, GBM typically utilizes the Logistic Loss function and applies the sigmoid function to convert the continuous predicted value into a probability value at the final output. We dedicated a significant amount of time to the GBM model, which is a limitation of this algorithm. The performance of the RF model and the CatBoost model varies considerably, despite both being tree-based models. Although the specificity of the RF model is high, its sensitivity is low, which leads to unsatisfactory prediction results. The CatBoost model is significantly better than the RF model, demonstrating the effectiveness of the CatBoost model in identifying stroke-related deaths in the elderly. CatBoost is a comprehensive new algorithm based on gradient boosting of decision trees. Previously, the two mainstream algorithms in the Boosting family were XGBoost and LightGBM. According to official evaluations, the CatBoost model, a new addition to the Boosting family, outperforms the two algorithms mentioned above. In this study, the CatBoost model outperforms the XGBoost model. In addition, as an emerging algorithm, CatBoost has unique advantages. It can automatically handle categorical features, requires minimal hyperparameter adjustment, improves model stability, and reduces the risk of overfitting.
By analyzing demographic data, biochemical tests, ICU scores, and surgical treatment of patients, machine learning algorithms were used to fill in the missing values and extract the most important features. A total of eight features (GCS min, albumin, LDH, age, ALP, BMI, platelets, and types of surgery) were finally used for model construction. Machine learning models were used for the first time to predict the three-month mortality in elderly patients with IS admitted to the ICU, allowing the identification of critically ill elderly patients with IS earlier. We evaluated different supervised machine learning algorithms and compared them with classic LR approaches to identify the best model for predicting short-term death in elderly patients with IS. In the testing set, the prediction performance of each model was similar to its training set performance, indicating that the model was robust and generalizable. Finally, the AUC of CatBoost model used to identify patients who died was 0.737 in the testing set, better than ten models (such as the LR model with an AUC of 0.729). The CatBoost model achieved better accuracy than the traditional LR method and other machine learning methods.
Li et al. 23 analyzed 30-day stroke mortality using the MIMIC database. However, since outcomes are typically more severe in elderly individuals, models based on individuals aged 18 and older may not be directly applicable to elderly populations,8,9,22 potentially resulting in suboptimal care. What’s more we included types of surgery, which was also the feature in the final model. Additionally, we have an external dataset. Someeh et al. 24 predicted mortality in brain stroke patients. We are focusing on elderly stroke patients in the ICU and have utilized the neural network model, but NN does not perform as well as the CatBoost model. This may be because functional outcomes in survivors entering the ICU appear to be poor, especially in elderly patients. 12 The lack of interpretability of machine learning models for IS patients 25 is a major barrier and has limited clinical applications. We used the SHAP method to enhance the interpretability of the CatBoost model. The SHAP summary plot provides a global explanation of the dataset's prediction results, whereas the SHAP force plot provides an explanation of each individual patient's prediction results.
We developed a predictive model for assessing the in-hospital mortality risk for elderly IS patients admitted to the ICU and presented a user-friendly interface to improve healthcare quality and clinical decision-making by early identification of high-risk patients. Our model was better than the THRIVE score in predicting 90-day outcomes among stroke patients undergoing endovascular treatment, with an AUC of 0.709. 26 Compared with other studies, this study included the GCS score, which reflects the degree of coma in patients and can improve the effect of laboratory examination indicators in predicting the outcome of stroke patients.27,28
We found that GCS min, LDH, types of surgery, albumin, age, ALP, platelets, and BMI were tested and selected for the three-month mortality prediction model. The Glasgow Coma Scale was used to predict the 90-day mortality in patients with IS. 29 Some studies have also reported the application of GCS in predicting 30-day mortality 30 and 10-year stroke mortality. 31 Wang et al. reported that in individuals with acute ischemic stroke or transient ischemic attack, increased lactate levels are associated with adverse outcomes. 32 Albumin increases the risk of death after a stroke. 33 You et al. reported that a low platelet count upon admission was independently related to the three-month mortality and pneumonia in patients with acute IS. 34 According to Uehara et al., patients with transient ischemic attacks caused by intracranial atherosclerosis have higher serum ALP levels at admission. 35 In patients with symptomatic intracranial atherosclerosis, elevated serum ALP levels can predict early neurological decline. 35 ALP level was an independent predictor of all-cause and vascular death after ischemic or hemorrhagic stroke. 36 Among patients with IS treated with intravenous or endovascular therapy, elderly age is associated with poor outcomes. 37 Age ≥80 years is a significant independent predictor of 90-day mortality. 22 BMI has been reported to be associated with ICU.36,38 Our machine learning algorithm also underlines the significance of BMI. A higher BMI implies a better nutritional status of the body, which is more advantageous in resisting disease invasion.
This study also analyzed the correlation between each variable (GCS min, platelet, age, and albumin) and the outcome (Supplementary Figure 1). This study also analyzed the local interpretability of the CatBoost model. Taking three patients as examples, the results of feature importance, feature SHAP value, feature accumulated dependence, ceteris paribus, break down, and so on were analyzed. Interpretable machine-learning models can be viewed by clinicians through the web, making it easier for clinicians to use these models to develop treatment strategies. See Supplementary Appendix.
In routine clinical practice, when elderly ischemic stroke patients are admitted to the ICU on the first day, the model can be used to predict the mortality rate of elderly ischemic stroke patients in the ICU within three months. This model may have a positive impact on improving patient outcomes in the following ways: First, it provides individual three-month mortality risk assessments. Interpretable machine learning models can provide an intuitive understanding of patient mortality risk, including factors associated with poor prognosis within three months. The interpretability of the model makes it easier for doctors to understand the causes of mortality risk, which helps improve doctors’ understanding of the disease and enables better prevention and treatment strategies. Second, it assists in clinical decision-making and optimizing patient management. It helps provide early warning of the risk of death for elderly ischemic stroke patients with more severe conditions, enabling timely intervention measures to reduce mortality. For instance, if the model predicts a high risk of mortality for a patient, doctors can opt for a more proactive treatment plan. This plan may include more frequent monitoring, comprehensive care, or other interventions that could impact patient outcomes. Third, it improves coordination among healthcare teams. By predicting the level of risk using the model, the healthcare team can enhance their collaboration to ensure that the patient receives optimal medical and nursing care. This can help healthcare professionals rationalize the allocation of resources, allocate healthcare staff and equipment inputs according to patients’ priorities, and improve the efficiency and quality of healthcare services.
Despite their relative newness, machine learning methods outperform the currently available tools for healthcare applications. The outcomes of acute ischemic stroke have been predicted using machine learning methods with a better AUC for deep neural network models. 39 Using artificial neural networks, stroke mimics have been distinguished from strokes, and patients at high risk for TIAs and minor strokes have been identified. 40 Prediction modeling employing machine learning shows promise but requires further investigation for different applications.
There are some shortcomings in this study. Due to its retrospective observational design, selection bias could not be eliminated. The selection bias can be caused by non-participation or exclusion because of missing values in our main variables. These biases may affect the results in the following ways. Firstly, selection bias resulting from a retrospective observational design may lead to incomplete and unrepresentative samples. This implies that our sample may not be entirely representative of the entire target population, as certain groups might be more prone to exclusion, or the representativeness of the sample could be compromised due to missing data. Secondly, if certain specific types of participants are more likely to participate in the study, our estimates of these factors may favor the former, leading to biased results. This incompleteness or bias can affect the ability to generalize our findings. Validation in various populations or settings evaluates the generalizability of the findings.
Conclusions
We offer a user-friendly predictive model for the three-month mortality in elderly patients with IS admitted to the ICU. This model helps improve healthcare quality and clinical decision-making by early identification of high-risk patients. The early warning of the high risk of death for elderly ischemic stroke patients with more severe conditions provides the opportunity for early intervention to reduce mortality.
Supplemental Material
sj-zip-1-dhj-10.1177_20552076241280126 - Supplemental material for Clinical decision support systems for 3-month mortality in elderly patients admitted to ICU with ischemic stroke using interpretable machine learning
Supplemental material, sj-zip-1-dhj-10.1177_20552076241280126 for Clinical decision support systems for 3-month mortality in elderly patients admitted to ICU with ischemic stroke using interpretable machine learning by Jian Huang, Xiaozhu Liu and Wanlin Jin in DIGITAL HEALTH
Footnotes
Acknowledgments
We are grateful to the participating staff.
Contributorship
JH and WJ were responsible for the conception of the study. XL collected data. WJ and JH were responsible for the writing and revising.
Data and code availability statement
Declaration of conflicting interests
The authors declared no potential conflicts of interest with respect to the research, authorship, and/or publication of this article.
Ethical approval
The creation of the de-identified database was approved by the Massachusetts Institute of Technology (Protocol No. 0403000206) and the Institutional Review Boards of the Beth Israel Deaconess Medical Center (Protocol No. 2001-P-001699/14) and Seoul National University Hospital (H-2210-078-1368). We were granted access to these de-identified data. Our institutional ethics committees do not consider de-identified public data analysis as human research, and thus the need for ethical approval was waived.
Funding
The authors disclosed receipt of the following financial support for the research, authorship, and/or publication of this article: This work was supported by the Natural Science Foundation of Hunan Province (grant number: 2023JJ40829), the Postdoctoral Fellowship Program of CPSF under grant number GZC20242046, the China Postdoctoral Science Foundation (2024M753683), the Scientific Research Launch Project for new employees of the Second Xiangya Hospital of Central South University, and Hunan Provincial Clinical Medicine Research Center for Intelligent Management of Chronic Disease (grant number: 2023SK4042).
Guarantor
Wanlin Jin and Jian Huang.
Supplemental material
Supplemental material for this article is available online.
References
Supplementary Material
Please find the following supplemental material available below.
For Open Access articles published under a Creative Commons License, all supplemental material carries the same license as the article it is associated with.
For non-Open Access articles published, all supplemental material carries a non-exclusive license, and permission requests for re-use of supplemental material or any part of supplemental material shall be sent directly to the copyright owner as specified in the copyright notice associated with the article.