
Abstract
Objective
The study aims to develop and externally validate interpretable machine learning (ML) models for predicting 28-day mortality in critically ill patients with coexisting atrial fibrillation (AF) and acute kidney injury (AKI).
Methods
We conducted a retrospective analysis using two large public databases, Medical Information Mart for Intensive Care IV (MIMIC-IV) and eICU Collaborative Research Database (eICU-CRD). Critically ill adults with both AF and AKI were included. In MIMIC-IV, patients were randomly divided into a training set and an internal test set for model development and evaluation. Nine ML algorithms were compared, and the best-performing model was further validated in the external eICU-CRD cohort. Model performance was primarily assessed using the area under the receiver operating characteristic curve (AUC). Interpretability was examined with the SHapley Additive exPlanations (SHAP) method, and an online risk calculator was developed to support clinical application.
Results
A total of 11,510 patients from MIMIC-IV and 2565 patients from eICU-CRD were included. The GBM model achieved the best predictive performance, with an AUC of 0.856 (95% CI: 0.839–0.873) in the internal test cohort and 0.761 (95% CI: 0.740–0.783) in external validation. SHAP analysis identified anion gap, heart rate, and age as the most influential predictors of 28-day mortality. The developed online application enables individualized risk stratification, supporting clinical decision-making.
Conclusions
We developed and externally validated interpretable ML models for 28-day mortality prediction in ICU patients with AF and AKI. These models may enhance prognostic accuracy, facilitate earlier intervention, and support clinical management in this high-risk population.
Introduction
Atrial fibrillation (AF) is the most common sustained arrhythmia, affecting an estimated 30 to 50 million individuals worldwide. 1 AF is associated with serious complications, including heart failure, stroke, gastrointestinal bleeding, myocardial infarction, dementia, and sudden cardiac death.2,3 AF occurs in approximately one in six critically ill patients and is linked to adverse outcomes such as ischemic or thromboembolic events and severe bleeding. 4 In the intensive care unit (ICU), AF is frequently precipitated by systemic inflammation, sepsis, and hemodynamic instability. 5
Acute kidney injury (AKI) is also a highly prevalent complication in the ICU, affecting 20% to 50% of critically ill patients. It is associated with a strongly increased risk of short-term mortality, higher healthcare utilization, and long-term risks, including cardiovascular disease and progression to chronic kidney disease.6,7 Notably, AF and AKI often coexist in critically ill patients due to shared triggers such as systemic inflammation, hypertension, and electrolyte disturbances. The coexistence of AF and AKI amplifies mortality risk through bidirectional cardiovascular-renal interactions. AF contributes to thromboembolism and hemodynamic instability, while AKI worsens fluid overload, metabolic imbalance, and impaired drug clearance. 8
Previous studies have shown that new-onset AF in patients with AKI is independently associated with increased mortality. 9 However, management in the specific population remains challenging. Oral anticoagulants (OACs), which are fundamental for stroke prevention in AF, may contribute to anticoagulant-related nephropathy, particularly under conditions of over-anticoagulation, thereby increasing AKI risk. 10 Although OACs reduce thromboembolic events, they also raise bleeding risk, particularly in critically ill or renally impaired patients. Several studies have examined prognosis in patients with AF and AKI, but the available evidence remains limited.9,11–14 Most previous studies involved relatively small or specific clinical populations and focused on associations or risk factors rather than developing prognostic models for this population.9,11,12 In addition, these studies used conventional regression methods and rarely incorporated machine learning (ML) approaches. Direct comparisons between different prediction models and external validation in broader ICU populations were also uncommon.13,14 Although general ICU severity scores such as Sequential Organ Failure Assessment (SOFA) are widely used, they were not designed specifically for patients with AF and AKI and may not adequately capture the interaction between cardiac arrhythmias, renal dysfunction, and systemic critical illness. In addition, no dedicated prognostic model for this combined condition has been externally validated across large ICU datasets. These gaps suggest that alternative approaches may be needed to improve outcome prediction in this population.
ML has been increasingly applied in ICU research and is well suited for integrating complex, high-dimensional clinical data compared with traditional regression approaches.9,15 In patients with AF and AKI, physiological and laboratory variables often interact in nonlinear ways, whereas traditional regression models such as logistic regression rely on predefined functional forms and limited interaction structures. This may restrict their ability to fully represent the complexity of critical illness. ML approaches allow more flexible modeling of nonlinear relationships and variable interactions, which may be advantageous in the context of complex critical illness. Systematic reviews and meta-analyses in AKI prognosis have shown that ML-based models consistently outperform conventional methods, providing higher discrimination and better clinical utility. 16 Promising results have also been reported in subgroup analyses, including mortality prediction in AF and outcome prediction following myocardial infarction.17,18 Nevertheless, the prognostic performance of ML in ICU patients with coexisting AF and AKI has not been well established.
To address this gap, we used data from two independent ICU cohorts, including Medical Information Mart for Intensive Care IV (MIMIC-IV) and the eICU Collaborative Research Database (eICU-CRD), to develop and externally validate interpretable ML models for predicting 28-day mortality in patients with AF and AKI.
Methods
Data source
Data were obtained from two publicly accessible critical care databases: MIMIC-IV (version 3.1) and eICU-CRD (version 2.0). The training cohort was derived from the MIMIC-IV database, which contains data from over 70,000 adult patients admitted to Beth Israel Deaconess Medical Center between 2008 and 2019. 19 The external validation cohort was derived from the eICU-CRD database, which includes clinical data from 208 U.S. hospitals, comprising more than 200,000 intensive care unit admissions from 2014 to 2015. Both databases were approved by the Institutional Review Board of the Massachusetts Institute of Technology. The corresponding author (Meixiang Wang) obtained access to both databases and was responsible for data extraction (Certification Number: 14678768).
Study population and outcome
In the study, we included adult ICU patients with AF and AKI at their first ICU admission. The exclusion criteria were as follows: (1) participants aged <18 years; (2) length of ICU stay <24 hours. The selection of participants is displayed in Figure 1. The diagnosis of AKI was defined as meeting at least one of Kidney Disease: Improving Global Outcomes (KDIGO) criteria: an increase in serum creatinine of ≥1.5 times the baseline within 7 days, an increase in creatinine of ≥0.3 mg/dL within 48 hours or a urine volume of <0.5 mL/kg/hour within 6 hours. 20 Baseline serum creatinine was determined using a hierarchical approach. When pre-admission baseline creatinine was available, it was used preferentially. If unavailable, the most recent creatinine value prior to ICU admission during the same hospitalization was used. If this was also unavailable, the lowest creatinine value within the first 48 hours of ICU stay was used as a surrogate baseline. AF was identified using ICD-9 code 427.31 or ICD-10 code I48. AF phenotypes (new-onset or chronic AF) were not further subclassified due to the absence of standardized longitudinal rhythm history in the dataset. The primary outcome in the study was 28-day in-hospital mortality for patients admitted to the ICU.

Flowchart of patient selection and cohort construction.
Data extraction and feature selection
Extracted data included demographic characteristics, vital signs, laboratory results, SOFA scores, Glasgow Coma Scale (GCS), comorbidities, and ICU length of stay (LOS). Demographics encompassed age, sex, and weight. Vital signs comprised heart rate (HR), mean arterial blood pressure (MBP), respiratory rate (RR), and body temperature. Laboratory indices included hemoglobin (Hb), white blood cell (WBC), red blood cell distribution width (RDW), platelet (PLT), anion gap (AG), blood urea nitrogen (BUN), creatinine, glucose (GLU), sodium (Na), potassium (K), calcium (Ca), chloride (Cl), and international normalized ratio (INR). Comorbidities considered were hypertension, diabetes mellitus, heart failure (HF), acute myocardial infarction (AMI), chronic kidney disease (CKD), chronic obstructive pulmonary disease (COPD), and liver cirrhosis (LC).
To minimize bias due to missing data, variables with ≥30% missingness were excluded, while those with <30% missingness were imputed using the random forest multiple imputation method. Missing data details are presented in Supplementary Table 1. To evaluate the potential impact of imputation, we compared the distributions of key variables before and after imputation using standardized mean differences (Supplementary Tables 2–3). Multicollinearity was assessed using the variance inflation factor (Supplementary Table 4). Feature selection was subsequently performed using the least absolute shrinkage and selection operator (LASSO) algorithm. The penalty parameter λ was determined through 10-fold cross-validation, and the final λ was chosen according to the 1-standard error (1-SE) rule to favor a simpler feature set and improve model stability.
Model development and validation
The MIMIC-IV dataset was randomly partitioned into a training cohort (70%) and an internal test cohort (30%). The eICU-CRD dataset served as an external validation cohort. To address class imbalance, the Synthetic Minority Over-sampling Technique (SMOTE) was applied to the training cohort only. SMOTE was selected to address class imbalance while retaining information from the majority class, which is important in clinical datasets where variables often interact in complex ways. 21 The class distributions before and after SMOTE are presented in Supplementary Table 5. To examine whether SMOTE substantially altered the overall data structure, we additionally compared the distributions of key clinical variables before and after resampling (Supplementary Table 6). Nine ML models were constructed: Logistic Regression (LR), Support Vector Machine (SVM), Gradient Boosting Machine (GBM), Neural Network (NN), Random Forest (RF), Extreme Gradient Boosting (XGBoost), Adaptive Boosting (AdaBoost), and Light Gradient Boosting Machine (LightGBM). LR was considered a baseline model, while hyperparameters for the remaining models were optimized through grid search with 10-fold cross-validation. Model performance was primarily evaluated using the area under the receiver operating characteristic curve (AUC), with secondary metrics including sensitivity, specificity, accuracy, and Youden's index. Performance was further validated in both the test set and the external validation cohort. Calibration curves and decision curve analyses (DCA) were employed to assess clinical applicability. The final model was selected primarily based on discrimination measured by AUC. Threshold-dependent metrics, including sensitivity, specificity, and the Youden index, were also considered to reflect clinically relevant model performance.
The model development process followed a structured workflow consistent with the Cross-Industry Standard Process for Data Mining (CRISP-DM) framework, encompassing problem definition, data understanding, data preprocessing, model development, evaluation, and clinical deployment.
Model interpretability and online application
Given the “black box” nature of ML models, interpretability was enhanced using the SHapley Additive exPlanations (SHAP) framework. 22 SHAP values were employed to visualize the contribution of each feature and summarize their importance to predictive outcomes. Additionally, an online risk stratification tool was developed using the Shiny platform to facilitate clinical application.
Statistical analysis
Continuous variables were expressed as means with standard deviations (SDs) or medians with interquartile ranges (IQRs), depending on distribution. Categorical variables were presented as counts and percentages. Comparisons were conducted using the Mann–Whitney U test for continuous variables and Pearson's chi-square test for categorical variables. A two-tailed P value <.05 was considered statistically significant. All statistical analyses were performed using R (version 4.4.1).
Results
Baseline characteristics
The study ultimately comprised 11510 participants with AF and AKI in the MIMIC-IV dataset and 2565 participants in the eICU-CRD dataset. Overall, 28-day in-hospital mortality occurred in 2380 individuals (16.9%). Baseline characteristics of the study population were displayed in Table 1.
Clinical characteristics of the training and validation cohort.

Continuous variables are presented as mean ± standard deviation or median (interquartile range), depending on data distribution. Categorical variables are expressed as counts and percentages. Comparisons between survivors and non-survivors were performed using the Mann–Whitney U test for continuous variables and Pearson's chi-square test for categorical variables.
AMI: acute myocardial infarction; CKD: chronic kidney disease; COPD: chronic obstructive pulmonary disease; LOS: length of stay; ICU: intensive care unit; Hb: hemoglobin; RDW: red blood cell distribution width; WBC: white blood cell; PLT: platelet; Na: sodium; Ca: calcium; K: potassium; Cl: chloride; BUN: blood urea nitrogen; INR: international normalized ratio; HR: heart rate; MBP: mean arterial blood pressure; RR: respiratory rate; SOFA: Sequential Organ Failure Assessment; GCS: Glasgow Coma Scale.
In the MIMIC-IV training and test cohorts, 1791 patients (15.6%) died within 28 days of ICU admission. Non-survivors were significantly older than survivors (mean age: 77.4 vs. 74.3 years, P < .001). Males comprised 61.9% of survivors and 56.0% of non-survivors. The median ICU length of stay (LOS) was longer among non-survivors (4.4 days, IQR: 2.3–8.4) compared with survivors (3.1 days, IQR: 1.8–5.5).
In the eICU-CRD external validation cohort, the mean age was 72.8 years for survivors and 74.8 years for non-survivors. The sex distribution did not differ significantly between groups. However, non-survivors had a longer ICU LOS compared with survivors (median 4.8 vs. 4.0 days, P = .019).
Model development and validation
In feature selection, the LASSO regression was employed and identified 22 key prediction variables, including age, sex, weight, LOS in ICU, diabetes, HF, CKD, COPD, liver cirrhosis, Hb min, WBC max, PLT min, RDW max, Ca max, Na max, AG max, BUN max, creatinine max, HR mean, MBP mean, temperature mean, and SOFA score. The process of feature selection through the LASSO algorithm was depicted in Supplementary Figure 1.
In the 10-fold cross-validation of the training cohort, the AUC values for LR, SVM, GBM, NN, RF, XGBoost, AdaBoost, LightGBM, and CatBoost were 0.799, 0.862, 0.888, 0.796, 0.849, 0.870, 0.864, 0.882, and 0.858, respectively (Figure 2). Among these, GBM demonstrated the highest AUC and also showed superior performance across other evaluation metrics (Supplementary Table 7). Consequently, GBM was selected as the optimal prediction model for further evaluation.

Comparison of model discrimination performance.
In the test cohort, GBM achieved an AUC of 0.856 (95% CI: 0.839–0.873), outperforming the other models. In the external validation cohort (eICU-CRD), GBM also showed the best generalization ability, with an AUC of 0.761 (95% CI: 0.740–0.783). Additional evaluation metrics, including specificity, sensitivity, accuracy, and Youden index for all models in both cohorts, are presented in the Supplementary Table 7. Decision curve analysis (DCA) demonstrated that the GBM model yielded a favorable net benefit across a wide range of threshold probabilities (Figure 3). Calibration performance showed good agreement between predicted and observed probabilities, as demonstrated by both calibration curves (Supplementary Figure 2) and quantitative calibration metrics (Supplementary Table 8). In the external validation cohort, the GBM model showed a calibration intercept of −0.008 and slope of 0.891, with a Brier score of 0.1477 and low ECE, suggesting reasonable agreement between predicted and observed risks.
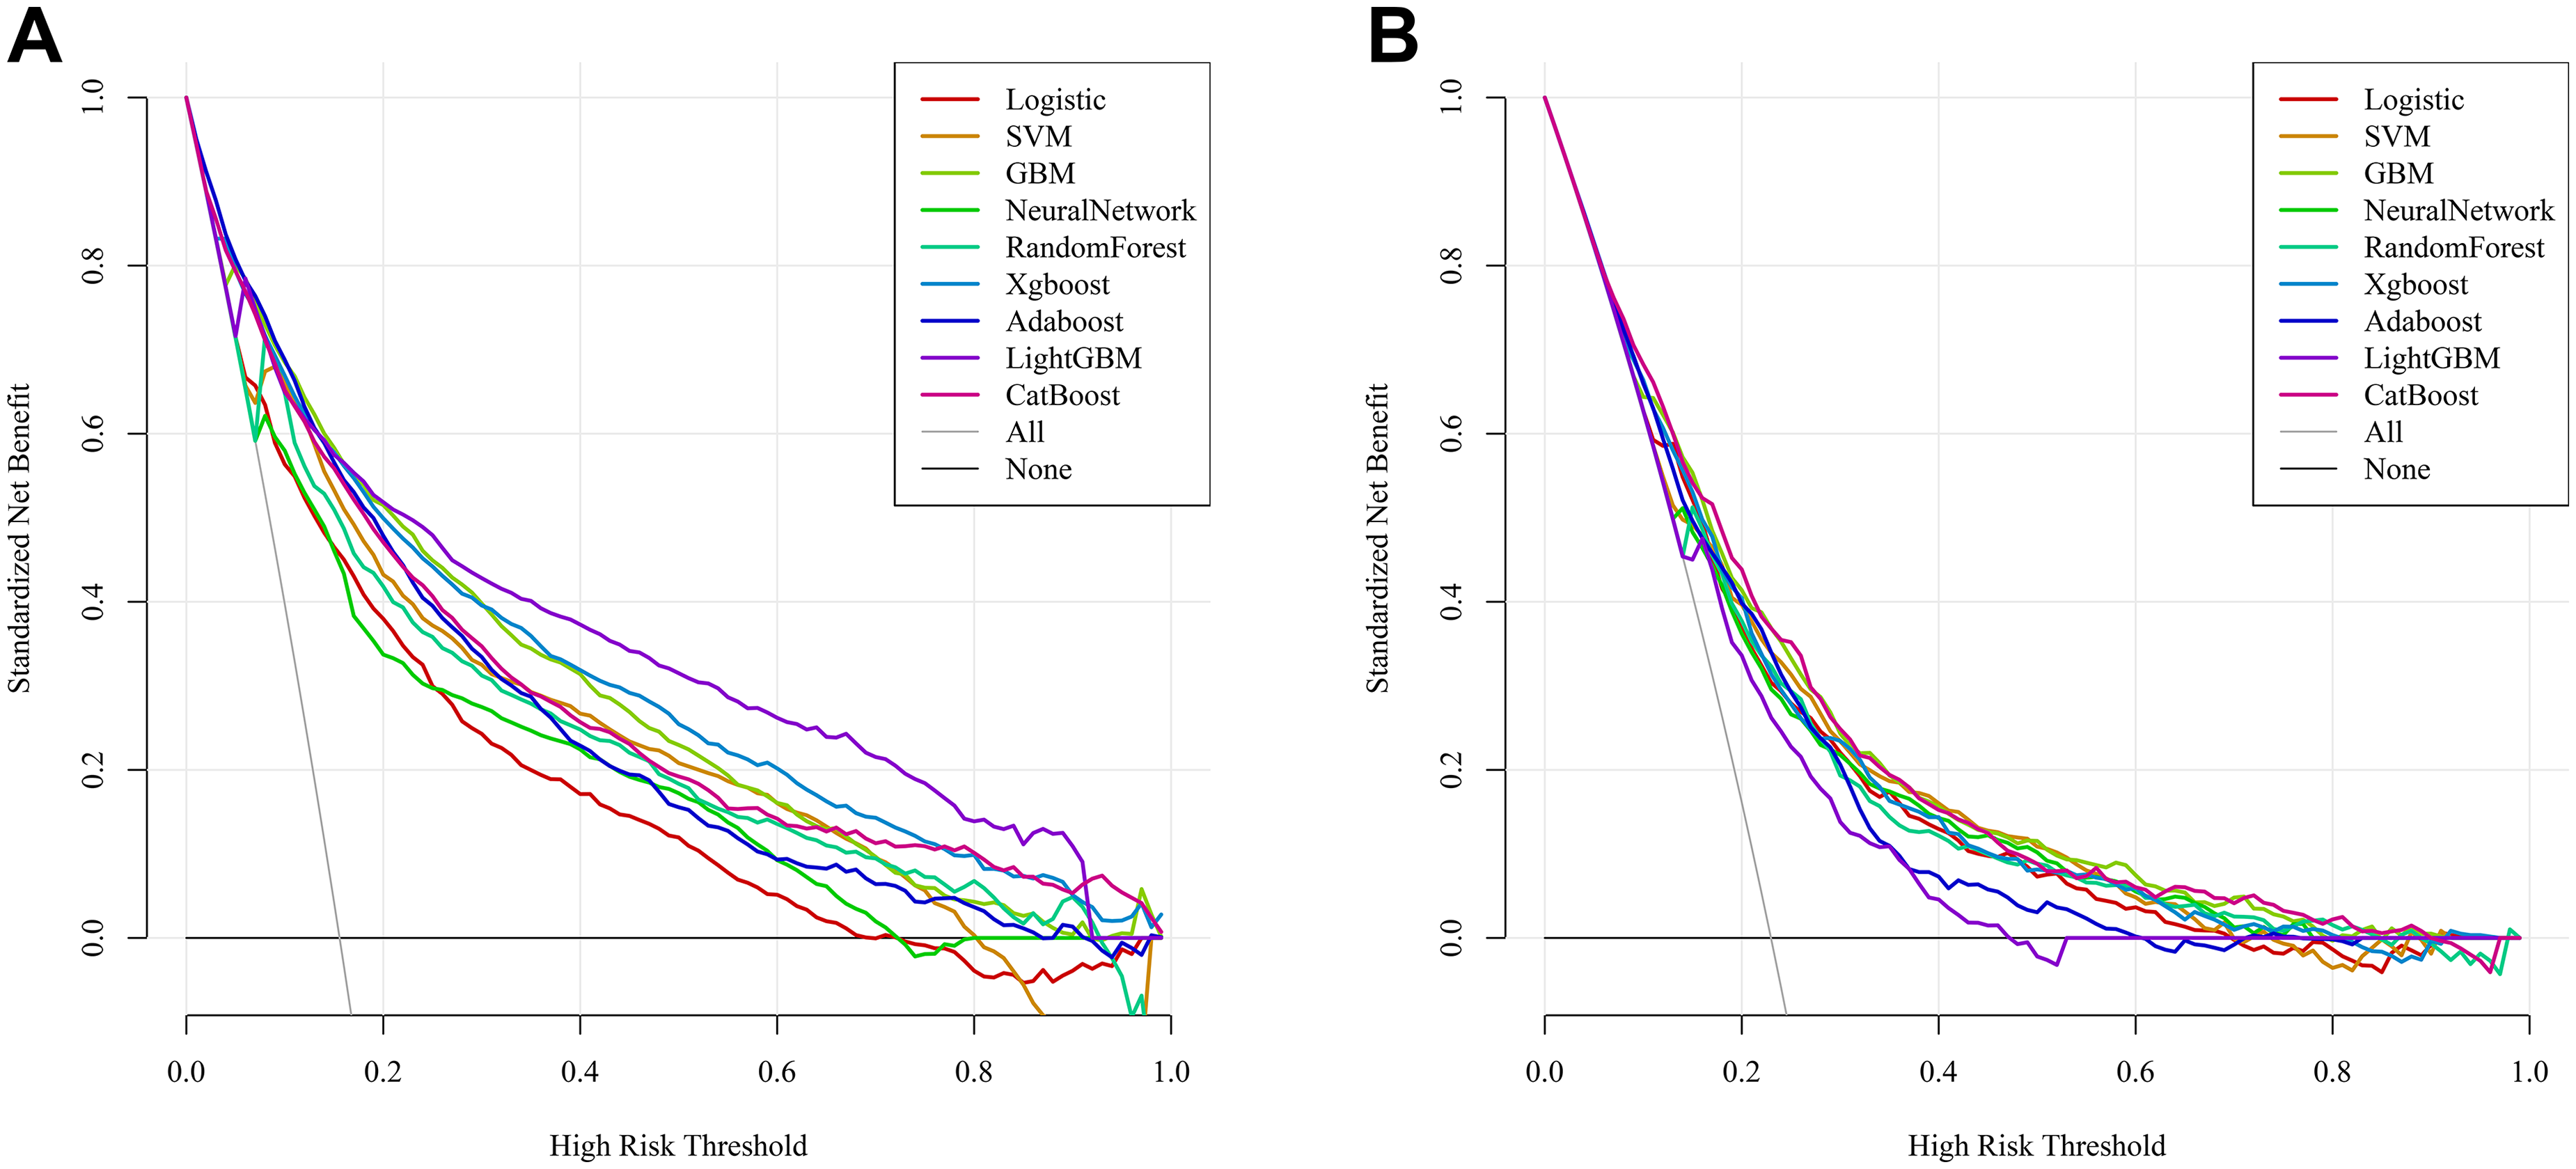
Decision curve analysis of the prediction models.
In addition, a SOFA-only logistic regression model was evaluated as a conventional clinical score comparator. The GBM model showed consistently better discrimination than SOFA across the training, internal validation, and external validation cohorts (Supplementary Figure 3 and Supplementary Table 9).
Sensitivity analyses excluding patients with AG >30 mmol/L, HR >150 bpm, or HR <40 bpm showed minimal changes in AUC and other discrimination metrics across cohorts, indicating that model performance was not driven by extreme values (Supplementary Table 10).
Model interpretability and online application
Based on the SHAP algorithm, the interpretability analysis was performed to assess the contribution of each feature in the GBM prediction model. The SHAP beeswarm plot displayed the association between features values and the predicted outcome (Figure 4). The max AG, age, and mean HR were all positively related to the 28-day mortality risk. Figure 5a demonstrated the importance of various factors, of which max AG, mean HR, and age displayed the most predictive power. Additionally, we used a SHAP waterfall plot to explain why the model predicted low risk in a patient. Most features, including a lower AG value, younger age, and relatively favorable laboratory indices, contributed negatively to the predicted risk, while Ca slightly increased it, leading to an overall low predicted probability (Figure 5b). SHAP analyses repeated after excluding extreme AG and HR values yielded similar feature rankings and distribution patterns, suggesting stable model interpretability (Supplementary Figures 4–6).

SHAP summary plot of the GBM model.

SHAP-based model interpretability.
To facilitate clinical practice and decision-making, we developed an online website based on the GBM model (https://jh139689.shinyapps.io/aki-af/), enabling individualized prediction of 28-day mortality for patients with AF and AKI (Supplementary Figure 2). The web application implements the final GBM model without retraining. Therefore, its predicted probabilities correspond to those evaluated in the external validation cohort. Calibration performance in the eICU-CRD dataset is shown in Supplementary Table 5.
Discussion
In this study, we developed and externally validated ML models to predict 28-day in-hospital mortality among critically ill adult patients with coexisting AF and AKI, using two large critical care databases, MIMIC-IV and eICU-CRD. Among 9 algorithms, the GBM model demonstrated the highest predictive performance, achieving an AUC of 0.856 in the internal test set and 0.761 in the external validation cohort. The lower discrimination in the external cohort may reflect differences in case mix and data structure between databases. Calibration remained acceptable (slope: 0.890, intercept: −0.008), indicating that predicted risks were generally consistent with observed outcomes. Model interpretability was examined using the SHAP algorithm, which identified AG, HR, and age as the most influential predictors. To promote potential clinical application, we further deployed an online application for individualized risk stratification.
Few previous studies have specifically addressed outcomes in patients with concurrent AF and AKI, although both conditions independently confer a poor prognosis. AKI represents one of the most prevalent and severe ICU complications, and even mild episodes are strongly associated with increased mortality. Chen et al. reported that ICU patients who developed AKI had an in-hospital mortality of 23.5% compared with 4.9% in those without AKI. 23 AF similarly worsens outcomes by increasing hemodynamic instability and complicating anticoagulation management. In septic patients, new-onset AF has been recognized as an independent predictor of death and stroke. 24 More recent ICU studies have also shown that AF in critically ill patients is associated with increased short-term and long-term mortality, while AKI remains a strong predictor of adverse outcomes.4,25 However, most of these studies evaluate AF or AKI separately rather than their coexistence, and dedicated prognostic tools for patients with both conditions remain scarce. The present findings demonstrate that the coexistence of AF and AKI substantially magnifies short-term mortality risk, functioning as a synergistic “double hit” to cardiovascular and renal stability. This is consistent with a registry study showing that AF patients who subsequently developed AKI had markedly worse outcomes. 26 Likewise, in a multicenter cohort of critically ill AKI patients undergoing renal replacement therapy, new-onset AF prior to initiation was associated with significantly higher one-year mortality. 9 Collectively, these observations underscore the need for reliable prognostic tools tailored to this high-risk subgroup.
In this context, the present ML models demonstrated robust prognostic performance across both derivation and external validation cohorts. The AUC values are comparable to those reported in other contemporary ICU mortality prediction studies. Lim et al. described an ensemble model with AUCs of 0.87 to 0.89 across MIMIC-IV, eICU-CRD, and a European ICU cohort. 27 Similarly, Thorsen-Meyer et al. reported a dynamic deep learning model that achieved AUROCs up to 0.88 when predicting mortality over time. 28 These parallels support the credibility and generalizability of our results. Importantly, they also demonstrate that ML approaches built for clinically defined subgroups may provide superior prognostic accuracy compared with conventional severity scores. For clinicians, refined risk prediction in AF with AKI may inform earlier therapeutic escalation, judicious de-escalation, and timelier interventions to mitigate adverse outcomes.
The interpretability analysis supported the clinical plausibility of the model. AG, HR, and age consistently ranked as the most influential predictors. Elevated AG is a bedside signal of metabolic acidosis and impaired buffering capacity, which often accompanies tissue hypoperfusion, mitochondrial dysfunction, and systemic inflammation in critical illness. These conditions are associated with organ dysfunction and worse outcomes in critically ill patients.29,30 HR is also a clinically coherent predictor. In patients with AF, sustained tachycardia reduces diastolic filling time and coronary perfusion while increasing myocardial oxygen demand. This can impair effective cardiac output and renal perfusion, contributing to worsening kidney function. 31 These factors provide a plausible link between higher HR and mortality. 32 Advanced age reflects reduced physiological reserve and increased vulnerability to acute circulatory stress. 33 As a result, elderly patients are more susceptible to organ dysfunction and death during critical illness. 34 Together, these variables capture important aspects of illness severity and vulnerability in patients with AF and AKI.
This study has several strengths. To our knowledge, it is among the first to focus explicitly on mortality prediction in patients with both AF and AKI, thereby addressing a clinically relevant but previously neglected subgroup. We employed two large and complementary databases, which enabled both model derivation and multicenter validation, enhancing generalizability. This strategy also addresses the common limitation of ICU ML studies that lack external validation. Furthermore, by integrating SHAP-based interpretability and providing an online risk calculator website, we advanced beyond statistical prediction alone and offered a potentially actionable tool for clinical decision-making. In practice, predicted risk estimates may help clinicians recognize patients who warrant closer surveillance, earlier specialist involvement, or more proactive management of hemodynamic and metabolic disturbances. Risk stratification may also inform decisions regarding the intensity of monitoring and supportive care in patients with unstable cardiac rhythm and renal dysfunction. 35 In settings with constrained ICU resources, individualized risk estimates may assist in prioritizing monitoring attention and care intensity. 36 Quantified risk information may also support communication with families regarding prognosis in complex cases. Importantly, the model is intended to complement, not replace, clinical judgment. Similar nationwide healthcare data studies have underscored the importance of systematic data cleaning and preprocessing in real-world data research.37–39 Although these studies addressed different clinical topics, they reflect comparable real-world data workflows to those used in the present analysis.
Several limitations should also be acknowledged. First, the retrospective design and reliance on electronic health record data introduce potential residual confounding. Some treatment-related variables were not consistently available in structured form, including anticoagulation strategies, timing of renal replacement therapy, rhythm control interventions, and fluid management. These factors may have influenced outcomes but could not be included in the model. Second, AF phenotypes (new-onset or chronic AF) were not distinguished. AF was identified using ICD codes during ICU admission, and the databases lack standardized longitudinal rhythm history needed for reliable classification. As new-onset AF may reflect acute physiological stress whereas chronic AF may be associated with underlying comorbidity burden, this could introduce clinical heterogeneity. Future studies incorporating longitudinal clinical records and rhythm monitoring may allow phenotype-specific analyses and more precise risk stratification. Additionally, the definition of AKI may include cases of acute-on-chronic kidney disease because baseline creatinine data prior to ICU admission were sometimes unavailable, despite the hierarchical approach used to assign baseline values. Furthermore, although most predictors had low missingness in the MIMIC-IV training cohort, some variables exhibited higher missing rates in the external validation cohort. This may affect model transportability when applied to datasets with different patterns of data completeness. Third, we selected features measured during the first 24 hours of ICU admission. Future work should explore dynamic or sequential modeling that incorporates longitudinal signals and therapeutic interventions. Finally, although external validation was performed, both cohorts were derived from U.S.-based ICU databases. Differences in patient case mix, ethnic composition, healthcare systems, and clinical practice patterns across regions may influence baseline risk and the distribution of clinical variables. As with most prediction models, performance may vary when applied to populations with different characteristics. Therefore, additional validation in cohorts from other regions, such as Europe and Asia, would be valuable to further assess generalizability and determine whether any recalibration is needed before broader clinical implementation.
Conclusion
We developed and externally validated interpretable ML models for 28-day mortality prediction in ICU patients with AF and AKI. These models may enhance prognostic accuracy, facilitate earlier intervention, and support clinical management in this high-risk population.
Supplemental Material
sj-docx-1-dhj-10.1177_20552076261433081 - Supplemental material for Interpretable machine learning prediction models for 28-day mortality in critically ill patients with atrial fibrillation and acute kidney injury
Supplemental material, sj-docx-1-dhj-10.1177_20552076261433081 for Interpretable machine learning prediction models for 28-day mortality in critically ill patients with atrial fibrillation and acute kidney injury by Linlin Gao, Aili Yuan and Meixiang Wang in DIGITAL HEALTH
Footnotes
Ethics approval and consent to participate
The MIMIC-IV and eICU-CRD databases are de-identified, publicly available databases, which were approved by the Institutional Review Board of the Massachusetts Institute of Technology and compliant with the Health Insurance Portability and Accountability Act (HIPAA) regulations. Therefore, informed consent was waived.
Author contributions
Linlin Gao: Writing–original draft preparation, conceptualization, methodology, visualization, validation, and software. Aili Yuan: Writing–original draft preparation and software. Meixiang Wang: Writing–reviewing and editing, data curation, writing-original draft preparation, supervision, and investigation.
Funding
The authors received no financial support for the research, authorship, and/or publication of this article.
Declaration of conflicting interests
The authors declared no potential conflicts of interest with respect to the research, authorship, and/or publication of this article.
Data availability statement
Publicly available datasets were analyzed in this study. Data are available from the Medical Information Mart for Intensive Care IV (MIMIC-IV) v3.1 database (https://physionet.org/content/mimiciv/3.1/) and from the eICU Collaborative Research Database (eICU-CRD) v2.0 database (![]() ).
).
Supplemental material
Supplemental material for this article is available online.
References
Supplementary Material
Please find the following supplemental material available below.
For Open Access articles published under a Creative Commons License, all supplemental material carries the same license as the article it is associated with.
For non-Open Access articles published, all supplemental material carries a non-exclusive license, and permission requests for re-use of supplemental material or any part of supplemental material shall be sent directly to the copyright owner as specified in the copyright notice associated with the article.