
Abstract
Objective
A ballistocardiogram (BCG) is a vibration signal generated by the ejection of the blood in each cardiac cycle. The BCG has significant variability in amplitude, temporal aspects, and the deficiency of waveform components, attributed to individual differences, instantaneous heart rate, and the posture of the person being measured. This variability may make methods of extracting J-waves, the most distinct components of BCG less generalizable so that the J-waves could not be precisely localized, and further analysis is difficult. This study is dedicated to solving the variability of BCG to achieve accurate feature extraction.
Methods
Inspired by the generation mechanism of the BCG, we proposed an original method based on a profile of second-order derivative of BCG waveform (2ndD-P) to capture the nature of vibration and solve the variability, thereby accurately localizing the components especially when the J-wave is not prominent.
Results
In this study, 51 recordings of resting state and 11 recordings of high-heart-rate from 24 participants were used to validate the algorithm. Each recording lasts about 3 min. For resting state data, the sensitivity and positive predictivity of proposed method are: 98.29% and 98.64%, respectively. For high-heart-rate data, the proposed method achieved a performance comparable to those of low-heart-rate: 97.14% and 99.01% for sensitivity and positive predictivity, respectively.
Conclusion
Our proposed method can detect the peaks of the J-wave more accurately than conventional extraction methods, under the presence of different types of variability. Higher performance was achieved for BCG with non-prominent J-waves, in both low- and high-heart-rate cases.
Introduction
A ballistocardiogram (BCG) is a vibration signal generated by the ejection of blood in each cardiac cycle 1 and can be used to monitor the cardiovascular system. 2 Several studies have shown that BCGs can be used for monitoring the cardiac system, 3 cardiovascular diagnosis,4,5 and sleep monitoring. 6 BCGs can be collected using mechanical sensors, such as piezoelectric sheet sensor 7 and accelerometers. 8 Compared to piezoelectric sheet sensors, the measurement of BCG using accelerometer mostly requires the user to wear the sensor, for instance, in the form of a wristwatch. 9 The piezoelectric sheet sensor generates voltage by vibration or bending, therefore the BCG signal collected is vibration displacement. Since this type of BCG sensors can be integrated with furniture, such as chair cushions and mattresses, to monitor BCG signals in daily life, such that users are not required to wear any sensors, it does not impose additional burden on users, which makes it easier to use in non-clinical daily life environments. Therefore, it is very practical to use piezoelectric sheet sensor to measure BCG to realize some applications and this study focuses on BCG collected by piezoelectric sheet sensor.
Many applications based on the BCG require the precise extraction of its various components. As shown in Figure 1, a standard BCG waveform is characterized by distinct components labeled as H, I, J, K, and L waves. The IJK wave group are considered to originate during the systolic period of the heart. These waves, in conjunction with H and L waves, create a pattern notably resembling the letter “W” representing the most identifiable group of features within the BCG waveform. 2 In some applications of BCGs, information regarding the feature components is critical. For example, in Ref. 10 , the difference in amplitude between the I-J and J-K segments was an important parameter for estimating blood pressure.

Example of a standard BCG from piezoelectric sheet sensor using in this research.
In this field, the J-wave tends to be the most prominent component in the BCG, and after obtaining the location of the peak of J-wave, information on other BCG components is easy to obtain. 11 Thus, researchers have focused on methods of accurately extracting J-waves. 12 However, owing to the significant variability of the BCG waveforms, many J-wave-extraction methods have limitations.
Because the J-wave is the most prominent component generally, several methods have been proposed. The simplest method of detecting J-waves is to use a threshold that is computed automatically using a heart rate (HR) algorithm. 13 Some studies have used the length transform on the BCG and then search for local maxima to detect J-waves. 14 Additionally, the short-time energy (STE) of the BCG can be used to detect J-waves. 15 However, owing to waveform variability, the J-wave is not necessarily the most prominent component. Therefore, these methods are less effective in certain scenarios. Researchers have also used pattern recognition-based methods to seek similar components in each heartbeat cycle to accurately determine the HR. 16 These methods attempt to circumvent the discussion of BCG waveform variability; therefore, it is not certain whether the observed component is the J-wave. Recently, some researchers have used neural networks (NNs).17–19 However, NNs require training with a large amount of data, and even if there are enough data, there may still be the problem of imbalanced dataset. This may lead to biased learning of NNs. Moreover, the BCG variability has not been the focus of those studies. Even if the variability problem could be partially resolved relying on the generality of NNs, however, their explainability is the problem.
According to existing literatures and experimental observations, there are three main types of BCG waveform variability. The first is the variability in the relative amplitude (Va).20–22 As shown in Figure 2, the relative amplitude of the different components is likely to be different for different individuals. Even for the same individual, posture can affect the waveform. In some cases, the J-wave is not the most prominent component. The second is the variability in the time of component occurrence (Vt). 23 Each heartbeat is not exactly the same; therefore, differences would also occur in the timing of the occurrence of the components of the BCG. The third is the variability in the deficiency of the waveform components (Vd). As the HR increases, the components of the BCG become aliased and occasionally indistinguishable.16,17 Moreover, some cardiovascular diseases may also cause changes in the heartbeat, resulting in this variability. 24
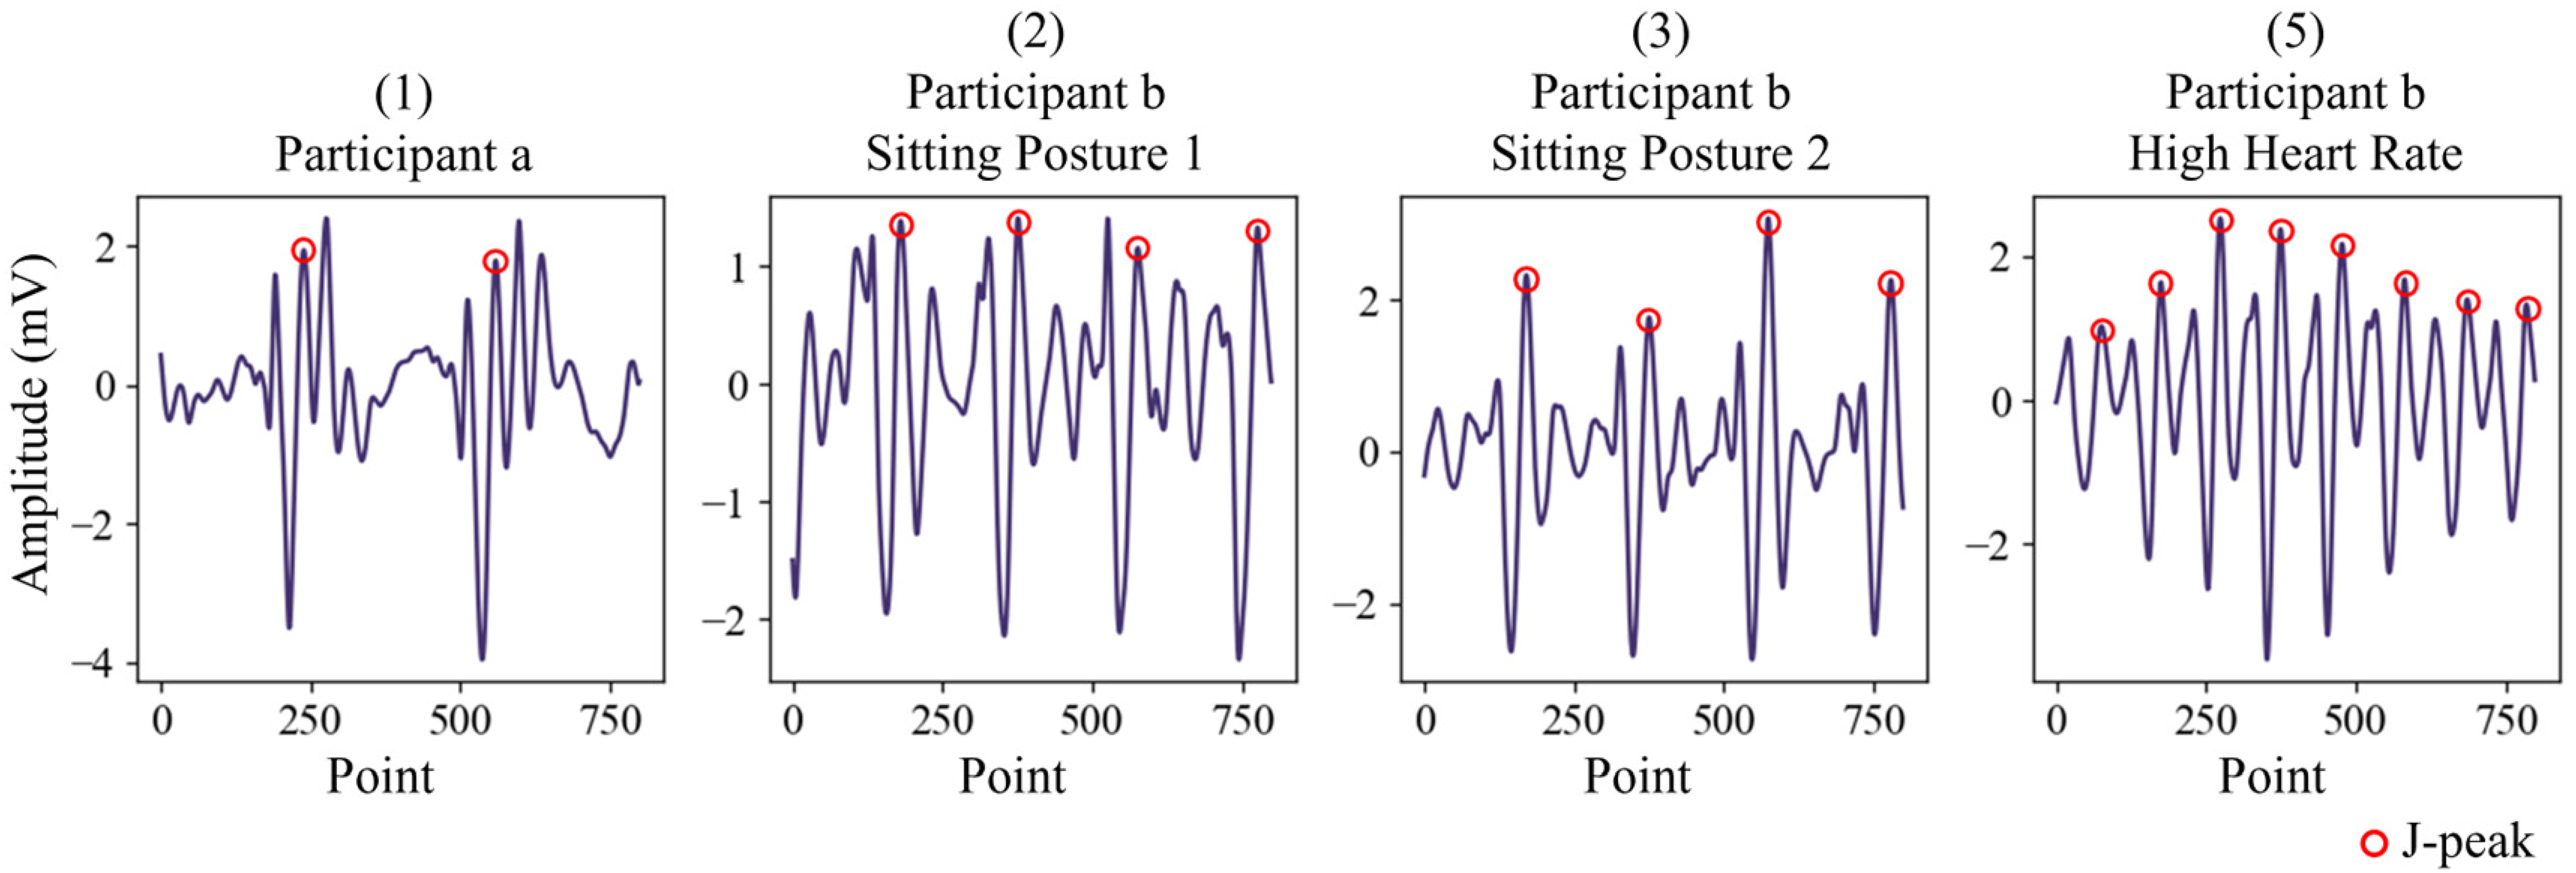
Variability of BCG waveforms. Significant difference between the waveforms of two participants, a and b. Waveforms collected from the same participant, b, are different depending on sitting posture, (2) in sitting posture 1 and (3) in sitting posture 2. (4) shows the waveform of participant b at 140 bpm. Compared with (2) and (3), Vt and Vd are apparent.
Although the Va is apparent, the relative amplitudes of the BCG components are relatively consistent for the same measurement of the same participant. 25 Therefore, the use of a template-based approach is more feasible.22,26,27 Creating a template is crucial for template-based methods. Using predefined templates is unlikely to handle a full range of scenarios, and it is better to extract templates from the BCG signal itself. This requires a method that can solve Va to determine the location of the main features of the BCG better than the traditional method represented by STE.
In terms of physiological signal processing, using second-order derivative is the classical operation to obtain additional information. 28 In recent years, studies have been conducted on the physiological mechanism of BCG generation. A research group used invasive intravascular pressure data to build a mathematical model and successfully predicted BCG waveforms. 29 As disclosed in, 29 a J-wave occurs when a maximum blood pressure gap exists between the apex and outlet of the aorta. The second-order derivative of the vibration displacement BCG at the measured site contains significant information about the pressure. Therefore, it can better capture the vibration feature of the cardiovascular system to control the Va to achieve a lock on the main features of the BCG.
By locking the J-wave in the template, only the point-to-point correspondence between the template and each signal segment containing the main components need be determined to extract all J-waves. Vt must be addressed to obtain accurate point-to-point correspondence.
Dynamic time warping (DTW) is an effective method of computing the optimal alignment between two time sequences.30,31 It can be applied to signals that change in the temporal domain but have consistent signal components. The occurrence time of the feature components of the BCG also change, but these components have some consistency in their relative magnitude. 25 Therefore, DTW is considered effective for solving Vt.
In the experimental data acquired in this study, Vd is clearly observed in a high-heart-rate BCG,16,17 where the IJK wave group occurring in systole is noticeable, but the other components may be aliased owing to the small heartbeat interval, resulting in a deficiency in the waveform components. Very few studies have tested high-heart-rate BCG signals. In ref. 17, three existing methods were tested; however, these methods performed poorly because of Vd. In this study, high-heart-rate cases were carefully investigated and compared with low-heart-rate cases to identify the differences and classify the high- and low-heart-rate cases for further analysis. In many physiological signal analysis methods, adjusting the parameters of the method according to the different conditions of the signals under investigation may also play a key role. 32 By experiments, it is clear that 2ndD-Ps of different rates of heart beats have obvious difference in frequency spectrum. Therefore, in this study, based on the frequency spectrum of the 2ndD-P, the Low- and High-Heart-Rate classification is developed to adjust the parameters.
Based on the above considerations, this paper proposes a novel method for identifying the peak of the J-wave, which is a salient component of BCGs. The 2ndD-P, template, DTW, and Low- and High-Heart-Rate Classifications based on the 2ndD-P frequency spectrum were combined to address the BCG waveform variability. Resting-state and post-exercise signals (high-heart-rate cases) were collected to validate the proposed method. Through experiments, it can be clearly seen that 2ndD-P, template, DTW, and low- and high-heart-rate classification play indispensable and important roles. Compared with the traditional method represented by STE, this method has more advantages in the sensitivity and positive predictivity and calculation of HRV parameters. In addition, the filtering strategy in signal pre-processing also has an impact on feature extraction. 33 To make sure that the proposed method does not depend on filtering strategies, preprocessing using different filtering strategies is also performed.
The remainder of this paper is organized as follows. The proposed method is described in detail in Methods section. Experiments section presents the experimental design of this study. Results section presents the results of the study. A discussion of the results is presented in Discussion section. Finally, Conclusion section concludes the paper.
Methods
The nature of this study is the processing and feature extraction of physiological signals with different types of variability.
Process of the proposed method
The schematic diagram of the proposed method is shown in Figure 3. For each BCG section, a small portion of the signals was first extracted as a trial segment (Seg-T). The 2ndD-P is then obtained for the Seg-T with default parameters, and used as the input for the Low- and High-Heart-Rate Classification, to adjust the parameters for the further analysis of BCG signals of different rates of heart beats. The 2ndD-P of the whole BCG section is acquired with the adjusted parameters. After that, the BCG section then is divided to pulse segments, each of which is aligned to be centered at its corresponding local maximum point in the 2ndD-P of the BCG section. Each pulse segment has same length, supposed to contain IJK wave group of a BCG pulse. A template is further generated for the BCG section by averaging the pulse segments, and used to localize the J-waves through template matching with DTW, which could deal with the Vt.

Schematic diagram of the proposed method.
As shown, the 2ndD-P, low- and high-heart-rate classification, template matching with DTW work cohesively in the proposed method for dealing with different types of BCG variability. The details of the proposed method are as follows.
Pre-processing
In this study, signals were collected at a sampling rate of 1000 Hz. To reduce the computational burden, we first decreased the sampling rate to 250 Hz. The spectrum energy of the BCG is considered to be concentrated at 10 Hz.15,34 Wavelet decomposition and reconstruction methods were used to remove noise. In this method, to avoid losing the original signal features, we selected the Sym8 wavelet, which is close to the shape of the BCG, to perform a 7-layer wavelet decomposition. 13 Subsequently, the detailed coefficients containing high-frequency noise and the approximation containing the baseline shift and respiration were removed, and signals ranging from 1 to 15.6 Hz were preserved. Owing to the individual differences among the participants, a significant difference was observed in the amplitude of the original signal. Therefore, the signal was standardized to eliminate this difference.
2ndD-P
For the pre-processed BCG signal, the Savitzky-Golay (SG) filter is first used to obtain the second-order derivative of the BCG signal. 35 In this study, to preserve the features of the BCG as much as possible and eliminate noise with sharp shapes, we set the window width and poly-order of the SG filter to 0.18 s and 3, respectively. As shown in Figure 4, the result revealed many components with high second-order derivative value near the J-wave position, even though the J-wave of the signal is not the most apparent component. Therefore, the positions of the IJK wave group in the BCG were effectively highlighted by the second-order derivative waveform. Then, the second-order derivative waveform must be simplified to a profile.

BCG and the absolute value of its second-order derivative waveform (au: arbitrary units). The absolute values of second-order derivative are used for highlighting the IJK wave group, which has significantly large values than other parts of BCG, even in the case that the J-wave was not the most prominent component.
For the second-order derivative waveform, referring to the method in,
15
the STE transformation was applied to obtain its profile using a sliding window. For waveform

BCG and its 2ndD-P. The IJK wave group position can be located through the
Subsequently, the local maximum points of the 2ndD-P,

Low- and high-heart-rate classification
As described in the introduction, the parameters (
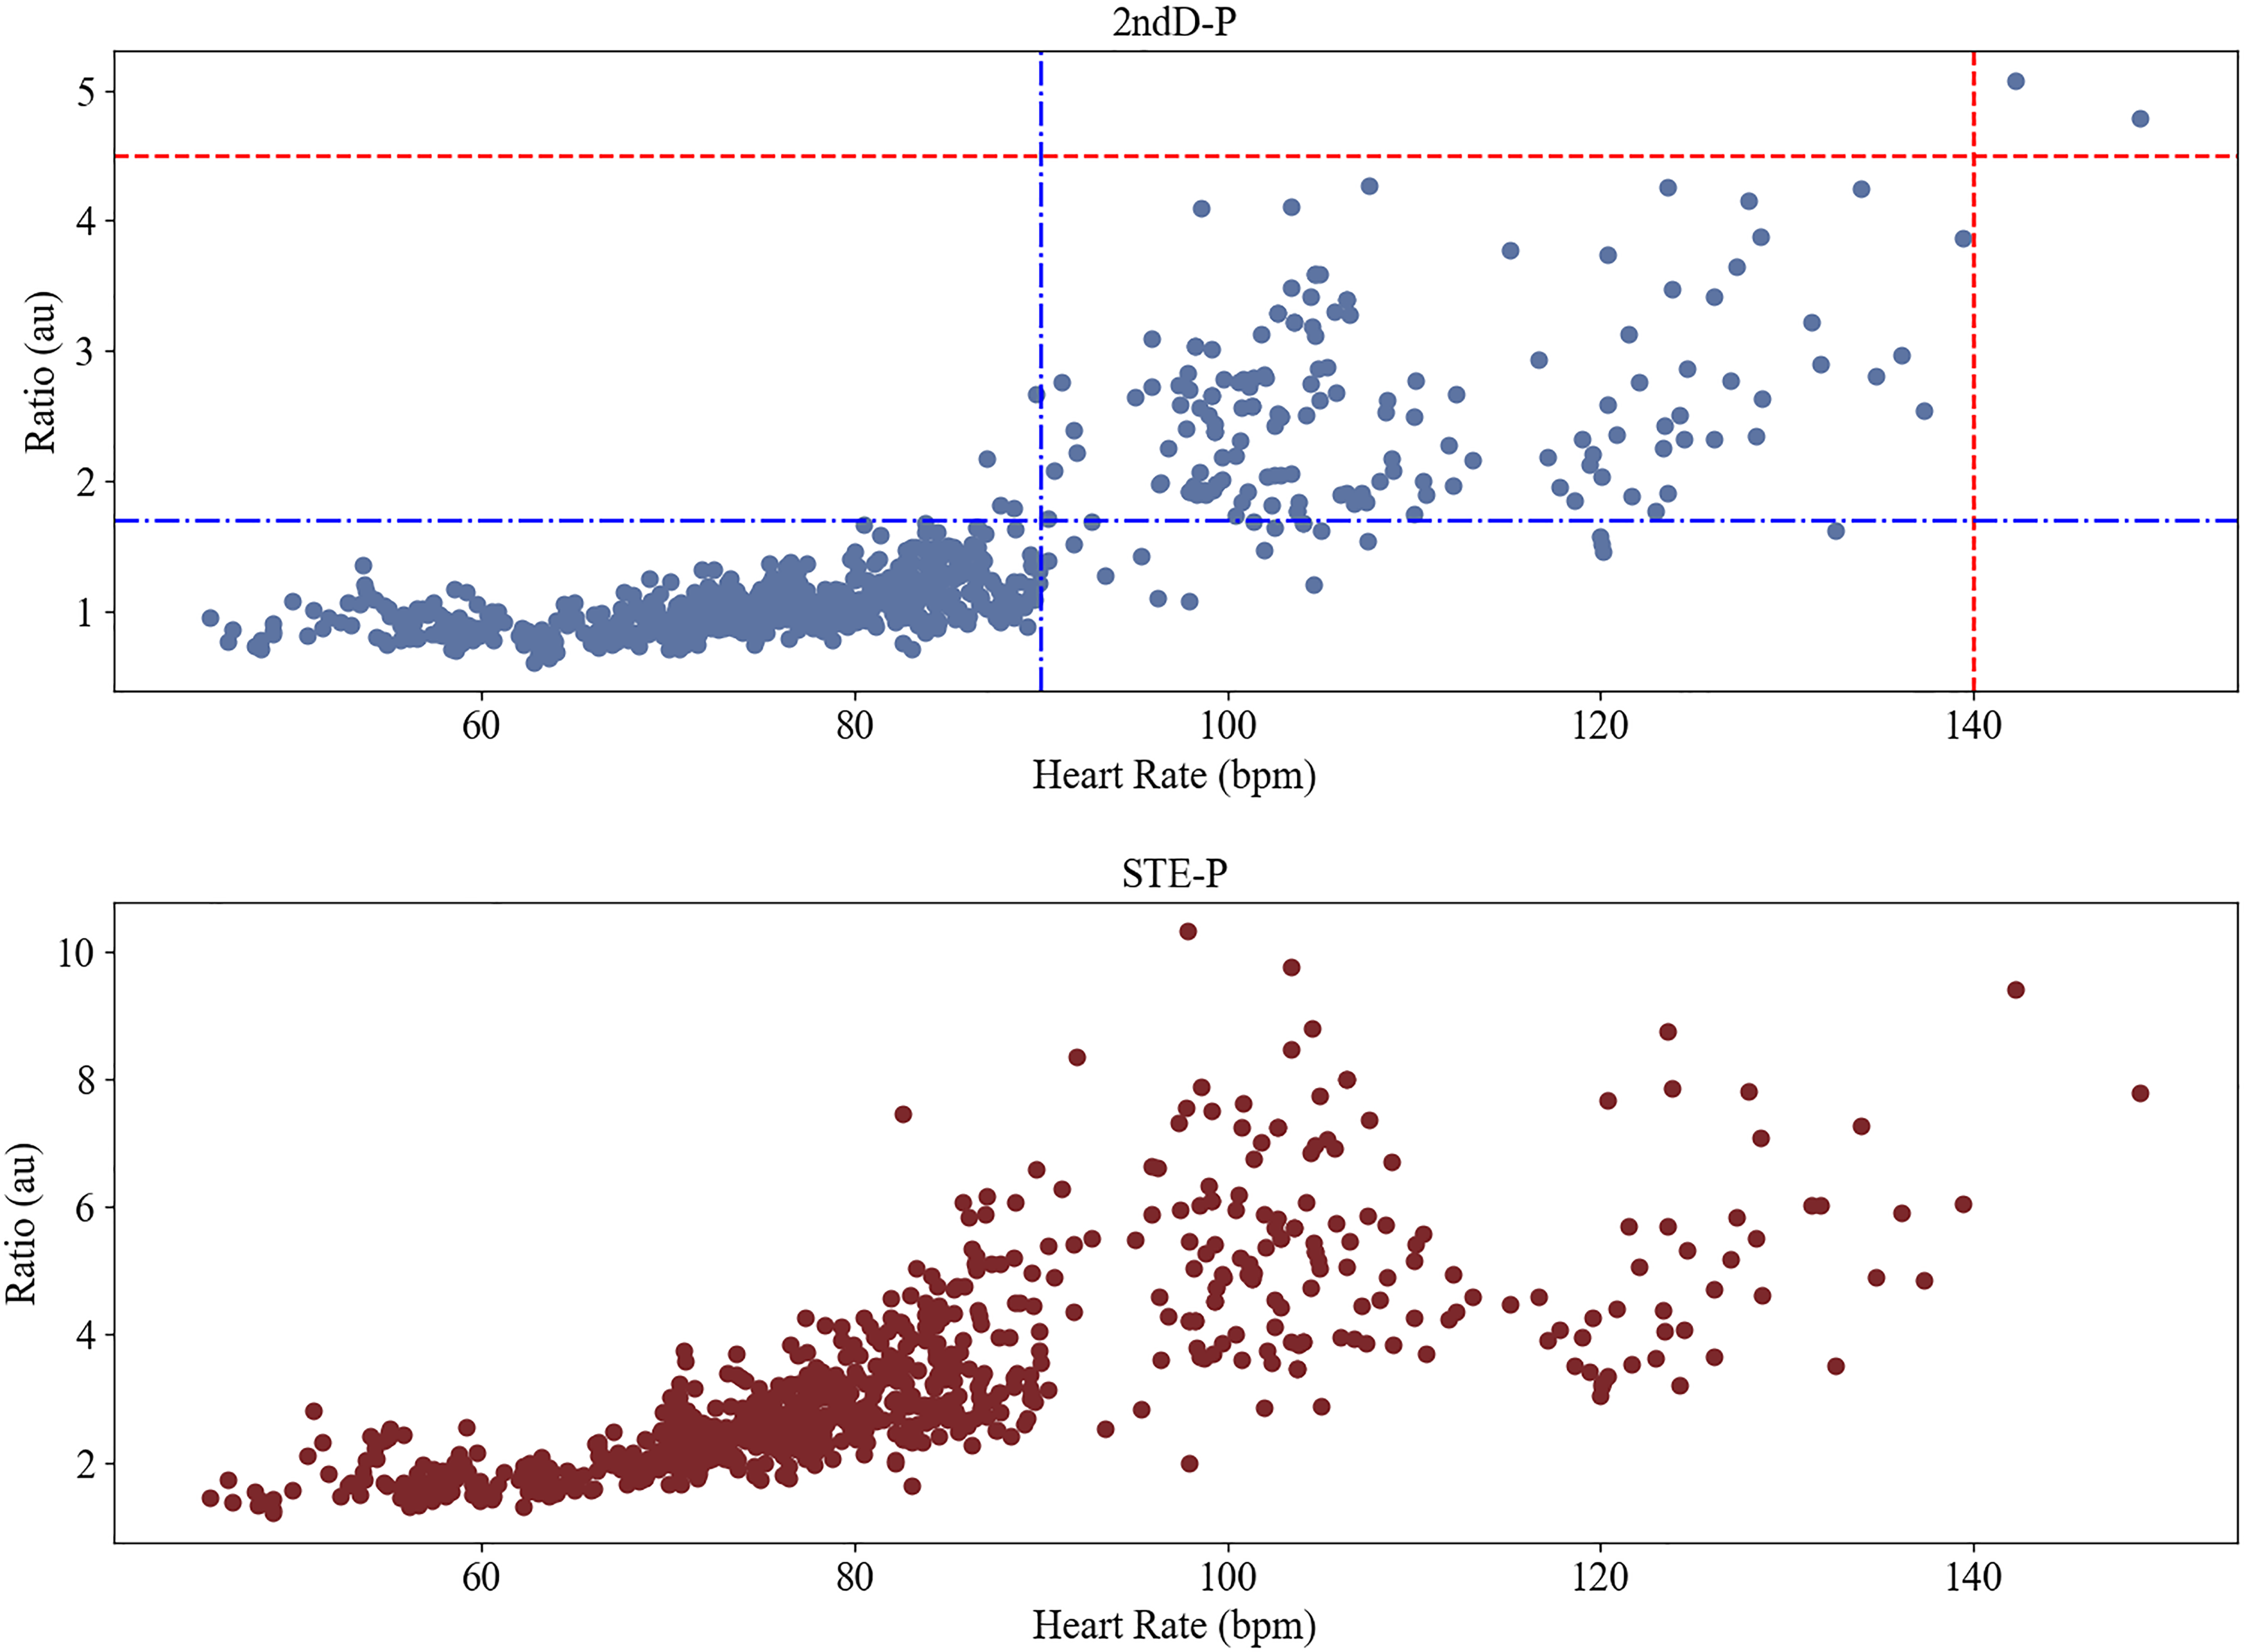
The 2ndD-P of the BCG signals created using the default parameters for different HRs were significantly different, as shown in Figure 6. From the spectrum obtained by the Fourier transform, we observed that when the HR was higher, the 2ndD-P had a higher direct current (DC) component, and the lower frequency band (< 0.5 Hz) had a significant energy distribution. However, when the HR is low, the higher frequency band (> 0.5 Hz) has apparent energy, particularly where it corresponds to the HR.

2ndD-P and its spectrum. Left: Mean HR: 86. Right: Mean HR: 149. At high HRs, there was a significant energy within 0.5 Hz.
Based on these observations, a method is proposed for classifying based on the 2ndD-P. Typically, it is exceedingly rare for an individual with normal physiological conditions to exhibit a HR below 30 bpm (0.5 Hz).
36
In this study, a HR greater than 90 bpm (1.5 Hz) was defined as a high HR. If the HR is low (30 < HR < 90), it has high energy in the frequency band between 0.5 and 1.5 Hz. However, in a high-heart-rate state, the frequency band within 0.5 Hz has an energy distribution and no apparent energy distribution in the frequency band between 0.5 and 1.5 Hz. To highlight the difference in spectral energy distribution between the low and high HRs, we used the ratio of spectral energy integrals, and 0.5 and 1.5 Hz were set as the cutoff. This ratio is defined as follows:


When the HR is high, the width (
The relationship between HR level and Ratio, and corresponding parameter settings.

Note. HR Level: “Low”, HR ≤ 90; “High”, 90 < HR ≤ 140; “Much High”,
HR > 140. Ratio is the index calculated from the spectral information of 2ndD-P, as shown in equation (5), used for classifying HR level.
In this study, the first 16 s segment of the signal used for analysis, before creating the template of this signal, were used for Low- and High-Heart-Rate Classification. The segment length was 16 s to ensure a sufficient length of the signal to be Fourier transformed to avoid distortion of the spectral information, whereas a long signal length increased the computational burden.
Template creation

Determining the J-wave in the template
After obtaining

Two types of
In the first type of
In the second type of
Considering the robustness of the algorithm and the complexity and diversity of the data collected in practice, if a
J-wave identification based on DTW
In this study, DTW was used to implement template matching to obtain point-to-point correspondence
37
between

Point-to-point correspondence between
The point-to-point correspondence obtained using DTW is not a single point-to-single point, but rather a point-to-many points. In this case, among all points corresponding to the peak of the J-wave in the
Reference methods
Reference method 1 (RM1): method based on the short time energy
In ref. 38 , a comparative study of the BCG featuring component extraction algorithms, the method based on the short time energy, which was proposed in ref. 15 , exhibited the highest efficiency and was easy to implement. Therefore, it was selected as a representative of the traditional method for comparison with the proposed method. The steps and specific implementation details of this method are described below.
In this method, a short-time energy transformation is performed on the BCG using a sliding window. For segment

BCG and its 2ndD-P and STE-P.
Reference method 2 (RM2): using the STE-P to create the template
For a fair comparison and to better demonstrate the advantages of the proposed method, we propose an improved method RM1, called RM2, in which a template is created using STE-P, and then DTW is used to determine all the peaks of the J-wave, as in the proposed method. Based on this concept, we propose RM2 to clarify the necessity and advantages of 2ndD-P.
Experiments
Experimental design and setup
Two types of experiments were conducted. One of them was the resting-state case collection data for component extraction. A high HR or hypertensive state can lead to variation in the BCG waveform. After sports activities, the HR gradually slows, blood pressure gradually returns to the normal level, and Vt and Vd occur in this process. To verify the validity of the proposed method for Vt and Vd, we performed a second experiment after the participants completed an exercise.
Participants and instruments
This study has been conducted for about one year at Center for Frontier Medical Engineering, Chiba University.
Twenty-four participants were invited to participate in the experiment. Seventeen of them were male and seven were female. The demographics of the participants are shown in Table 2. The age range of the participants was 22–55 years, and their body mass index (BMI) ranged from 17.22 to 29.41. None of the participants had a known history of cardiovascular disease. Before conducting the experiments, participants were informed of all details regarding the experiment, and all participants provided written consent to participate in the experiment.
Demographics of the participants.

For each participant, the BCG and finger pulse (FPu) signal which could assist in labeling the reference value of the J-wave location of the BCG signal were collected.
The BCG sensor (Vital Beats from Future Ink) is a piezoelectric sheet sensor that generates voltage from vibrations or bending. 39 The sensor was placed on a chair with soft cushions to ensure that the vibration of the sensor was not limited. The participants were asked to sit directly on the sensor to collect the BCG signal. The FPu sensor was a Pulse Transducer TN1012/ST (ADInstruments). The participants were asked to wear the sensor with their left thumb. The signals from both sensors were input into Powerlab 2/26 (AD Instruments) to perform analog-to-digital conversion. The experimental setup is shown in Figure 10.

Experimental setup. Left: Top view; Right: Side view.
Resting state
In this experiment, at least two recordings were made for each participant and each recording lasted approximately 3 min. The participants were instructed to remain as still as possible and maintain the resting state during the experiment. To verify that the proposed method could adapt to BCG waveforms in different sitting postures, after completing one recording collection, the participants were asked to adjust their sitting postures, such as moving their hands from the tabletop to their thighs, for a new recording collection. A total of 51 recordings were obtained. For the naming of the dataset, “participant number-data number” format was used, for example, “003-2,” to denote the second recording for the third participant.
For this experiment, not only is the proposed method, RM1 and RM2, proposed method without DTW and proposed method without Low- and High-Heart-Rate Classification are also performed to show the importance of DTW and Low- and High-Heart-Rate Classification.
After exercise
In this experiment, participants were requested to perform ergometer cycling (ERGOMETER 232CXL) to increase their HR. The pedaling power was set according to the individual weight of each participant to ensure that there was no health risk. Participants were instructed to maintain a speed of approximately 90 revolutions per minute for 5 min, but without a target HR to reach. Also, in this experiment, if one participant experienced physical discomfort or believed they could not continue the exercise or measurement, the experiment is to be immediately terminated to ensure safety. After the exercise, the participants were requested to sit and remain as still as possible to collect the BCG and FPu signal for approximately three minutes. As shown in Table 3, 11 participants participated in the experiment.
Participants in the experiment “after exercise.”

For these recordings, to distinguish them from the resting state recording, we named them in the format “participant number-H”. To prove that the proposed method can be adapted to high HR recordings compared with the reference method, and to show the importance of Low- and High-Heart-Rate Classification. Proposed method, RM1 and RM2, proposed method without Low- and High-Heart-Rate Classification are performed. Moreover, for a fair comparison, the parameters of RM2 were manually adjusted to accommodate a high-heart-rate state as well. Here,
Filtering strategy
In this study, the preprocessing filter is based on the wavelet decomposition and reconstruction method. Some studies have shown that filtering strategies may have a key impact on the feature extraction of physiological signals. 33 Therefore, it is also necessary to compare different filtering strategies. Moreover, it is important to make sure that the proposed method does not rely on pre-processing techniques.
In this experiment, three filtering techniques are compared:
Wavelet decomposition and reconstruction: the specific implementation details have been described in 2.2. Widely used IIR Butterworth filter: A 4-order high-pass filter with a cutoff frequency of 1 Hz and a 4-order low-pass filter with a cutoff frequency of 15.6 Hz were used to remove the baseline drift and high-frequency noise. Elliptic IIR filter which has effective performance in processing of PPG
33
: A 4-order bandpass elliptic IIR filter is used with a lower and upper cutoff frequency of 1 Hz 15.6 Hz.
Reference signal and manual labeling
In this study, the FPu signal was used as a reference signal to assist with the labeling of the J-waves. As shown in Figure 11, the peak of the FPu signal was generally extremely close to and occurred before the peak of the J-wave of the BCG collected in the sitting state.

Preprocessed BCG and FPu. The peak of the J-wave can be determined intuitively through the FPu.
Based on this observation, all peaks of the J-wave were manually labeled to build a dataset of reference values for measuring the effectiveness of the method. In the actual recordings, we observed that a few segments of the BCG signal were severely disturbed by body motion and the J-wave could not be determined. In this case, the peaks of the J-wave were labeled according to the interval between the other peaks of FPu signals and J-waves in the same recording.
And with this reference value dataset, instantaneous HR of each recording was calculated. In addition, a 16-s width sliding window with a 15-s step length was used to calculate the mean HR and
Performance metrics
Sensitivity and positive predictivity
Using the reference value dataset, the performance of the method was evaluated using precise metrics. Metrics widely used in the field of ECG analysis,
40
sensitivity (Se) and positive predictivity (+P) were employed to evaluate the performance of the method. Therefore, the numbers of false positives (

Standard deviation of normal-normal intervals (SDNN)
Heart rate variability (HRV) is of great significance for the monitoring of daily life.41,42 Therefore, for signals related to cardiac activity, the calculation of HRV parameters is very important. Ref.
43
proved that in the calculation of the SDNN which is an important HRV parameter, the BCG and pulse wave signals measured by the pressure sensor were highly consistent with the ECG. Therefore, in this study, the SDNN was selected as the metric, and FPu was used as standard. The SDNN is calculated as follows:
44

Results
Low- and high-heart-rate classification
As for comparison, instead of 2ndD-P, the HR-Ratio relationship in terms of STE-P is shown in the lower part of Figure 12. Although the correlation value (0.75) was similar to result obtained using 2ndD-P, it is difficult to set thresholds to distinguish between low- and high-heart-rate.
J-wave extraction
Resting state
The results of the methods for 51 recordings of the resting-state experiments are listed in Table 4. As shown in Table 4, the proposed method had the highest
J-wave identification results.

Note. Bold: 1.7 ≤ Ratio < 4.5. Only the results for a subset of the resting state recordings are illustrated here; full results can be found in the supplementary materials Section 2.
As shown, if DTW is not used, compared with the full implementation of the proposed method, the accuracy is significantly reduced. Moreover, the Low- and High-Heart-Rate Classification didn’t make difference for the resting state BCGs.
Because the waveform of each heartbeat of BCG collected in the same sitting position in the resting state has high consistency, recordings can be further divided according to the morphology of the template. If the J-wave amplitude was smaller than that of the other components in the template, the recording was considered a J-wave non-prominent recording, as shown in Figure 13. For these recordings, the results are shown in Table 5.

The J-wave amplitude was smaller than that of the other components. The point on the waveform: The J-wave peak.
Results for the recordings with non-prominent J-wave.

As can be seen from Table 5, the proposed method has apparent advantages for BCG waveforms with non-prominent J-waves.
Meanwhile, the advantages brought by the combined use of DTW cannot be ignored. As shown in Figure. 14, the accuracy of RM2 is significantly improved compared with that of RM1. However, due to the Va, RM2 is less effective than the proposed method in some cases.

Results of proposed method and reference methods.
The different details of the use of STE-P and 2ndD-P are shown in Figure 15. The local maximum point of the STE-P deviated more from the true J-wave position than that of the 2ndD-P. The local maximum point of the 2ndD-P also showed some deviation from the J-wave. However, owing to the use of DTW, the point-to-point relationship between the template and signal segment allows the peaks of the J-wave to be correctly labeled.
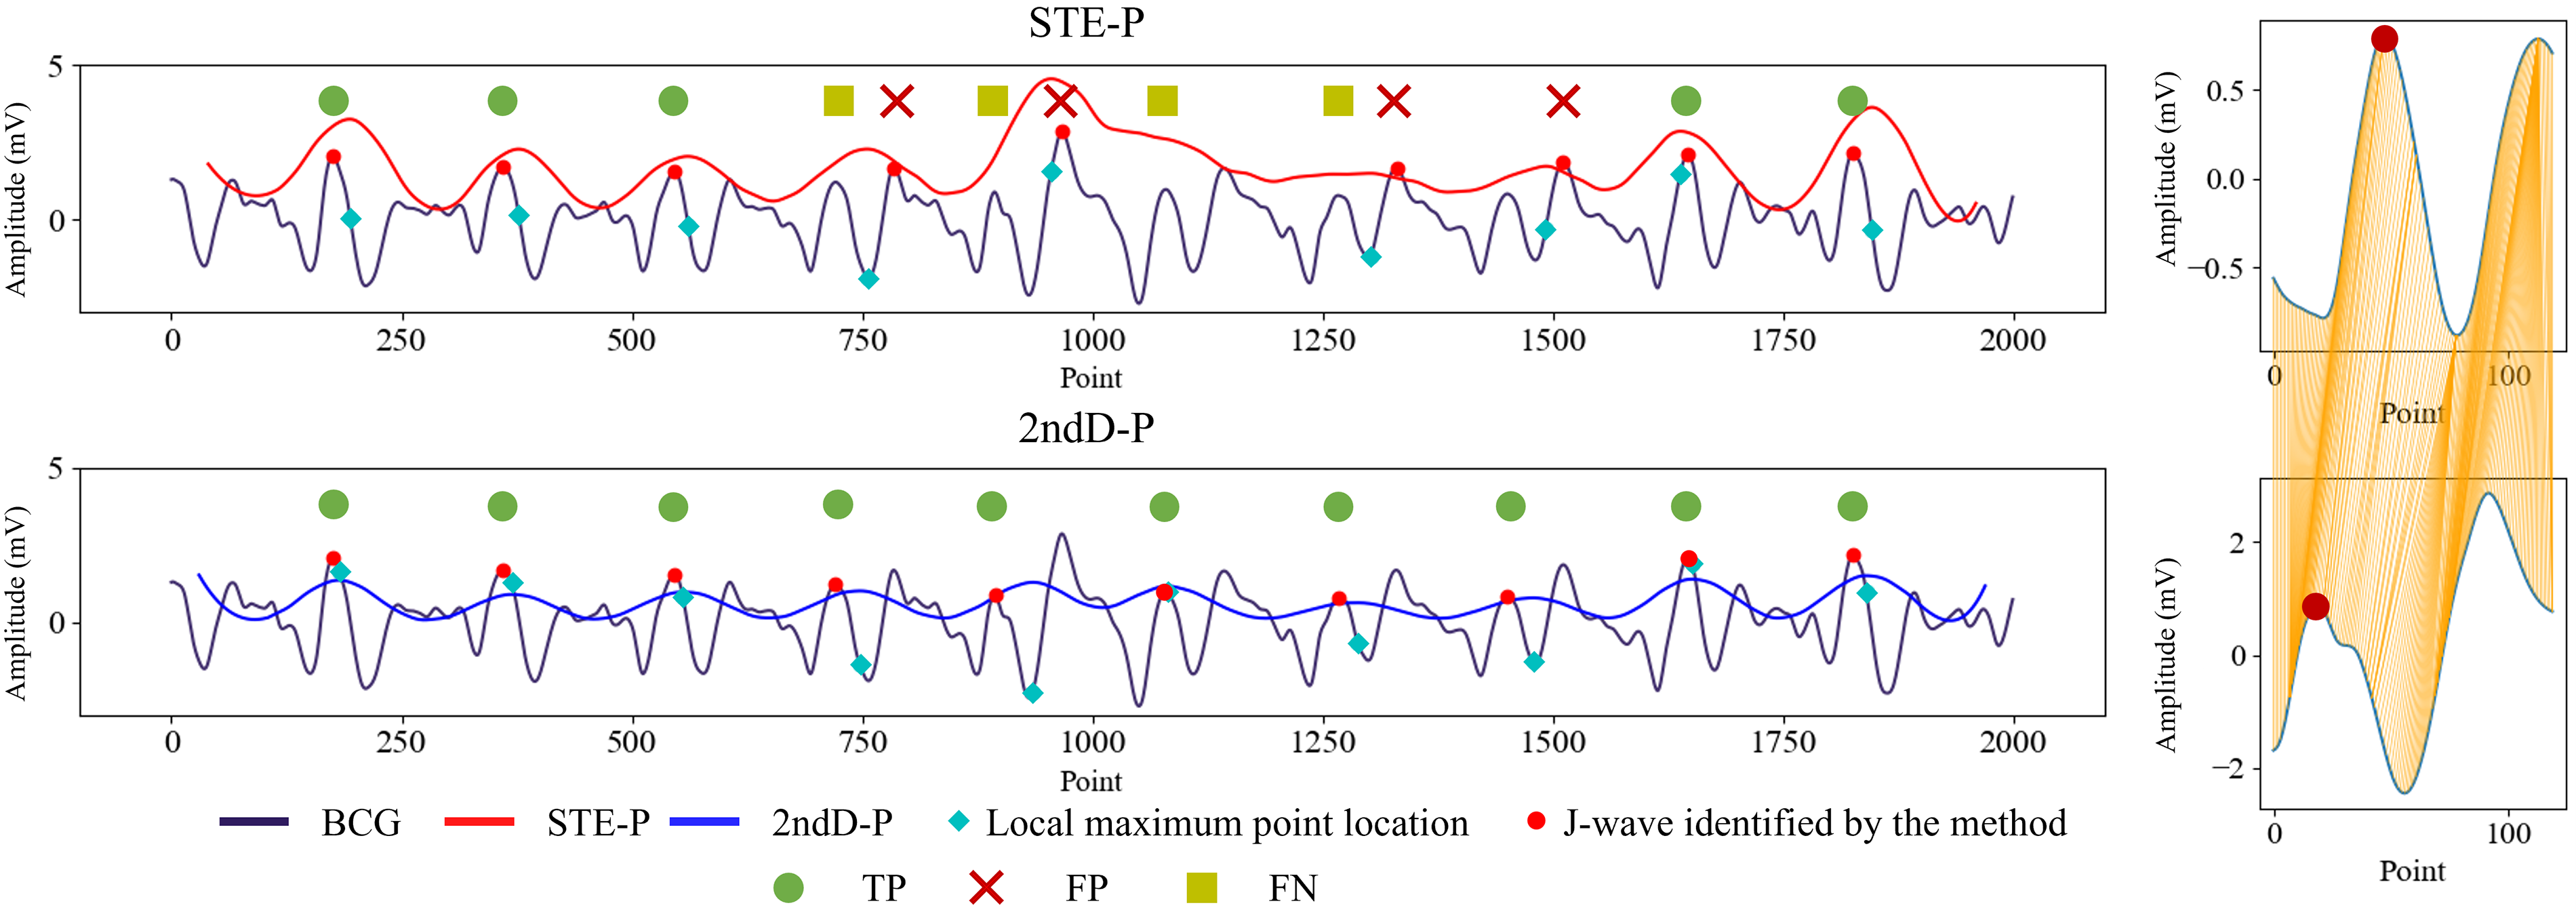
Details of the BCG segmentation results. Left: Labeling result of a BCG segment; Right: Details of DTW results for the fifth heartbeat of the left signal segment. Because of the variability of BCG, 2ndD-P is more suitable for determining the approximate position of the J-waves than STE-P. Owing to the use of DTW, the peak of J-wave can be correctly marked even if
About the SDNN calculation, the proposed method was closer to the results calculated using the FPu signal than reference methods. As shown in Figure 16, the proposed method exhibited a significantly better correlation.

Bland–Altman plot between FPu-SDNN and BCG-SDNN obtained by (a) the proposed method, (b) RM1, and (c) RM2. SDNN calculation using the positions of the J-wave peak obtained using the proposed method has advantages over reference methods.
Additionally, the three evaluative metrics associated with the Bland–Altman plot (the mean bias, standard deviation, and limits of agreement) are also presented, as shown in Table 6. The proposed method exhibited distinct advantages compared with reference methods.
Evaluation metrics of Bland–Altman plot.

After exercise
The results for 11 recordings collected after exercise are presented in Table 7. Compared with the reference methods, the proposed approach has obvious advantages. On the other hand, the results also reflect the importance of parameter adjustment based on the Low- and High-Heart-Rate Classification.
Results for “after exercise.”
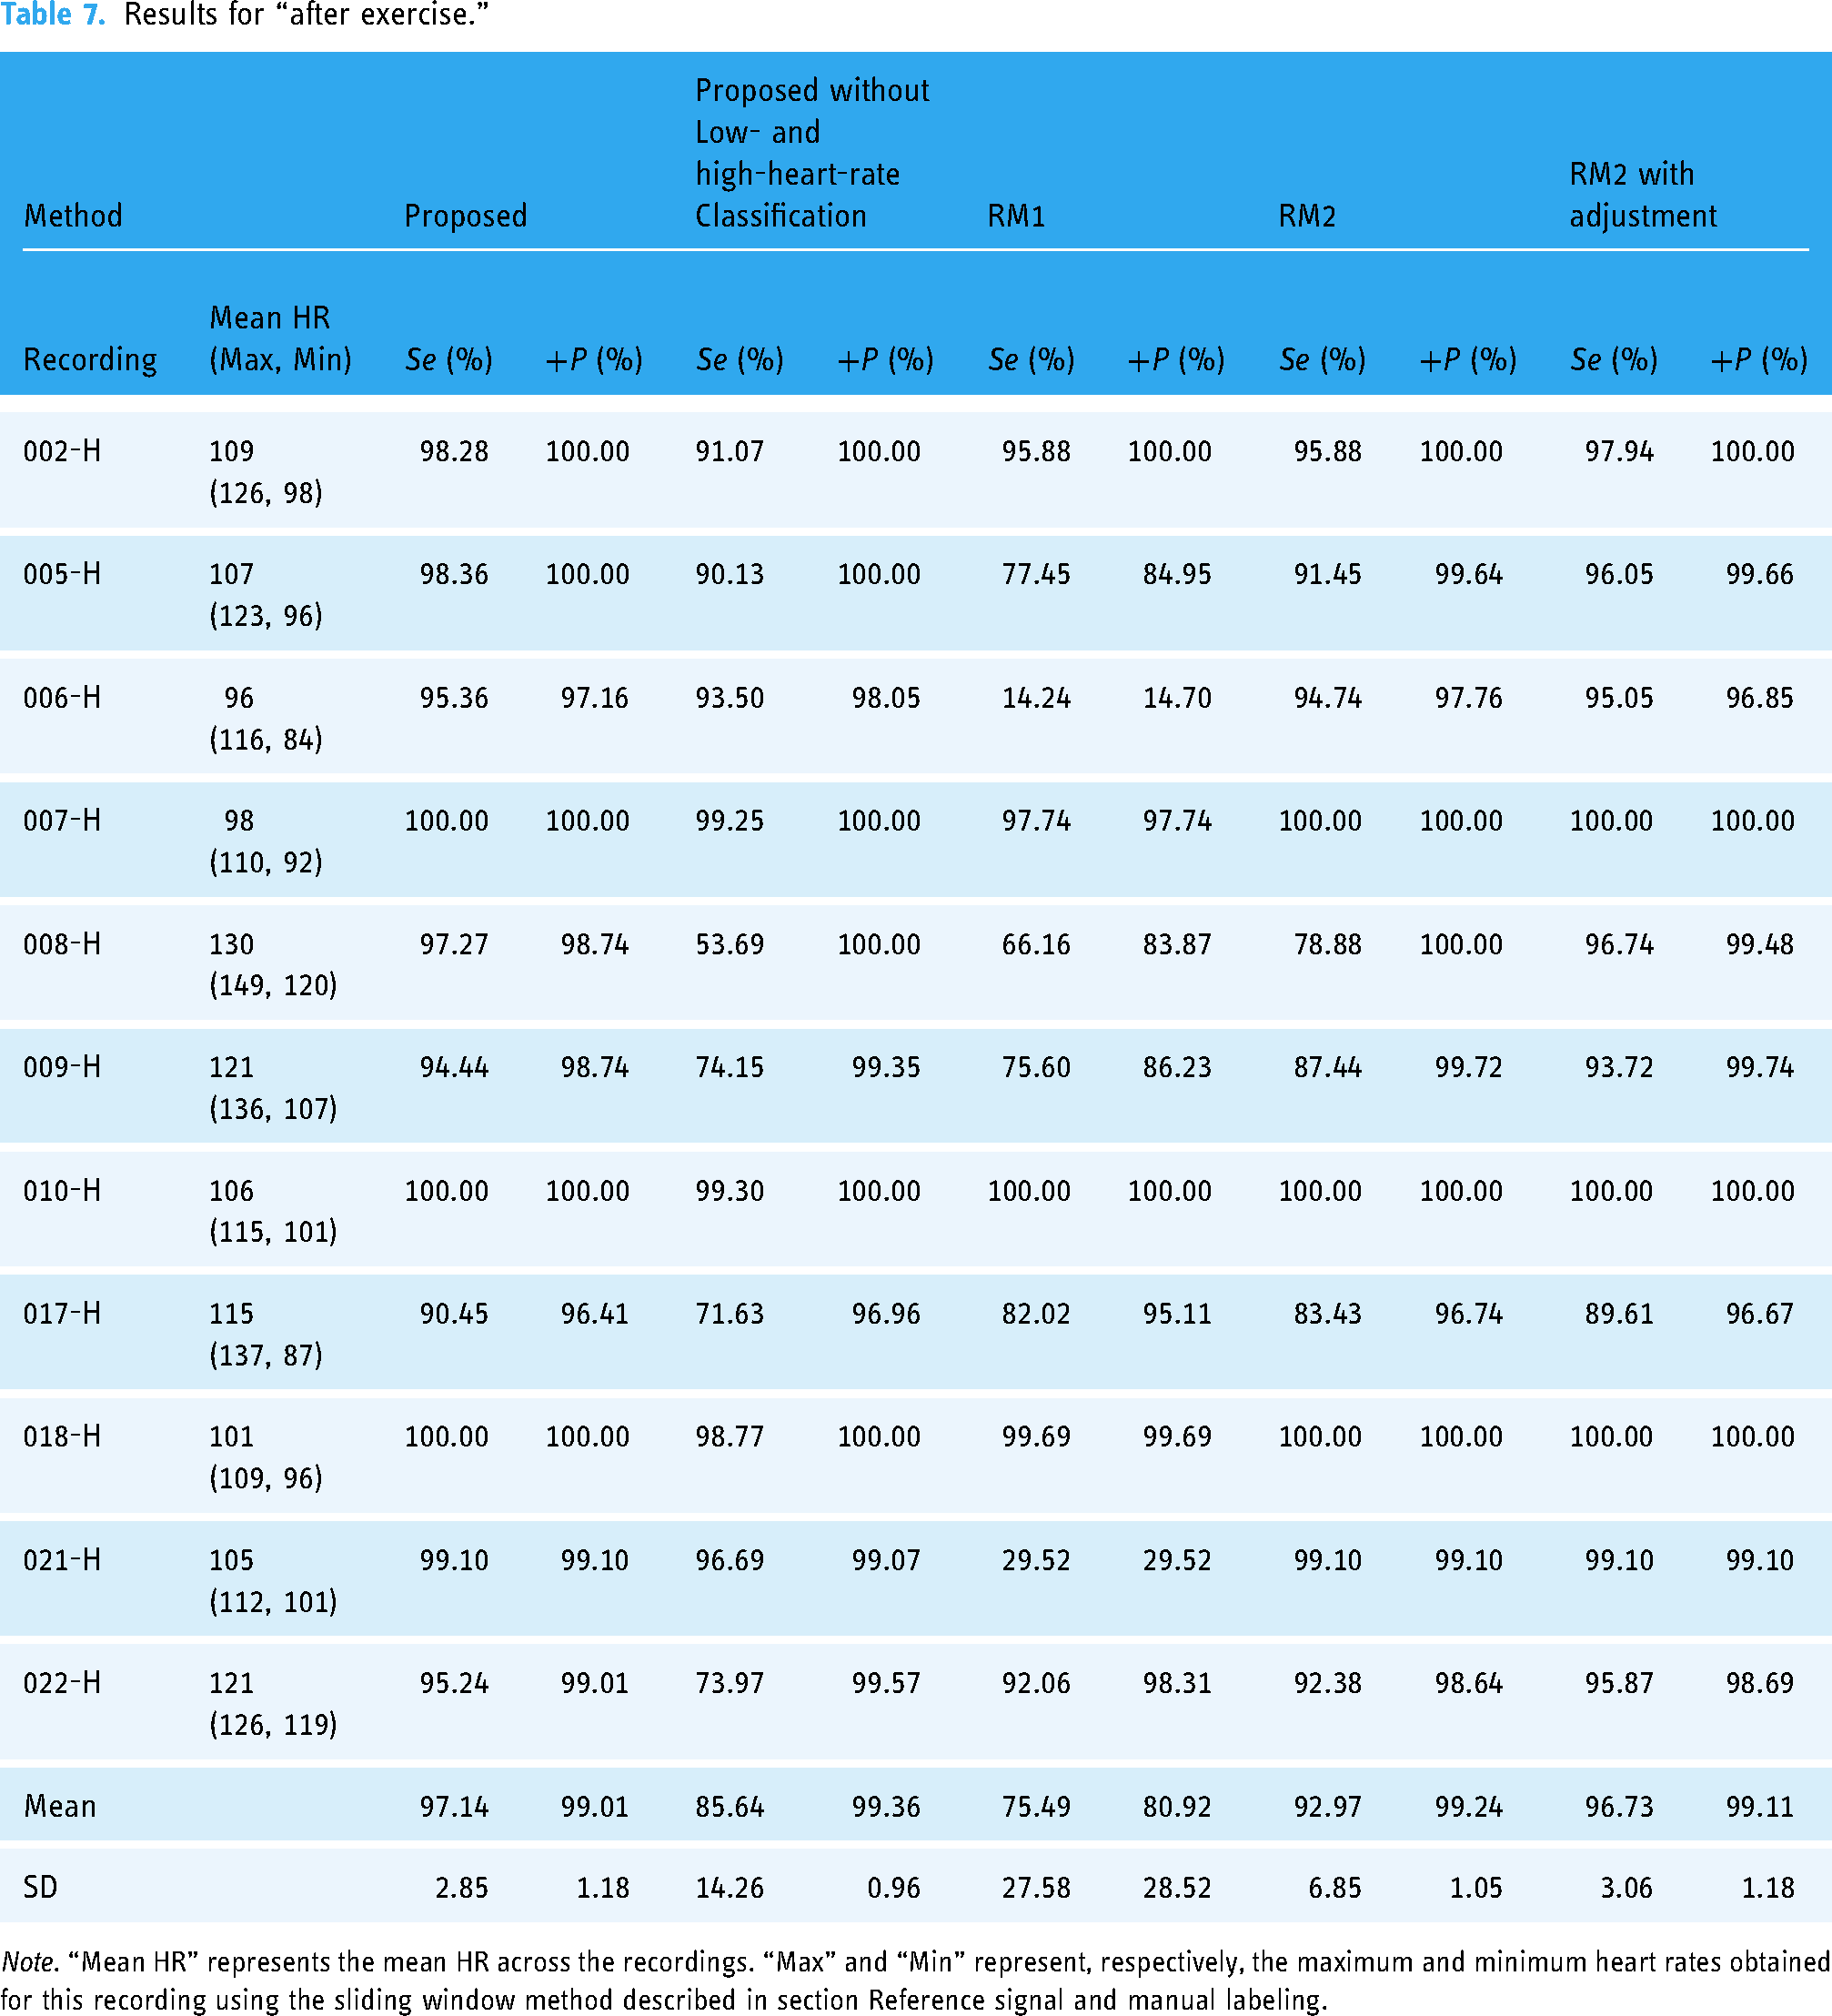
Note. “Mean HR” represents the mean HR across the recordings. “Max” and “Min” represent, respectively, the maximum and minimum heart rates obtained for this recording using the sliding window method described in section Reference signal and manual labeling.
HR decreases over time and the change of

Compared with low-heart-rate signals, FNs were more likely to occur in the detection results of high-heart-rate signals, as shown in Figure 18.

Segment from the recording 008-H. There are two FNs. The periodicity of the BCG is clear.
Filtering strategy
After preprocessing with three different filtering techniques, the proposed method is used to extract J-wave from 51 recordings of resting state and 11 recordings collected after exercise. The results (mean of the metrics values) are shown in Table 8.
It should be noted that the elliptic filter can cause severe distortion in the waveforms of some recordings. If these distorted recordings are excluded, the results are as follows: (resting state: Se: 98.49%, +P: 98.87%; After Exercise: Se: 97.03%, +P: 98.97%). The results indicate that different filtering techniques do not have a significant impact on the proposed method.
Discussion
To solve variability of BCG
The experiments showed that the proposed method performs satisfactorily in J-wave extraction and HR variability parameter calculations, as shown in Tables 4–7. This is because the waveform variability of the BCG is fully considered in this method. 2ndD-P, the template and DTW, and Low- and High-Heart-Rate Classification, were used to address the three types of variability (Va, Vt, and Vd) in the BCG.
2ndD-P is the core of the proposed method. It is the basis for creating templates for template matching and implementing Low- and High-Heart-Rate Classification. Using the 2ndD-P, the positions of the IJK wave groups could be found more accurately. Specially, as shown in Tables 4 and 5, even without the DTW, the 2ndD-P based method has obvious advantages over RM1. These results show that the proposed method can deal with Va using the 2ndD-P, particularly while the J-wave is not the most prominent component. Although the J-wave is not prominent, it and its surrounding components still have higher second-order derivative values in one cardiac cycle. Therefore, the 2ndD-P proposed in this study can better capture the vibrational nature of BCG.
Another key factor that addresses waveform variability is the combined use of the template and DTW. Owing to variability, determining apparent commonalities in BCG among different participants as the basis for feature extraction is difficult. By creating a participant- and moment-dependent template and then using the template to match the feature segments, detecting all the peaks of the J-wave can be effectively reduced to determining the peak in the template. The validity of this concept was demonstrated through experimental results. As shown in Table. 4 and Figure 14, RM2 using the template method had clear advantages over RM1.
After determining the peak of the J-wave in the template, using this information to identify each peak of the J-wave should be considered, which must use DTW owing to Vt. As shown in Table. 4, the proposed method exhibited a significant improvement compared with the proposed method without DTW. This is because the occurrence times of the BCG components is not uniform. Comparing RM1 with the proposed method without DTW, 2ndD-P has apparent advantages in finding the segment containing the IJK wave group. However, because of Vt, this segment was not always consistent with the J-wave, as shown in Figure 15, which requires DTW to adapt to Vt.
In this study, Vd primarily occurred in recordings of a high HR. As shown in Figures 2 and 17, for the signal of participant 008 in the resting state, a clear interval was observed between each heartbeat. For a signal with a high HR, the interval was very short; thus, the components with high second-order derivative value appeared at shorter intervals, and some other components of the BCG waveform were aliased and could not be distinguished. To solve Vd, this paper proposes a Low- and High-Heart-Rate Classification. For the resting-state recordings, the presence or absence of Low- and high-heart-rate classification did not exhibit a clear difference in the results. As shown in Table 4, in the resting-state recordings, only the “010-1”, “022-1”, and “022-2” recordings had an average HR higher than 90 and a
It is worth noting, as shown in Table 8, that variations in the filtering strategy do not significantly affect the performance of the proposed method. The results from three different filtering techniques (though the results from the elliptic filter require the exclusion of recordings with obvious distortion) show no significant differences. This indicates that the proposed method does not rely on the preprocessing filtering techniques. And through the ablation studies on the parameter
The result of different filtering strategies.

In summary, the best performance was achieved by proposed method whose components work cohesively with each other to solve three types of variability. 2ndD-P plays the most important role in this work. Based on the frequency spectrum of 2ndD-P, the parameters can be adjusted according to the heart rate to obtain the locations of IJK wave group more accurately. These locations are the basis for subsequent template creation and template matching with DTW. By solving variability, the proposed method has obvious advantages over the reference methods. Compared with the NN based methods17–19 reported in recent years, the proposed method is simple and reliable, and fully explainable.
Contribution and limitations
Contribution
In this work, for the first time, the three types of variability of BCG are addressed systematically, by a 2ndD-P based method, which integrates a template matching, DTW, and Low- and High-Heart-Rate Classification based on 2ndD-P frequency spectrum. Moreover, this is the first time for the 2ndD-P to be used to extract feature components for BCG. It can better capture the nature of the BCG as a vibration signal and has great help in dealing with the Va of the BCG. Especially in the case of BCG with non-prominent J-wave, 2ndD-P can help capture the feature efficiently. The low- and high- heart-rate classification based on the spectral information of 2ndD-P contributes to the BCG in different heart rate. Based on this classification, the method can be adapted to high-heart-rate recordings, which have not been carefully analyzed in most related studies. In this study, BCG is one step closer to its application in daily life.
Limitations
The largest limitation of this study is that all data were measured in a state in which the participants were required to remain as still as possible. Data on body-motion artifacts have not been fully discussed. On the other hand, for template-based methods, the signal period length used to create the template needs to be discussed. However, in this study, there was no significant difference in the results of different template creating methods. This is most likely because the participants were instructed to remain still during the experiment. When body movements, especially changes in participant posture, are included, template updates have to be considered.
And the data in this study included only healthy individuals and did not explore cases of cardiovascular diseases. Theoretically, cardiovascular diseases are likely to have a strong impact on BCG signal. 45 For example, mitral valve membrane insufficiency may cause blood flow vibrations in the heart to be less consistent than those observed in a healthy person. 46 It is likely that there was significant Vd in these patients. Because of Vd, the template of BCG may also be more types than the two presented here. Therefore, BCG signals in people with cardiovascular diseases must be carefully studied.
Finally, since the sensor used in this study is a piezoelectric sheet sensor, the proposed method may be suitable only for the vibration displacement BCG collected by this sensor. The applicability of the proposed method for BCG collected by other kinds of sensors needs to be further discussed.
Future work
The current data were collected when the participants were required to maintain a resting state that deviated from their actual life situation. Signals with body motion or other artifacts must be considered in future studies. We proposed a BCG signal quality evaluation method that can remove the poor-quality BCG segments that are heavily affected by body movement. 47 By combining this method, the proposed method can be applied to a signal with body-motion interference. Accordingly, we plan to conduct additional tests in the future. In addition, to further study how to solve Vd and whether the proposed method can be applied to the elderly or people with cardiovascular diseases, BCG signals from elderly and non-healthy individuals must be collected and tested.
Conclusion
This paper presents a method of extracting the BCG J-wave using 2ndD-P, a template, DTW, and Low- and High-Heart-Rate Classification, with full consideration of BCG waveform variability. Fifty-six recordings from 24 participants were tested, and the method performed well with satisfactory
Supplemental Material
sj-docx-1-dhj-10.1177_20552076241277746 - Supplemental material for Solving variability: Accurately extracting feature components from ballistocardiograms
Supplemental material, sj-docx-1-dhj-10.1177_20552076241277746 for Solving variability: Accurately extracting feature components from ballistocardiograms by Tianyi Yang, Haihang Yuan, Junqi Yang, Zhongchao Zhou, Masayuki Abe, Yoshitake Nakayama, Shao Ying Huang and Wenwei Yu in DIGITAL HEALTH
Footnotes
Acknowledgements
We would like to thank all the participants in this research.
Contributorship
TY was responsible for the methodology, management of the experimental data of the study, and wrote the manuscript. HY was responsible for conducting the experiment and participated in the management of the experimental data. JY and ZZ contributed to the experimental design and method development. MA, YN, and SH contributed to the discussion and review of the paper. WY was responsible for the supervision of the study and for the review and editing of the manuscript.
All authors reviewed and edited the manuscript and approved the final version of the manuscript.
Declaration of conflicting interests
The authors declared no potential conflicts of interest with respect to the research, authorship, and/or publication of this article.
Ethics approval and consent to participate
This research was conducted in accordance with the Declaration of Helsinki. And the Joint Institutional Review Board of the Graduate School of Science and Engineering at the Design Research Institute, Center of Frontier Medical Engineering (R5-01) approved this research.
Before starting the experiment in this research, participants were informed of the specific details. After obtaining informed consent from the participants, the experiment was conducted.
Funding
The authors disclosed receipt of the following financial support for the research, authorship, and/or publication of this article: This work was supported by JST SPRING, Grant Number JPMJSP2109.
Guarantor
WY is the guarantor and corresponding author of this research.
Supplemental material
Supplemental material for this article is available online.
References
Supplementary Material
Please find the following supplemental material available below.
For Open Access articles published under a Creative Commons License, all supplemental material carries the same license as the article it is associated with.
For non-Open Access articles published, all supplemental material carries a non-exclusive license, and permission requests for re-use of supplemental material or any part of supplemental material shall be sent directly to the copyright owner as specified in the copyright notice associated with the article.