
Abstract
Objective
Optimal metabolically healthy status is important to prevent various chronic diseases. This study investigated the association between lifelog-derived physical activity and metabolically healthy status.
Methods
This cross-sectional study included 51 Korean adults aged 30–40 years with no history of chronic diseases. Physical activity data were obtained by the International Physical Activity Questionnaire-Short Form (IPAQ-SF). Lifelog-derived physical activity was defined by step counts and walking speed for 1 week, as recorded by the Samsung Health application on both the Samsung Galaxy Fit2 and mobile phones. Participants without metabolic syndrome components were categorized as the metabolically healthy group (n = 31) and the remaining participants as the metabolically unhealthy group (n = 20). Prevalence ratios and 95% confidence intervals were estimated using Poisson regression models. The predictive ability of each physical activity measure was evaluated according to the area under the curve (AUC), net reclassification improvement (NRI), and integrated discrimination improvement (IDI) values.
Results
Among the physical activity measures, lifelog-derived walking speed was significantly inversely associated with prevalent metabolically unhealthy status. The lifelog component model including walking speed, age, and sex had the highest AUC value for metabolically unhealthy status. Adding lifelog-derived step counts to the IPAQ-SF-derived metabolic equivalent (MET) model (including age, sex, and IPAQ-SF-METs) yielded 37% and 13% increases in the NRI and IDI values, respectively. Incorporating walking speed into the IPAQ-SF-derived MET model improved metabolically unhealthy status prediction by 42% and 21% in the NRI and IDI analyses, respectively.
Conclusions
Slow walking speed derived from the lifelog was associated with a higher prevalence of metabolically unhealthy status. Lifelog-derived physical activity information may aid in identifying individuals with metabolic abnormalities.
Keywords
Introduction
The increasing prevalence of metabolic syndrome (MetS) is a major public health problem worldwide because it is associated with an increased risk of developing type 2 diabetes, cardiovascular disease, cancer, and other complications.1–3 Although even a single metabolic abnormality can increase the risk of cardiovascular and non-cardiovascular diseases, 4 the prevalence of optimal metabolic health is alarmingly low.5,6 Preventing even a single metabolic abnormality is important because each component of MetS can increase the risk of developing diabetes, cardiovascular disease, and certain types of cancer.7,8 The adoption of a healthy lifestyle that includes regular physical activity and a healthy diet is the recommended strategy for preventing metabolic abnormalities and promoting overall health,2,9–12 but there are limitations to objectively understanding a patient's daily physical activity and intervening to manage it outside of the hospital.
In recent years, wearable devices and mobile applications have facilitated the easy collection of objective measurements of physical activity, 13 such as step counts and walking speed, which are strongly associated with health outcomes, including type 2 diabetes, cardiovascular mortality, and all-cause mortality.14,15 Lifelog information is digitally tracking and recording of personal data generated through individual activities and behavior, and this collected lifelog information has the advantage of not being restricted in location. 16 Some studies have shown that lifestyle interventions using lifelog-derived physical activity were effective in reducing MetS components among individuals with and without MetS.11,12 However, most of the previous studies have been limited to groups with diseases such as MetS patients, not healthy groups, and research results on walking speed are insufficient.11,12 Furthermore, data on the incremental predictive role of lifelog physical activity, such as step counts or walking speed, on metabolic health compared with that of the validated traditional assessment of physical activity using a questionnaire are limited.
We aimed to investigate whether physical activity measures based on life-logging are predictive of metabolically unhealthy (MUH) status and whether this information improves the prediction of MUH status when combined with traditional questionnaire-based measures of physical activity.
Methods
Study population
Participants were recruited from the Kangbuk Samsung Health Study, a cohort study of Korean adults who underwent comprehensive health examinations at the Kangbuk Samsung Hospital Total Healthcare Center clinics in Seoul, South Korea, as a part of the Korean Healthcare Bigdata showcase project (the K-HBS project). 17 The K-HBS project was designed to create a comprehensive system for producing, collecting, and using various healthcare data such as medical examination results, surveys, and lifelog data from healthy individuals and those with chronic diseases over a three-year period from 2020 to 2022. This study specifically focused on healthy individuals and utilized lifelog data collected in the second year of the K-HBS project. The first year was primarily dedicated to gathering health screenings and survey data, while also preparing for the collection of lifelog data. This preparation involved selecting suitable wearable devices, establishing measurement protocols, and conducting pilot tests. Subsequently, the actual collection of lifelog data commenced in the second year of the project. Throughout the study period, no specific interventions were made based on the lifelog data.
We recruited individuals aged ≥19 years from Kangbuk Samsung Hospital General Health Checkup Center, who consented to participate in the K-HBS project until 2022 and could provide voluntary informed consent independently, without legal representation. This subsample included apparently healthy participants without chronic diseases. Individuals with any of the following diseases were excluded: history of hypertension, diabetes, hyperlipidemia, chronic renal failure, cirrhosis, cardiovascular disease, and cancer. Individuals who regularly take medication for chronic diseases were also excluded. Accordingly, we recruited 106 individuals at the start of the K-HBS project. And in the second year of the project we provided Galaxy Fit 2 devices to participants for lifelog measurements. We identified individuals who underwent a comprehensive health examination at Kangbuk Samsung Hospital in 2021 who were willing to wear the wearable device for 1 week and share their collected data with us. The participants provided written informed consent for the use of their health screening and lifelog data for research purposes. A total of 69 participants provided lifelog measurements; however, 18 were excluded, including 16 participants who had less than 5 days of lifelog data covering both weekdays and weekends, and two participants due to errors in their metabolic equivalents (METs) data, showing implausibly high physical activity levels exceeding 10,000 METs per week (Figure 1). The final analysis included 51 individuals (24 men and 27 women). The study design, protocol, and consent procedures were reviewed and approved by the Institutional Review Board of Kangbuk Samsung Hospital (IRB no. KBS12089); the study was conducted in accordance with the Declaration of Helsinki of 1975.

Flowchart of study participant selection.
Data collection
Demographic characteristics, health behaviors, physical activity, medical history, and medication use were collected using standardized, structured, self-administered questionnaires. Physical and laboratory parameters were measured by trained nurses and technicians. Blood pressure (BP) was measured three times by trained nurses using automated equipment (53000-E2; Welch Allyn, NY, USA), and the average of the second and third recordings was used for analysis. Fasting blood tests were conducted to measure lipid profiles, glucose levels, and hemoglobin A1C levels. Anthropometric variables including height, weight, and waist circumference were measured, and body mass index (BMI) was calculated using height and weight.
Physical activity was assessed using the validated Korean version of the International Physical Activity Questionnaire-Short Form (IPAQ-SF). 18 Total physical activity was quantified in METs-minutes per week (MET·min/wk) based on the formula provided by the IPAQ-SF. METs are commonly used to express the intensity of physical activities.19,20 1 MET is equivalent to 3.5 mL oxygen per 1 kg body weight per min, which is the amount of oxygen consumed at rest. 21 We applied 8.0 METs to vigorous-intensity activities, 4.0 METs to moderate-intensity activities, and 3.3 METs to walking. 18 The total METs·min/wk were calculated as duration × frequency per week × MET intensity, which were summed across activity domains to produce a weighted estimate of total physical activity from all reported activities per week. 19 The “low” activity group had the lowest total physical activity level (<600 METs min/wk), the “moderate” activity group achieved at least 600 METs min/wk but < 3000 METs min/wk and the “high” activity group achieved at least 3000 METs min/wk.18,19 We classified the activity groups into the minimally (low or moderate) active and health-enhancing physically (high) active based on the World Health Organization recommended moderate level of 3000 METs min/wk. 22 Smoking status was defined as never, former, or current smoker. Drinking data were obtained from questionnaires provided by the National Health Insurance Service. The questionnaires recorded the frequency of alcohol consumption and the quantity consumed per session in standard units, without differentiation between weekdays and weekends.23,24 From these responses, the average daily alcohol consumption was calculated for each participant, reflecting the reported frequency and quantity of alcohol intake per occasion. Finally, the average alcohol consumption was classified into light drinking (0.1–<10 g/day) and moderate or above drinking (≥10 g/day). 24
Lifelog-derived physical activity was defined by step counts and walking speed for 1 week, as recorded by the Samsung Health application on both the Samsung Galaxy Fit2 smartwatch (Samsung, Suwon, Korea) and mobile phones.25–27 The smartwatch automatically collects walking information in real time and stores it on the mobile phone application. All participants wore the smartwatch on their wrists for 1 week and participants who agreed to provide lifelog data downloaded their lifelog data directly from the Samsung Health application and delivered it to us in a compressed file format. As participants carried both mobile phones and smartwatches simultaneously, there were three types of lifelog data we received: data exclusively measured by mobile phones, data solely measured on smartwatches, and data combined from both mobile phones and smartwatches that are automatically and technically integrated. Recognizing the potential for untracked physical activity if devices were not worn, we used integrated data from both mobile phones and Galaxy Fit 2 devices to ensure a more comprehensive capture of physical activity. The time variable indicates the date of the summarized step count data in milliseconds, which were converted to a readable date format. The speed variable indicates the speed in meters per second during an activity. To account for potential differences in lifestyle habits between weekdays and weekends, we collected data for at least a week. We found that the average step counts and walking speed were significantly different on weekdays versus weekends; therefore, we divided the variables accordingly for the analysis.
Metabolically healthy (MH) and MUH status defined
MetS is a multifaceted condition characterized by a combination of interrelated elements that heighten the risk of atherosclerotic cardiovascular diseases and type 2 diabetes mellitus.28,29 The established components of MetS are increased waist circumference, elevated BP, high triglycerides, low high-density lipoprotein cholesterol, and glucose intolerance, the presence of at least three of the risk factors is generally accepted to diagnose MetS.
28
We defined the MUH group as meeting any of the diagnostic criteria for MetS proposed by the National Cholesterol Education Program Adult Treatment Panel III
29
:
the presence of central obesity (waist circumference ≥ 90 cm in men and ≥ 80 cm in women); triglyceride level ≥ 150 mg/dL; high-density lipoprotein cholesterol < 40 mg/dL in men and < 50 mg/dL in women; systolic BP ≥ 130 mmHg, diastolic BP ≥ 85 mmHg or antihypertensive medication use; fasting plasma glucose ≥ 100 mg/dL or use of oral hypoglycemic agents and/or insulin.
Patients who did not exhibit any MetS components were categorized into the MH group.
Statistical analysis
The characteristics of the MH and MUH groups are presented. All data are presented as means (standard deviations), medians (interquartile ranges), or frequencies (percentages), as appropriate. Considering the small sample size of each group (less than 30), we used the Mann–Whitney U test to compare continuous variables between the two groups. Fisher's exact test was used to compare categorical variables. Poisson regression models were used to estimate the prevalence ratios and 95% confidence intervals (CIs) for prevalent MUH status according to the physical activity category (mean METs, step counts, and walking speed). Initially, we estimated the age- and sex-adjusted prevalence ratio and then further adjusted for BMI. To evaluate the predictive ability of physical activity measures for estimating MUH status and to determine the incremental improvement achieved by adding lifelog measures (step counts and walking speed) to conventional measures (IPAQ-SF-derived physical activity), we assessed the area under the curve (AUC), net reclassification improvement (NRI) and integrated discrimination improvement (IDI) values. Each physical activity variable had a different scale; therefore, standardized values were used in the models. All analyses were conducted using STATA software (version 17.0; StataCorp LLC, College Station, TX, USA), and statistical significance was defined as a two-sided p-value < 0.05.
Results
The characteristics of the 51 study individuals (31 in the MH group and 20 in the MUH group) according to their metabolic health status are shown in Table 1. Individuals with MUH status were more likely to be older than men with unfavorable metabolic profiles. Compared with individuals categorized into the MH group, individuals categorized into the MUH group had higher physical activity levels based on the IPAQ-SF questionnaire but lower lifelog-derived step counts on both weekdays and weekends; however, these associations were not statistically significant (Table 1).
Baseline characteristics by metabolically healthy status among 51 healthy individuals.

Data are presented as means ± standard deviations.
Data are presented as medians (interquartile ranges) or percentages.
≥ 10 g of ethanol per day.
Abbreviations: MUH: metabolically unhealthy; BMI: body mass index; BP: blood pressure; LDL-C: low-density lipoprotein cholesterol; HDL-C: high-density lipoprotein cholesterol; HbA1c: hemoglobin A1C; METs: metabolic equivalents
Table 2 presents the age- and sex-adjusted prevalence ratios (95% CIs), which were further adjusted for BMI for prevalent MUH status for every one standardized unit of each physical activity measure. The IPAQ-SF-derived METs were inversely associated with MUH status, although this association did not reach statistical significance, with a multivariable-adjusted prevalence ratio (95% CIs) of 0.98 (95% CI 0.85–1.13) per 1-standard deviation (SD) MET increase (Table 2). Similarly, no significant associations were observed between weekday or weekend step counts and prevalent MUH status (multivariable-adjusted prevalence ratio 0.99, 95% CI 0.75–1.31 per 1-SD step count increase on weekdays; multivariable-adjusted prevalence ratio 1.01, 95% CI 0.74–1.37 per 1-SD step count increase on weekends) (Table 2). Weekday walking speed was inversely, but not significantly, associated with MUH status (multivariable-adjusted prevalence ratio, 0.75; 95% CI 0.52–1.09 per 1-SD walking speed increase on weekdays), whereas weekend walking speed was inversely and significantly associated with MUH status, with a multivariable-adjusted prevalence ratio of 0.65 (95% CI 0.46–0.93) per 1-SD walking speed increase on weekends (Table 2).
Association of IPAQ-SF and lifelog-derived physical activity levels with prevalence of metabolically unhealthy status.

Abbreviations: CI: confidence interval; IPAQ-SF: International Physical Activity Questionnaire-Short Form; METs: metabolic equivalent of task.
Separate models were used to estimate the prevalence ratio for each one-standard deviation increase in each physical activity measure.
Poisson regression models incorporating robust variance were employed to determine the prevalence ratios (95% CIs) for metabolically unhealthy status.
Adjusted for age, sex, and body mass index.
These indicate statistically significant results (Age- and Sex-adjusted PR 0.68, p = 0.03; Multi variable-adjusted PR 0.65, p = 0.02.
Table 3 and Figure 2 indicate that the AUC value for MUH status was 0.69 (95% CI 0.55–0.84) in the model comprising age, sex, and IPAQ-SF-derived METs. The highest AUC value for MUH status was observed in the model including age, sex, and lifelog-derived walking speed, with an AUC of 0.75 (95% CI 0.61–0.89). However, the difference in AUC values between the IPAQ-SF-derived METs and lifelog-derived models was not statistically significant.

AUCs for the prediction of MUH status by physical activity variables. (a) AUC for MUH status in crude model. (b) AUC for MUH status in model including age and sex.
Comparison of AUC values for METs, step counts, and walking speed for participants with metabolically unhealthy status.
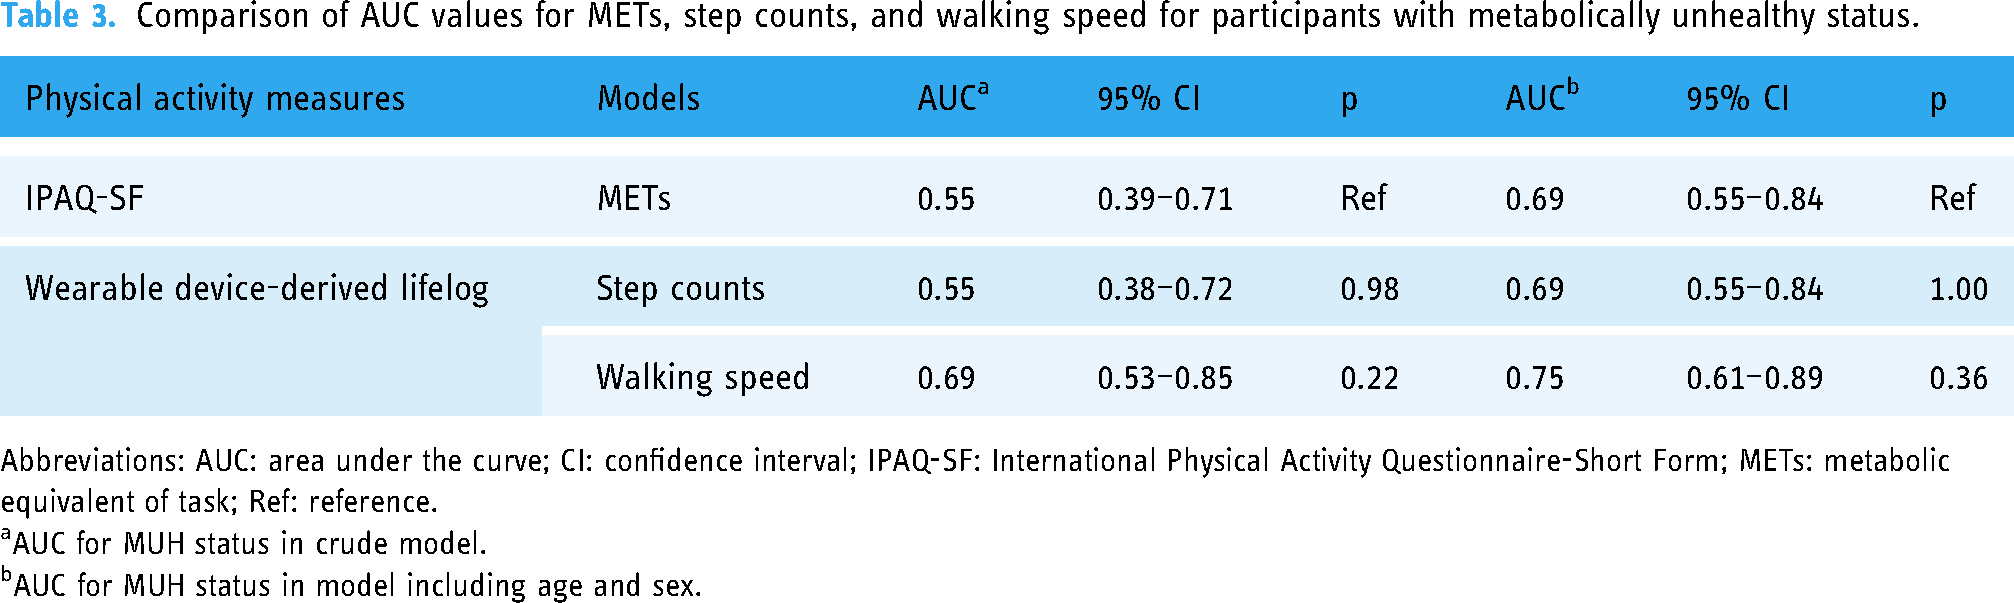
Abbreviations: AUC: area under the curve; CI: confidence interval; IPAQ-SF: International Physical Activity Questionnaire-Short Form; METs: metabolic equivalent of task; Ref: reference.
AUC for MUH status in crude model.
AUC for MUH status in model including age and sex.
Table 4 presents the AUC, NRI, and IDI indices to evaluate the improvement of risk prediction after adding the lifelog variables to the BASE model including that includes age, sex, and IPAQ-SF-derived METs. For the NRI analysis, the cutoff probability for the risk category was set at 39.22%, corresponding to the prevalence of MUH status among our study participants, which was noted in 51 individuals.
Comparison of physical activity-based models for prevalence of metabolically unhealthy status.

Abbreviations: AUC: area under the curve; NRI: net reclassification improvement; IDI: integrated discrimination improvement; CI: confidence interval; IPAQ-SF: International Physical Activity Questionnaire-Short Form; METs: metabolic equivalent of task; Ref: reference.
In the AUC analyses, the AUC for the BASE model including age, sex, and METs was 0.69 (95% CI 0.55–0.84). When step counts or walking speed were added individually to the BASE model, the AUC values increased to 0.72 (95% CI 0.57–0.86) and 0.75 (95% CI 0.61–0.89), respectively. Including both step counts and walking speed resulted in an AUC of 0.76 (95% CI 0.62–0.90). However, the differences in AUC values between the BASE model and the models including the additional lifelog parameters (individually or combined) were not statistically significant. By contrast, in the NRI and IDI analyses, the models that included step counts (NRI 0.37, p = 0.09; IDI 0.13, p < 0.01) and walking speed (NRI 0.42, p = 0.03; IDI 0.21, p < 0.01) individually, as well as the models that included both (NRI 0.43, p = 0.04; IDI 0.23, p < 0.01), significantly improved risk prediction compared with that of the BASE model (Table 4).
Discussion
In this study of apparently healthy adults, we evaluated whether daily step counts and walking speed derived from wearable devices could predict metabolic health. Among the different physical activity measures, walking speed as measured by lifelog was significantly associated with metabolic status but not step counts, and was particularly associated with weekend walking speed only and not with weekday walking speed. Moreover, when lifelog components such as walking speed or step counts were included in the metabolic health prediction model, it significantly improved the prediction of metabolic health. These findings indicate that lifelog-derived physical activity data can help identify individuals with MUH status.
Walking is effective in reducing weight and improving clinical indicators such as visceral fat area, insulin resistance, waist circumference, body fat percentage, and BMI.30–32 In addition, recent studies have shown that lifelog data objectively collected with sensors in phones or other wearable devices are valuable for managing chronic diseases that require behavior change.12,25,33,34 Lee et al. demonstrated that physical activity intervention using digital healthcare devices is also effective in preventing MetS in participants with one or two MetS risk factors, showing significant reductions in waist circumference and BP. 25 Therefore, if healthcare providers utilize these lifelog data for disease prediction or follow-up, the effectiveness of patient behavioral change efforts and disease prevention can be enhanced. However, using this life-logging physical activity information can be challenging because of the uncertainty in the data captured by mobile devices and the lack of developed data standardization methods. 35 Few studies have evaluated whether daily step counts and walking speed measured by wearable devices are as appropriate as METs, an existing physical activity evaluation index. Therefore, we compared the BASE model, which included age, sex, and METs as predictors; the model was obtained by incorporating step counts or walking speed into the BASE model. The combined model, incorporating METs with step counts or walking speed, exhibited superior predictive ability for MUH status compared with that of the BASE model. Lifelog data, step counts, and walking speed are imperfect predictive markers for MUH status; however, they have advantages for metabolic status management as they can objectively reflect the physical activity levels during daily life. Notably, we found that walking speed, as measured by the lifelog, was a better predictor of metabolic health than step counts and METs. Regarding the association between walking speed and the prevalence of MUH status, weekend walking speeds were significantly and inversely associated with MUH status, and this association was independent of BMI, a strong predictor of metabolic health. 36 Our findings also suggest that walking speeds on weekends rather than during the weekdays were positively associated with metabolic health. Inconsistent findings exist regarding the variance between weekday and weekend physical activity and its health implications. 37 While weekdays often involve physical activity related to work and commuting, weekends typically allow for more leisure-based activities. The IPAQ-short form used in our study does not differentiate between work, transportation, and leisure activities, unlike the Global Physical Activity Questionnaire, 38 which may explain why weekend walking speed specifically predicts metabolic health, distinct from other metrics like weekday walking speed and step counts. In our study, weekend walking speed likely provides a more accurate representation of leisure time physical activity and overall physical functioning, less impacted by compulsory work-related movements, and more indicative of voluntary physical engagement and capacity. Walking speed is acknowledged as a reliable measure of physical function and overall health in both healthy and older adults because it involves multiple organ systems, including the cardiovascular, respiratory, nervous, and musculoskeletal systems.15,39 To better understand the nuances of physical activity's impact on health, future research should utilize a lifelog physical activity survey with detailed disaggregation, capturing variations in physical activity between weekdays and weekends, and across different types of activities such as work, transportation, and leisure. Therefore, not only step counts but also walking speed should be considered to prevent and improve metabolic abnormalities in healthy individuals.
Our study had several limitations. First, the sample size was small. Future studies with larger sample sizes are required to validate our findings. Second, we focused only on analyzing step counts and walking speeds from the lifelogs while excluding other sleep and meal records. Unlike step counts and walking speed data, which can be automatically recorded, these components require active patient participation for accurate documentation. Future studies that incorporate more comprehensive lifelog information, including sleep and meal records, may provide helpful insights. Utilizing recorded step information regardless of the patient's participatory effort may be more practical and valuable in real-world settings. Third, we neither selected nor manipulated the participant's phone model or the location of the phone during measurements. The accuracy of the Samsung Health application in capturing physical activity data may vary depending on the mobile phone model, its placement on the body, and the type of gait.26,27,40,41 Nevertheless, among the various metrics recordable by wearables, the step counts and distance have been recognized as reliable indicators for health assessment using wearable devices. 42 Moreover, the Samsung Health measurements application has been validated for its accurate measurement of walking activities, reinforcing its applicability in our study.26,40 Finally, while our study focused on young and middle-aged Koreans, limiting its generalizability to other demographics, it is important to note the growing utility of lifelog data in epidemiological and intervention studies due to its objective, continuous, and comprehensive view of the patient's condition outside clinical settings. There are ongoing efforts to incorporate lifelog data into clinical practice for elderly populations or those with chronic diseases. 43 Walking speed, whether measured in clinical settings, research, or self-reported, is associated with survival rates among the elderly and is recognized as an important predictor of longevity in this demographic.15,44–46 In addition, many previous studies have already shown that increased walking speed among patients undergoing rehabilitation following stroke, myocardial infarction, or heart failure is associated with a reduced risk of cardiovascular events, all-cause hospitalization, or mortality.47–50 Extending our findings to older adults or patients with cardiovascular risk, who are already known to benefit from gait speed assessments for prognosis prediction, could enhance healthcare outcomes using lifelog-derived walking speed. Consequently, future research should aim to validate this hypothesis and further explore the characterization of lifelog physical activities across different groups to provide deeper insights.
Despite these limitations, our study highlights the potential utility of lifelog information, including walking speed, which has predominantly been studied in older populations, to predict metabolic health among apparently healthy and relatively young individuals.
Conclusions
Lifelog-derived daily step counts and walking speed were independent predictors of metabolic health status in Korean adults with an average age of 42.3 years. These variables also improved the prediction of metabolic health beyond the use of questionnaire-based METs alone. Notably, walking speed was the most influential predictor of metabolic health, suggesting that walking speed is an important component of lifelog-derived physical activity for improving metabolic health, even among relatively young and healthy individuals. Future studies are necessary to validate our findings and examine the potential of lifelog data in developing metabolic health prevention strategies to maintain metabolic health in apparently healthy populations.
Supplemental Material
sj-docx-1-dhj-10.1177_20552076241260921 - Supplemental material for Lifelog-based daily step counts, walking speed, and metabolically healthy status
Supplemental material, sj-docx-1-dhj-10.1177_20552076241260921 for Lifelog-based daily step counts, walking speed, and metabolically healthy status by Ga-Young Lim, Eunkyo Park, Ji-Young Song, Ria Kwon, Jeonggyu Kang, Yoosun Cho, Se Young Jung, Yoosoo Chang and Seungho Ryu in DIGITAL HEALTH
Supplemental Material
sj-docx-2-dhj-10.1177_20552076241260921 - Supplemental material for Lifelog-based daily step counts, walking speed, and metabolically healthy status
Supplemental material, sj-docx-2-dhj-10.1177_20552076241260921 for Lifelog-based daily step counts, walking speed, and metabolically healthy status by Ga-Young Lim, Eunkyo Park, Ji-Young Song, Ria Kwon, Jeonggyu Kang, Yoosun Cho, Se Young Jung, Yoosoo Chang and Seungho Ryu in DIGITAL HEALTH
Supplemental Material
sj-docx-3-dhj-10.1177_20552076241260921 - Supplemental material for Lifelog-based daily step counts, walking speed, and metabolically healthy status
Supplemental material, sj-docx-3-dhj-10.1177_20552076241260921 for Lifelog-based daily step counts, walking speed, and metabolically healthy status by Ga-Young Lim, Eunkyo Park, Ji-Young Song, Ria Kwon, Jeonggyu Kang, Yoosun Cho, Se Young Jung, Yoosoo Chang and Seungho Ryu in DIGITAL HEALTH
Supplemental Material
sj-docx-4-dhj-10.1177_20552076241260921 - Supplemental material for Lifelog-based daily step counts, walking speed, and metabolically healthy status
Supplemental material, sj-docx-4-dhj-10.1177_20552076241260921 for Lifelog-based daily step counts, walking speed, and metabolically healthy status by Ga-Young Lim, Eunkyo Park, Ji-Young Song, Ria Kwon, Jeonggyu Kang, Yoosun Cho, Se Young Jung, Yoosoo Chang and Seungho Ryu in DIGITAL HEALTH
Supplemental Material
sj-docx-5-dhj-10.1177_20552076241260921 - Supplemental material for Lifelog-based daily step counts, walking speed, and metabolically healthy status
Supplemental material, sj-docx-5-dhj-10.1177_20552076241260921 for Lifelog-based daily step counts, walking speed, and metabolically healthy status by Ga-Young Lim, Eunkyo Park, Ji-Young Song, Ria Kwon, Jeonggyu Kang, Yoosun Cho, Se Young Jung, Yoosoo Chang and Seungho Ryu in DIGITAL HEALTH
Supplemental Material
sj-doc-6-dhj-10.1177_20552076241260921 - Supplemental material for Lifelog-based daily step counts, walking speed, and metabolically healthy status
Supplemental material, sj-doc-6-dhj-10.1177_20552076241260921 for Lifelog-based daily step counts, walking speed, and metabolically healthy status by Ga-Young Lim, Eunkyo Park, Ji-Young Song, Ria Kwon, Jeonggyu Kang, Yoosun Cho, Se Young Jung, Yoosoo Chang and Seungho Ryu in DIGITAL HEALTH
Footnotes
Acknowledgments
The authors extend their gratitude to the study participants for their involvement and would like to acknowledge Professor Hyeoneui Kim (PhD, MPH, RN) for her invaluable assistance with the interpretation of lifelog data.
Contributorship
All the authors reviewed the literature and conceived the study and protocol. JYS was involved in obtaining ethical approval. JYS and RK were recruited participants. GYL and EP contributed to the preprocessing of the raw data. GYL, EP, JK, Y. Cho, SYJ, Y. Chang, and SR analyzed the data. Y. Chang and SR supervised the study. GYL and EP wrote the first draft of the manuscript. All authors interpreted the results, contributed to critical revisions of the manuscript, and approved the final version of the manuscript.
Declaration of conflicting interests
The authors declared no potential conflicts of interest with respect to the research, authorship, and/or publication of this article.
Ethical approval
The Institutional Review Board of Kangbuk Samsung Hospital approved the design, protocol, and consent procedures for this study [IRB no. KBS12089].
Funding
The authors disclosed receipt of the following financial support for the research, authorship, and/or publication of this article: This work was supported by the Korean Healthcare Bigdata showcase Project by the Korea Disease Control and Prevention Agency in the Republic of Korea [no. 4800-4848-501].
Guarantor
SR.
Supplemental material
Supplemental material for this article is available online.
References
Supplementary Material
Please find the following supplemental material available below.
For Open Access articles published under a Creative Commons License, all supplemental material carries the same license as the article it is associated with.
For non-Open Access articles published, all supplemental material carries a non-exclusive license, and permission requests for re-use of supplemental material or any part of supplemental material shall be sent directly to the copyright owner as specified in the copyright notice associated with the article.