
Abstract
Objectives
Overeating interventions and research often focus on single determinants and use subjective or nonpersonalized measures. We aim to (1) identify automatically detectable features that predict overeating and (2) build clusters of eating episodes that identify theoretically meaningful and clinically known problematic overeating behaviors (e.g., stress eating), as well as new phenotypes based on social and psychological features.
Method
Up to 60 adults with obesity in the Chicagoland area will be recruited for a 14-day free-living observational study. Participants will complete ecological momentary assessments and wear 3 sensors designed to capture features of overeating episodes (e.g., chews) that can be visually confirmed. Participants will also complete daily dietitian-administered 24-hour recalls of all food and beverages consumed.
Analysis
Overeating is defined as caloric consumption exceeding 1 standard deviation of an individual's mean consumption per eating episode. To identify features that predict overeating, we will apply 2 complementary machine learning methods: correlation-based feature selection and wrapper-based feature selection. We will then generate clusters of overeating types and assess how they align with clinically meaningful overeating phenotypes.
Conclusions
This study will be the first to assess characteristics of eating episodes in situ over a multiweek period with visual confirmation of eating behaviors. An additional strength of this study is the assessment of predictors of problematic eating during periods when individuals are not on a structured diet and/or engaged in a weight loss intervention. Our assessment of overeating episodes in real-world settings is likely to yield new insights regarding determinants of overeating that may translate into novel interventions.
Introduction
More than a third (42.4%) of US adults have obesity, 1 which can contribute to increased risk of chronic diseases and their associated healthcare costs. 2 Frequent overeating (i.e., consistent intake of excess kilocalories) relative to need is a risk factor for obesity. 3 Behavioral studies on overeating often focus on a single putative causal mechanism or proximal determinant (e.g., stress, emotion, environment).4,5 However, recent advances in wearable sensing have enabled researchers to identify more complex feature patterns that characterize episodes of excess calorie intake.6–8 This approach increases researchers’ ability to detect excess energy intake with respect to various behavioral phenotypes (e.g., emotional eating, mindless eating) that have different treatment implications.9,10 Through the study design described in this paper, we will apply a new objective sensing system to characterize overeating phenotypes and identify in-the-moment predictors of overeating. We lay groundwork to detect, predict, and intervene in a manner that adapts to an individual's problematic overeating profile, thus paving the way toward personalized behavioral medicine interventions.
Previous sensing systems advanced the field of overeating in that they were designed to capture proxies for eating episodes such as feeding gestures, chewing activity, and swallows. These activities were captured using varying sensing modalities ranging from the use of sound waves around the ear and visual cues of the behavior, all the way to the movement of the hand and vibrations at the temporalis muscle.8,11,12 Yet these devices: (1) were only tested in a controlled laboratory setting, which limits external validity 13 ; (2) required heavy participant burden (e.g., participants taped sensors on their bodies 14 or had to turn the system on and off during eating 15 ); and (3) did not capture meaningful and interpretable features about the physical and psychological contexts of eating episodes. 16 To address these challenges, we use the SenseWhy passive eating detection system to gain new insight into overeating episodes. SenseWhy comprises a well-tested customizable neck-worn sensor (NeckSense),7,11,17,18 location through GPS, Ecological Momentary Assessments (EMAs), and an advanced privacy-sensitive video camera with infrared sensing to enable heat signatures (chest-mounted to collect visual confirmation of diet, behavior, and the environment). Our current observational study will apply this system to all eating episodes in a free-living setting, in hopes of identifying overeating episodes within the context of an individual's daily life.
A rapidly growing body of research has begun to characterize predictors of problematic eating behaviors, including overeating episodes, using EMA. In these studies, self-reported affect,19–21 environmental triggers (e.g., social cues, presence of palatable foods, meal location),20,22 and cravings/hunger have been found to be associated with dietary lapses,20,23 eating unhealthy foods, 21 and/or overeating. 19 By virtue of its collection of real-time contextual data surrounding overeating episodes, the SenseWhy system will yield new insights about the predictors and characteristics of overeating episodes, building on previous studies using EMA to investigate the determinants of eating behavior.24,25 The present study will extend previous research by evaluating a wide range of passively detected features of eating episodes and EMA reports of eating behavior, specifically in the contextual factors of eating among those with obesity. By using these passive features, along with 24-hour dietary recalls, this study will address concerns about the underreporting of eating episodes when event-contingent sampling is used. 25
We will also use the SenseWhy system to detect problematic eating phenotypes that are identified by causal mechanisms or proximal determinants. Many people engage in emotional eating (or stress eat) as a means of dealing with psychological stress, as opposed to satisfying hunger. Eating in the absence of hunger (EAH) refers to the susceptibility to eat despite being satiated, often in response to the presence of palatable snack foods, which is associated with weight gain over 2 months. 26 EAH has been shown to be highly related to hedonic eating, 27 which refers to one's desire to consume food for pleasure in the absence of caloric need. Cognitive restraint refers to the conscious restriction of food intake in order to control body weight or promote weight loss. 28 Uncontrolled eating refers to the tendency to eat more than usual because of loss of control. Unplanned (over)eating refers to an individual eating more than what was originally intended and can be due to many reasons mentioned above including positive social interactions, negative emotions, or physiological craving. 29 Mindless eating often occurs when the mind is distracted and the person is not aware of what or how much food he or she is consuming. Mindless eating is associated with environmental factors, such as screen time and presence of food advertisements, and internal factors, such as disinhibition (due to boredom), lack of awareness (the mind is racing about what one needs to do), and emotional eating. 30 Night eating is a condition where people eat large amounts of food after dinner, often waking up during the night to eat. As described above, several of these problematic eating types overlap. However, it remains unknown how much they overlap, whether they share common causes, and which phenotypes are automatically detectable. Through the SenseWhy system, we will be able to assess characteristics of eating episodes that are indicative of these phenotypes, as well as predictors of these various types of eating episodes. For instance, perhaps mindless eating is also accompanied by high amounts of stress. Redefining overeating behavioral phenotypes in a way that is automatically detectable will pave the way for developing and testing timely and adaptive interventions.
Within a 14-day observational study of eating episodes of adults with obesity, the primary aim of this project is to identify a subset of automatically detectable features that predict overeating episodes and distinguish them from eating episodes in which overeating was not present. EMA reports of affect, stress, hunger, and contextual factors, along with passively detected features (e.g., time, feeding gestures), will be analyzed via machine-learning algorithms to determine which features, both individually and jointly, predict overeating. These analyses with be performed using both isolated and combined data collected from EMA and passive detection. This integrated approach will allow us to determine whether and how predictions of overeating (vs. nonovereating) episodes change based on data sources. The secondary aims are to use the data to (1) build clusters of eating episodes that identify problematic overeating behaviors (e.g., stress eating, social eating, and night eating) and (2) explore new overeating phenotypes based on social (with friends, family, alone, etc.) and psychological (affect, craving) features that make up the overeating clusters.
Methods
Power calculation
Using a mixed effects model, we calculated an interclass correlation (ICC) based on a prior BeYourself overeating study of 20 participants across 14 days (ICC = 0.01). Using a Monte Carlo simulation run in R to test the power of detecting within-subject variability of overeating episodes, 3 eating episodes a day (assuming base rate of overeating with no exposure to stress is 12% and proportion of eating episode that are overeating episodes with exposure of stress is 19%), a sample size of 60, and 10 days of eating (an average given 7 [minimum eligibility] to 14 [maximum] days) will achieve 80% power to detect within-subject variability of overeating. We used stress as an example variable; however, this power will be true for any time-varying variable. We will use binary variables for stress and overeating as a conservative estimate, and we believe we will have even greater power when using the original nonbinary version of the data.
Participants
We will recruit up to 60 participants. Eligible participants will be adults with obesity (body mass index [BMI] ≥ 30 kg/m2) between the ages of 18 and 65 years who reside in the Chicago Metropolitan Area, own a smartphone, and have wireless internet at their residence. Participants will be excluded if they are currently dieting with the goal of losing weight, have lost 15 or more pounds in the previous 3 months, are or plan to become pregnant, have received or plan to receive bariatric or lap band surgery, currently taking any medication that causes weight loss, have a genetic weight loss disorder (e.g., Prader–Willi, Bardet–Biedl, Cohen syndrome), or have an active eating disorder. We will also exclude participants found to be susceptible to loss-of-control (LOC) eating when screened via interview because LOC eating is strongly connected to binge eating and other mental health disorders. As a result, inclusion of patients with LOC eating warrants a separate study and likely requires more intensive intervention than we anticipate building through our mobile eating detection systems.
Recruitment
Participants will be recruited on a rolling basis using online advertisements hosted on Craigslist.com, ResearchMatch, and TheNewNormal. Respondents who complete the REDCap 31 web screener will be contacted by the study team if their provided information aligns with the study's eligibility criteria. The flow from recruitment to all other phases of the study is depicted in Figure 1.

Study procedures from screening to trial conclusion. Procedures are listed in the top row and described in the bottom row. Abbreviations: BMI, body mass index; EMA, ecological momentary assessment.
Telephone screening
Respondents will be assessed for disordered eating behaviors with multiple validated measures. The eating disorder module of the Patient Health Questionnaire (PHQ) 32 will assess the presence of active eating disorders. 33 Additionally, a trained investigator will administer the loss of control assessment of the Eating Disorder Examination (EDE). 34 The combination of PHQ self-report items and investigator follow-up questions drawn from the EDE is considered the gold-standard approach to the assessment of disordered eating behaviors. 35 If any disordered eating behaviors are present during screening, the respondent will be excluded from participation in the study. Otherwise, participants will be scheduled for a baseline appointment.
We will exclude participants with clinically defined eating disorders to focus our efforts on the more generalizable cases of overeating that occur in absence of a clinically significant behavioral or psychiatric disorder. Further, studying eating behaviors of individuals with eating disorders would require additional oversight and safeguards to prevent measures from causing harm or distress.
In-person baseline appointment
Upon participants’ arrival at the lab, informed consent will be conducted as approved by the institutional review board. The study coordinator will collect 1 weight and 3 height measurements using a standard analog scale (Detecto mechanical eye-level physician scale with height bar). The weight measurement and the mean of the height measurements will be used to calculate BMI, confirming that the participant indeed meets the study criteria of BMI ≥ 30 kg/m2, at which point they will be officially enrolled in the study.
Once enrolled, participants will be instructed on the use of all study technology.
FoodTrck app. After downloading the FoodTrck eating-recording app from its appropriate public listing (see Appendix), participants will log in and complete an entry of a meal that the study team will give them in lab. Participants will receive teaching and supervision as they use the FoodTrck app before and after the in-lab eating episode (described below and in Figure 2).

The 3 elements of an eating episode recording in the FoodTrck mobile app. Participants complete the “Decided to” element when they make the decision to eat, typically before the prepared food is in front of them. “Decided to” contains an EMA targeting stress, affect, and food source. Participants complete the “About to” element immediately before eating. “About to” involves taking a photo of the eating episode and entering a simple description. Participants complete “After” immediately after eating. “After” includes both an EMA and a photograph of any leftovers or empty plates. Abbreviation: EMA, ecological momentary assessment.
Study devices. Participants will be introduced to the 4 study devices (i.e., necklace, smartwatch, infrared activity-oriented device [IR-AOD] that provides visual confirmation of the meals, and study phone) and instructed on their usage, including turning on each device, verifying device functioning, wearing the devices at the appropriate on-body position, ending recording, removing devices, and connecting the devices to their chargers. Participants will complete a “role-play” teaching exercise in which they practice the start-collection and end-collection procedures 3 times each. Lastly, participants will be informed of the circumstances in which they are allowed to remove the study devices (during water exposure, vigorous exercise, etc.).
Sync event. The sync event is intended to introduce an explicit synchronization point that is identifiable across sensor modalities to make sure all devices are capturing the same moment. Participants will be instructed on how to perform a sync event, 36 which they will be asked to complete daily, immediately following the start of each recording period. To establish ground truth for the time of day, participants will hold a smartphone application with a digital clock interface in the field of view of the IR-AOD, which captures the displayed time. Participants will then perform 3 gestures. The first gesture involves participants covering the necklace with their hand 3 times, for 1 second each time. This creates a series of 3 near-zero proximity measurements that can be easily spotted in the proximity signal output of the necklace as well as the synchronized IR-AOD video, which provides visual confirmation of the hand gesture. The second gesture involves participants clapping their hands in front of themselves (as if applauding) 3 times. These claps, as fast wrist motions followed by sudden stops, can be spotted in the smartwatch inertial measurement unit (IMU) signals as well as in the synchronized IR-AOD video, which provides visual confirmation of the clapping gesture. The final gesture involves participants either drinking from a glass or miming the action of drinking from a glass. This gesture appears in the output of all 3 sensors: appearing visually to the IR-AOD, appearing in the lean-forward angle (LFA) and proximity signal of the necklace, and appearing in the accelerometer (hand-to-mouth) and gyroscope (glass tilting) signals of the smartwatch.
In-wild phase
After the in-lab session is completed, the in-wild phase of the study will begin the following morning (see Figure 3). Participants will be instructed to wear the devices throughout all waking hours, answer questions and record all food and beverage consumption with the FoodTrck app, and complete an interviewer-administered 24-hour diet recall each day (beginning on day 2). Recalls will be initiated by the interviewer within the windows/window of availability provided to the study team by participants during the initial visit.

The sequence of events during the in-wild phase. Meals from days 1–14 are captured via diet recall on the subsequent day.
The experimenter will monitor participant adherence to these instructions by checking heartbeat notifications (an indication of what time each device was last turned on), FoodTrck entries, and diet recall completion. If adherence indicators are absent, the experimenter will contact the participant to determine the cause of the lapse and provide reminders and/or technical support as necessary. If a participant is unable to perform all 3 tasks (wear devices, record meals, and complete recalls) for at least 6 of the first 7 “run-in” in-wild days, the run-in period will be considered failed and the participant will be withdrawn from the study. After 14 days of in-wild collection conclude, participants will be asked to drop off the devices, have a final weight measurement taken, and complete a series of questionnaires (listed in Table 1 under “post survey” study element).
Measures employed in the study.

Measures
Devices
Infrared Activity-Oriented Device (IR-AOD). The IR-AOD is a wearable camera developed by the HABits Lab to maximize information collection and minimize user discomfort (both physical and psychological)37,38 and risks to privacy. 39 The IR-AOD is worn on a lanyard and secured to the upper-center area of the chest by a magnetic pad that connects to the back of the device behind the shirt/outermost layer of clothing. The top surface of the IR-AOD, a flat plane parallel to the ground, contains an upward-facing sensor array including a thermal infrared sensor, a red-green-blue (RGB) camera with a 180° fisheye lens, and a photoresistor-triggered infrared light emitting diode (IR-LED) as a source of illumination for night vision. Each sensor is directed toward the face and upper torso of the wearer. When the IR-AOD is turned on, all 3 sensors record continuously to an onboard memory card.
NeckSense. NeckSense is a neck-worn sensor device that is principally designed to capture and quantify chewing. NeckSense is worn on a short necklace-type lanyard and is positioned at the base of the neck. The top surface of the necklace, a flat plane parallel to the ground, hosts an upward-facing infrared proximity sensor that records at 20 Hz (20 measurements a second). The positioning of NeckSense at the base of the neck allows the proximity sensor to capture the mouth open/close status of the wearer by recording the distance between the device and the bottom of the chin. In addition to the proximity signal, NeckSense continuously records ambient light (LUX), lean-forward angle (LFA), and triaxial accelerometer data, saving all collected data to an onboard memory card.
Wrist-Based Recording System. The wrist-based recording system consists of a commercial Fossil Smartwatch loaded with a customized data collection app that makes use of the watch's onboard sensors. The watch is worn on the dominant wrist, positioned 2 finger lengths below the bottom of the palm. The wrist collection system records triaxial accelerometer data, triaxial gyroscope data, and photoplethysmography data. Each of these measurements is recorded at 20Hz and saved to the watch's onboard memory card. Each time the watch is charged, it transmits its data to a paired cell phone, which then transmits the data to a secure cloud server maintained by the research team.
App-delivered EMA surveys
The FoodTrck app will be installed on participant's personal phones and will facilitate both dietary self-reporting and the delivery of targeted EMAs. For each meal consumed during the study, participants will be asked to record 2 premeal surveys (“Decided To,” and “About To”) and 1 post-meal survey (“After”). To record a meal, snack, or beverage; the user creates a new entry on the FoodTrck home screen and begins completing the 3 surveys:
Decided To. Participants will be instructed to complete the “Decided to” survey as soon as possible after they have decided to eat/drink and know what they will eat/drink (but do not necessarily have the food/drink in front of them, ready to consume). The “Decided to” survey contains EMA items on food source, affect, and presence of biologic hunger or hedonic eating.
About to. Participants will be instructed to complete the “About to Eat” activity immediately prior to eating/drinking by taking a photo of all food/beverage items to be consumed and entering a descriptive name.
After. Participants will be instructed to complete the “After” survey immediately after they finish eating/drinking. The “After” survey involves taking a photo of the remaining food/drink or empty food/drink containers, entering a descriptive name, and answering questions about affect, cognitive restraint, uncontrolled eating, and contextual or environmental factors (e.g., eating alone or with others, watching T.V., whether at home or work).
Notes. At any time, participants will be able to add a note to any meal entry (past or present) by pressing the “notes” button and typing their message. Participants will be instructed to use this feature to fill in gaps of incomplete FoodTrck entries—that is, entries where the participant forgot 1 or more of the steps (such as forgetting to take an “after photo”)—by supplementing the missing information in the form of plain text.
Photo-assisted 24-hour diet recall
Starting on the second day of the free-living period, a 24-hour diet recall using the five-step Automated Multiple-Pass Method will be administered via telephone by a trained interviewer with nutrition expertise. 40 The objective of the 24-h recall is to collect a complete account of everything the participant consumed or drank the previous day. Before the call, dietitians will be able to access the photographs and food/drink descriptions recorded by participants using the FoodTrck app. The use of both self-logging (via FoodTrck) and recalls (via dietitian phone calls) serves to improve both the completeness of participants’ food records and the richness of the information collected about each eating episode. FoodTrck takes a simplistic, low-burden approach to food recording (requiring only a photo and basic name of each meal) so that participants are not overburdened by completing both EMAs and detailed food records during each FoodTrck use. The 24-hour recalls then provide greater detail about the foods, allowing the Nutritional Data System for Research (NDSR) database to return precise nutrient and kcal metrics for each meal. During the interview, the dietitian will complete steps that have been shown to enhance the accuracy of the recall, including (1) developing a quick list of foods and beverages consumed, (2) probing for commonly forgotten food items, (3) collecting time and name of each eating occasion, (4) collecting and reviewing details of food and beverages, and (5) completing a final probe. 41 Images from the FoodTrck app will assist with probes during steps 2–4. The “memory-jogging” exercises inherent to 24-hour diet recalls will also allow dietitians to record meals that were not recorded in FoodTrck, whether due to forgetting or other constraining factors of dietary self-logging. In this way, the FoodTrck records assist, but do not entirely dictate the content of the 24-hour recalls. Information gathered during 24-hour recalls will be analyzed using the NDSR, a research-based nutrition software developed to collect and analyze 24-hour diet recalls. 42
Post-surveys
Participants will complete 5 post-surveys when they return to the lab after the end of their in-wild phase. These surveys will collect baseline (i.e., without regard to a particular eating episode) information about participants’ eating behaviors, as well as feedback about the experience of using the wearable devices. For a complete list of the post-surveys (see Table 1).
Data processing
Alignment of multiple data sources
Data collected by wearable devices will be evaluated for synchronization by referencing the Sync Event at the beginning of each day. The time displayed on the cell phone (visible in the video data) provides the ground truth timestamp to which the data streams are compared and offsets are corrected. If a Sync event is missing for a given wear period, the evaluator will attempt to identify other natural occurrences of gestures that can be recognized across sensor modalities or compare the timestamp of a FoodTrck entry to the timestamp of the video frame in which the participant's completion of the entry appears. Once video timestamps are known to be aligned with the phone, the video timestamps will then be used as ground truth. These methods will allow us to establish accurate start and end times of activities, which is critical for building reliable machine-learning algorithms that detect human behaviors (e.g., feeding gestures, bites [see Table 2]) by learning from training data in which these behaviors are visually confirmed using multiple video annotators (Figure 4).
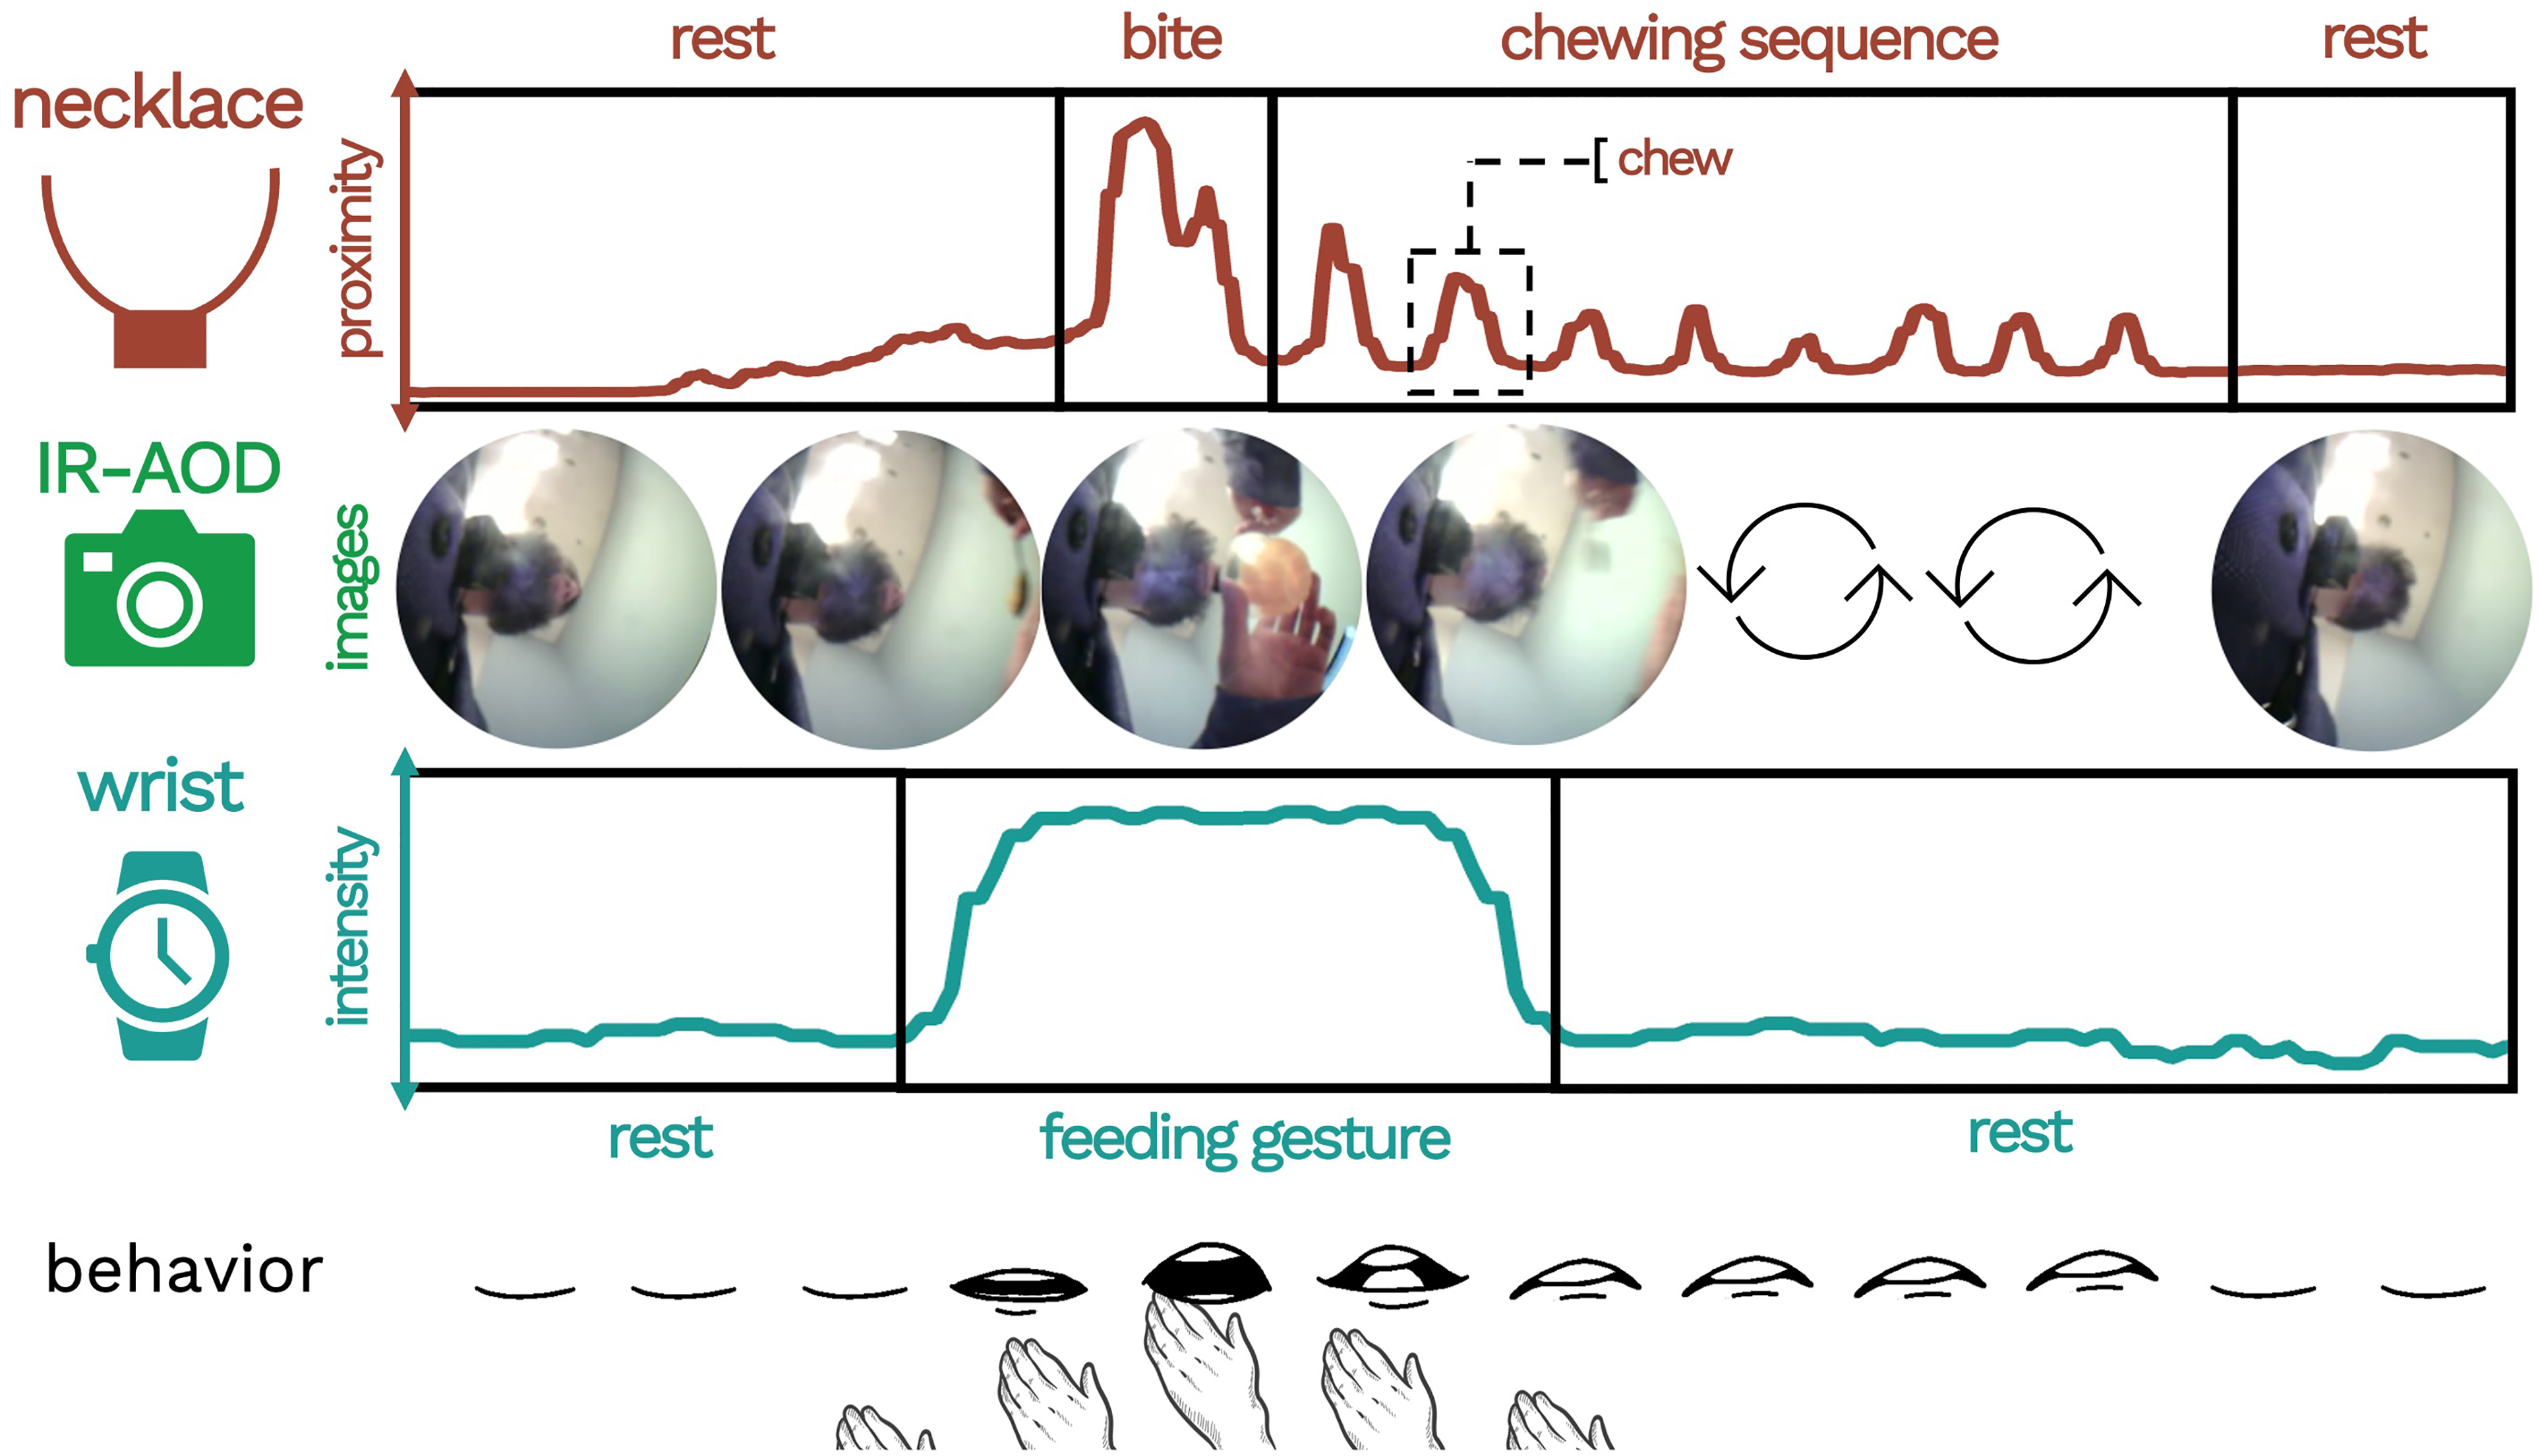
Example of an eating episode as characterized by the multi-sensor system.
Features of meals collected by study measures.

Note. Self-report measures will be assessed via ecological momentary assessments recorded in the FoodTrck app.
Labeling procedures
Labels of events captured by the IR-AOD (video data) will be generated by trained annotators using a labeling guide. The annotators will identify eating episodes in the video data and assign the appropriate label to each of the episode's preselected fine-grained elements. Duration and point labels will indicate the time and date of the labeled event. These labels will capture participant behaviors and define the start and end times of eating episodes. Table 2 includes of list and description of each of these features.
FoodTrck data processing
FoodTrck entries will be assigned to eating episodes based on corresponding timestamps. FoodTrck will provide contextual, psychological, and geospatial information about a given eating episode (see Table 1). Contextual features of an eating episode collected by EMA surveys in FoodTrck will be stored in an SQL database and attached to a specific eating episode as attributes.
NDSR data processing and merging with FoodTrck data
Data on each eating episode will be downloaded from the NDSR software. Data extracted for each eating episode will include time, calories, and macronutrients. These data will be merged with the FoodTrck datasets using both the participant ID and eating episode time variables. We will then apply the following exclusion criteria to this merged dataset:
exclude participants who dropped out of the study or did not pass the 7-day run-in period exclude eating episodes with missing or incomplete FoodTrck questionnaires exclude eating episodes with 0 calories (e.g., noncaloric beverages only)
Defining overeating
In this study, overeating episodes are operationalized as the eating episodes for which calories consumed is more than 1 z-score greater than the participant's average calories consumed. This definition essentially operationalizes overeating in a manner that is personalized based on the individual's prior caloric intake distribution, where the calories per eating episode are validated by a dietitian. The method involves capturing an individual's eating across 2 weeks providing a representation of each individual's eating pattern, yielding percentiles and cut points for overeating. In our previous work, we showed that our definition of an overeating episode strongly correlated with subjective overeating (Cohen's Kappa = 0.90, showing high agreement), validated by a dietitian. 6 In exploratory analyses, we will also test 1 other definition used in the literature, which defines an eating episode to be overeating if it is 1000 calories or more.49,50
Sample size estimation
Using a Monte Carlo simulation run in R to test the power of detecting within-subject variability of overeating episodes, we calculated an ICC based on a prior overeating study 38 (ICC = 0.37). With the following assumptions—3 eating episodes a day, base rate of overeating with no exposure to features of interest is 33% and proportion of eating episode that are overeating episodes with exposure of variable is 30%, a sample size of 60, and 30 eating episodes per participant—we achieve 80% power to detect within-subject variability of overeating (effect size is .5 standard deviation units), which corresponds to planned feature selection machine learning analyses described below. We, therefore, would expect to be able to estimate a 95% confidence interval (CI) for a moderate AUC of 0.7 fairly precisely (CI width of 0.08–0.15) and for an excellent AUC of 0.9 very precisely (CI width of 0.06–0.11). As we plan to use noneating episodes for analysis as well, these CI widths will certainly be smaller than our estimates here, so we will be adequately powered to claim the AUC of each of the novel eating algorithms.
Planned analyses
Parallel analyses will be conducted using the 3 different sets of features below:
Passive sensing only. Using machine learning, we will initially build an overeating predictive model using passive-sensing only features (representing behavioral and physiological features), such as number and frequency of feeding gestures, number and frequency of swallows, number and frequency of chews, eating duration, heart rate and heart rate variability (HRV) before the eating episode, heart rate and HRV during the eating episode, and time of day.
EMA only. We will then build a predictive model including EMA social and emotional state (expanding the features based on training). This will allow us to identify which self-reported features predict overeating. See Table 2 for features captured.
Passive sensing + EMA. In a third set of analyses, we will then combine passive sensing features and EMA when predicting overeating. Because these analyses will include the most complete set of features, these analyses will be treated as the main analyses for making conclusions about predictors of overeating and characteristics of overeating clusters. The preceding analyses will be conducted to determine the extent to which passive sensing vs. EMA-only analyses lead to different conclusions about overeating and whether one type of data may be sufficient.
Identifying predictive features of overeating
Feature Selection. To avoid overfitting the model to the training data, a subset of the features for modeling overeating will be selected using 2 complementary methods: (1) correlation-based feature selection (CFS) 51 to find the optimal noncorrelated feature set, independent of machine learning algorithm, and (2) wrapper-based feature selection (WFS) 52 to find an optimal feature subset for the Random Forest machine learning algorithm, accounting for the possibility of CFS discarding potentially useful features that are useful for a specific machine learning algorithm. Random Forest is a prominent ensemble-based model that combines a large number of weak simple models to obtain a stronger ensemble prediction by averaging (resulting in decreased variance) models. 53 The output of other feature selection algorithms will also be compared with the output of CFS and WFS to ensure highly predictive features are included in the model.
Machine-learned Classifiers.54–59 Discriminative classifiers generate machine-learned models that directly distinguish boundaries through observed data. Once features are selected, a discriminative supervised machine learning model such as Gradient Boosting Machines (GBMs) will be used. GBMs are a family of machine-learning methods that have shown success in a wide range of applications in machine-learning challenges,52–54 producing competitive, highly robust, interpretable procedures for both regression and classification. 55 The principal idea is to construct new base learners to be maximally correlated with the negative gradient of a chosen loss function (e.g., Adaboost loss functions are used for categorical outcome variables). We will further compare GBMs to other combinations of discriminative classifiers such as logistic regression, support vector machine, random forest, and neural networks, and generative classifiers such as Bayesian networks and hidden Markov models. Generative classifiers are more indirect in their approach and often deploy statistical models and probability theory, sometimes requiring more a priori knowledge that is often unknown, to estimate the probability of each outcome given the observed data.
Evaluation. Based on our sample size, we will generate a train, validation, and test set with a 60:20:20 train:validation:test split ratio. Each classifier will be trained on 60% of the data, and the hyperparameters of the classifier will be fine-tuned on the 20% validation set. We will also perform a 10-fold cross validation (averaging results across 10 runs with a 90:10 split of the data) to be used when building a model. We will report on the Receiver Operator Characteristic Area Under the Curve (ROC-AUC) and select the best model generated by the algorithm based on the average F-measure (more precise measure of performance that captures the precision of the algorithm and recall of both overeating and nonovereating episodes).
Identifying problematic overeating phenotypes through clustering
Generate Clusters. To ensure that a cluster represents most overeating episodes and not regular eating episodes, the resulting optimal features that detect and predict overeating will be used to generate well-separated clusters of regular eating and overeating. Our goal will be to use the features to attain high intracluster similarity (eating episodes in a cluster represent the same label of overeating or nonovereating), and low intercluster similarity (samples from different clusters are dissimilar) between overeating and nonovereating clusters. We will test 2 algorithms. First, we will use k-means,39,60 which is the most widely used partitional clustering algorithm owing to its versatility and efficiency time and space complexity. Every aspect of it (initialization, distance function, and termination criterion) can be modified; it is guaranteed to converge 61 at a quadratic rate 62 ; and it is invariant to data ordering (random shuffling of data points). The optimal k-value for the number of clusters is determined by calculating the silhouette score, 63 which is computed for a given range of k-values and evaluates which k value yields clusters that are most representative of the data that comprise them. The silhouette score quantifies (between −1 and +1) how similar a given data point is to its own cluster, and how dissimilar it is to the other clusters. A silhouette score closer to +1 indicates that the data point is well matched to its own cluster and poorly matched to its neighbors. Second, we will also compare its performance with an agglomerative hierarchical clustering algorithm (which does not require us to prespecify the number of clusters) combined with Ward's minimum variance method (and variations of Ward's method) to minimize the total within-cluster variance. Hierarchical clustering techniques will be used to identify well-separated clusters based on their similarity matrix, a technique we tested in predicting models for hospital readmission. 64
To determine the best clustering method, we will estimate purity, Normalized Mutual Information (NMI), Rand Index, and F measures. We will weight each metric equally, when selecting the optimal set of clusters used. The purity of each cluster (a transparent evaluation measure), which given a set of K clusters
Identifying Overeating and Nonovereating Clusters. We will see whether theoretically meaningful problematic eating phenotypes occur by analyzing the featured makeup of each cluster (e.g., level of stress, time of day, alone or with friends/family). We will further discover new phenotypes by analyzing the relationship between the features within each cluster with a significant proportion of overeating episodes. Analyzing levels of overeating in the clusters (average value of outcome) will indicate risk in relation to other clusters.
We will provide statistics for each cluster, including purity of cluster, percent of overeating and regular eating, percent of stress eating, eating in absence of hunger, hedonic eating versus biological hunger, cognitive restraint, uncontrolled eating, and overeating. This will allow us to identify how clusters co-occur with each other. We will use a personalized definition for each question, where we calculate the average of a person's response, and a value that exceeds the average will be assigned a high and others will be assigned a low value.
Discussion
The ability to predict and detect overeating episodes creates new possibilities for answering pressing research questions and developing state-of-the-art weight management interventions. This project aims to produce a rich contextual characterization of overeating episodes by combining the use of wearable sensing devices, meal-triggered EMAs, and a series of 24-hour recalls of food and beverage intake. 40 Together, these measures are designed to quantify participants’ diets and provide insight into the physiological, contextual, social, and psychological factors that surround eating. Through our planned analyses, we will detect which time-varying factors are associated with overeating. We will additionally use these factors to identify clusters of overeating episodes, potentially leading to new insights regarding the predictors of overeating and co-occurrence of clinically meaningful eating phenotypes.
Strengths of this study include the use of passive sensing and EMA measures, which provide a rich description of in-the-moment behavior while minimizing recall biases. Our low-burden EMA measures include a photograph and brief description of the food items consumed, permitting estimation of food types and portions consumed without lengthy surveys that may be subject to recall bias. The ability to collect geolocation data for each EMA submission opens the door for future studies seeking to explore geographically dependent contextual features of meals, such as the food insecurity index, consumer price index, or demographic scaffolding of the participant's locale. The passive sensing system used in this study also has many advantages that reduce user burden and promote the collection of high-quality data. This system uses multiple sensors to detect multiple proxies of eating to ensure reliable detection and characterization of eating behavior. We will report the F-measure (a more precise measure of performance than accuracy). Our study is the first of its kind because it enables visual confirmation in the real world over long periods of time (prior works typically use cameras for short durations in the wild), which enables validation and confirmation of eating and other user behaviors as well (e.g., screen time, presence of others, and presence of secondary activities).65,66 By combining multiple sensing modalities, long device battery life (at least 48 hours for the necklace, 18 16 hours for the camera and 24 hours for the wrist-sensor while collecting data continuously), high customizability, 67 and minimal degradation of performance in challenging eating environments (i.e., those confounded by various activities),11,18,68,69 we are able to provide the community with a realistic longitudinal dataset containing multiple characterizations of the eating episode against which to build and advance machine learning models for eating detection.
Although several wearable sensors have shown promise in detecting eating in the real world, they have predominantly been validated within a convenience sample, primarily in student populations. For systems to truly be generalizable, additional data is needed from diverse populations, primarily people with varying body mass indices, that is not only student-based or focused on healthy people. Our recent work has shown that models trained on people without obesity perform poorly when applied to people with obesity. 70 Moreover, people with varied body shapes may experience the system differently, varying in reported comfort levels. Our dedication to studying people with obesity using wearable sensors enables deeper insight and translation of research to practice. To the best of our knowledge, we are among the very few to explicitly validate our automated detection systems in people with obesity.
This study is not without limitations. First, detection and characterization of overeating episodes using passive sensing requires that the user be correctly wearing the sensors. The study coordinator will monitor adherence to sensor instructions and intervene as needed. Yet, even with perfect compliance to sensor wear, passive sensing is unlikely to detect overeating at night (because participants are instructed to remove the sensors at this time), reducing our ability to investigate night eating through passive sensing alone. Second, as is the case for most studies using passive sensing and EMAs, reactivity to continuous measurement is a possibility in this study. Countermeasures in the study design to reduce reactivity include explicit instructions to “be yourself,” the use of devices that are designed to be as unobtrusive as possible, and recording of data over a 2-week period (allowing time for any reactivity to dissipate as participants become more acclimated to the study procedures). Importantly, our definition of overeating is personalized based on the size of meals consumed during the study period; thus, even if wearing sensors results in some reduction in meal size, we will retain the ability to compare eating episodes that are relatively large compared to average meals consumed during the study. Additional exploratory analyses will be conducted to determine the effect of time-in-study on eating episodes and key features predicting overeating (e.g., social presence may be more likely over time, as individuals acclimate to wearing devices).
We also acknowledge a number of assumptions in our characterization of overeating episodes. We rely on a recently developed operationalization of overeating episodes (i.e., eating episodes with energy intake that are 1 SD above the average caloric intake across all eating episodes). Accordingly, this definition of overeating does not account for expected unequal meal sizes throughout the day (e.g., evening meal is often the largest meal consumed); an alternative characterization that estimated overeating within particular windows will be an important task for future studies but would have required a much larger sample. This operationalization was selected over past measures, including (1) a 1000-calorie threshold, which is a crude indicator that is not sensitive to individual differences in BMI and eating pattern, and (2) whether or not a meal had been planned—a label that can then be applied to relatively low-calorie meals, requires user input to define overeating, and can only be used when individuals are on a diet. Our personalized definition of overeating at the episode level is consistent with our goal to understand when people consume more than they typically consume, paving the way for Just-In-Time Adaptive Interventions for overeating, and it strongly agrees with participants’ subjective perceptions 6 of which eating episodes constitute overeating. This definition assumes that overeating episodes will occur among all individuals and at about the same rate. Although this feature of our definition does result in some conceptual ambiguity, we note that within a population with obesity understanding and predicting eating episodes with the highest energy intake will nevertheless be greatly beneficial for designing weight loss interventions.
In conclusion, many prior works with sensors in the real-world setting focus on studying people while being enrolled in a weight-loss intervention. We are one of the first to study people with obesity while telling them to “be themselves as much as possible.” This allows us to capture their current problematic eating habits to redefine problematic eating behaviors through sensing and EMA. Until we are able to properly understand what constitutes an overeating episode, we will not know what to detect and ultimately prevent overeating relative to need, a main cause of obesity. In future studies, we plan to apply knowledge of determinants of overeating derived from EMA and passive sensing to detect when individuals are in states that are likely to lead to overeating. During those moments, interventions can provide extra support and guidance to help people with obesity reduce their likelihood of overeating.
Footnotes
Acknowledgments
The authors would like to thank Rawan Alharbi, Shibo Zhang, Qiuyang Xu, Tim Truty, Linda Van Horn, Santosh Kumar, Alexandra Karr, Danielle Ward, and Sheema Hussani for their support of this project.
Author’s note
Josiah Hester is also affiliated at School of Interactive Computing and School of Computer Science, College of Computing, Georgia Institute of Technology, Atlanta GA, USA.
Contributorship
NA, JH, and BS participated in the design of the system. NA, JH, TKS, CR, and EF participated in the development of the system. NA, TKS, AFP, AL, DH, and BS were involved in the study design. NA and CR were involved in the deployment and testing of the system. NA, DH, and TKS participated in the analysis planning. NA, TKS, and CR drafted the manuscript, and all authors reviewed and edited the manuscript and approved the final version.
Declaration of Conflicting Interests
The authors declared no potential conflicts of interest with respect to the research, authorship, and/or publication of this article.
Ethical approval
This study was approved by the Northwestern University Institutional Review Board (STU00204564).
Funding
The authors disclosed receipt of the following financial support for the research, authorship, and/or publication of this article: This work was supported by the National Institute of Diabetes and Digestive and Kidney Diseases (NIH-NIDDK Project # 1K25DK113242-01A1); National Institute of Diabetes and Digestive and Kidney Diseases (grant number 1K25DK113242-01A1).
Guarantor
NA
Appendix.
The FoodTrck App is available upon request for both Android and iOS systems. Please contact the corresponding offer to obtain the app.