
Abstract
Background
To develop a highly discriminative machine learning model for the prediction of intensive care unit admission (>24h) using the easily available preoperative information from electronic health records. An accurate prediction model for ICU admission after surgery is of great importance for surgical risk assessment and appropriate utilization of ICU resources.
Method
Data were collected retrospectively from a large hospital, comprising 135,442 adult patients who underwent surgery except for cardiac surgery between 1 January 2014, and 31 July 2018 in China. Multiple existing predictive machine learning algorithms were explored to construct the prediction model, including logistic regression, random forest, adaptive boosting, and gradient boosting machine. Four secondary analyses were conducted to improve the interpretability of the results.
Results
A total of 2702 (2.0%) patients were admitted to the intensive care unit postoperatively. The gradient boosting machine model attained the highest area under the receiver operating characteristic curve of 0.90. The machine learning models predicted intensive care unit admission better than the American Society of Anesthesiologists Physical Status (area under the receiver operating characteristic curve: 0.68). The gradient boosting machine recognized several features as highly significant predictors for postoperatively intensive care unit admission. By applying subgroup analysis and secondary analysis, we found that patients with operations on the digestive, respiratory, and vascular systems had higher probabilities for intensive care unit admission.
Conclusion
Compared with conventional American Society of Anesthesiologists Physical Status and logistic regression model, the gradient boosting machine could improve the performance in the prediction of intensive care unit admission. Machine learning models could be used to improve the discrimination and identify the need for intensive care unit admission after surgery in elective noncardiac surgical patients, which could help manage the surgical risk.
Introduction
About 312.9 million surgical procedures are undertaken worldwide each year. 1 Postoperative deaths are the third greatest contributor to all deaths, which accounts for 7.7% of all deaths globally.2,3 Surgical mortality has declined over the last decade, 4 but the number of patients in the need for critical care monitoring is still increasing.5,6 Intensive care unit (ICU) admission following major surgery is considered a standard of care in many healthcare systems. However, critical care resources are limited and expensive. 7 Therefore, the appropriate utilization of ICU beds is of great importance. Identifying those at the highest risk of death or complications is essential. The need for critical care monitoring after the surgery is influenced by numerous interacting factors which are classified into patients’ preoperative health, the type and quality of surgery, and anesthesia.8,9The ICU admission decisions making by physicians had significantly different ICU admission rates, which are affected by the type and seniority of physicians.10–12The resource availability is associated with better survival and increasing resource availability may improve patients’ outcomes. 13 Therefore, the development of an accurate predictive model including objective clinical variables in the preoperative assessment is required to guide the allocation of resources such as ICU beds.
Several predictive models have been developed with significant results, but there are some limitations in these studies. The American Society of Anesthesiologists Physical Status (ASA-PS) scale, which relies on physicians’ subjective assessment of patients’ preoperative health status, has modest inter-rater reliability in clinical practice. 14 Other scores have their own limitations, such as the inclusion of data that are not available during the preoperative discussion, applicability to only specific patients, moderate accuracy, and precision for prediction.15–18Otherwise, models like the American College of Surgeons National Surgical Quality Improvement Program (ACS-NSQIP) and MySurgeryRisk were developed as universal surgical scores. They provide specific risks for major complications or death after surgery instead of ICU admission.19–21 Most surgical risk calculators assume that relationships among independent variables are linear which limits the clinical use of prior models. 22 The best approach to assess the risk of a patient relies on prediction models that simultaneously incorporate a large number of variables and provide estimation of events’ risks. 23 There is evidence suggesting that machine learning techniques may offer better predictive performance when data input are abundant and variable interactions are complex.24–26 In this context, machine learning techniques are increasingly being used in various clinical fields 27 and artificial intelligence should be used to augment operative management.28,29
In this study, we developed a highly discriminative machine learning model to predict ICU admission using the easily available information from electronic health records (EHRs), and created a personalized prediction model for a given patient by identifying and utilizing data from similar patients. Further identifying which perioperative factors are associated with postoperative ICU admission may help manage the surgical risk.
Methods
Data source and study population
A single-center cohort analysis was performed, consisting of the patients from a previously assembled cohort of 427,283 inpatients who underwent surgery between 1 January 2014 and 31 July 2018 in West China Hospital, Sichuan University. Patients who underwent cardiac surgery, emergency surgery, ambulatory surgery, and minor surgery requiring no anesthesia were excluded. Admissions without surgery records from 2014 to 2015 for system reasons were also excluded. Additionally, to ensure the independence of data, only the first surgical procedure was included in patients who underwent multiple surgeries. Therefore, 135,442 patients were analyzed in this study (Supplementary Figure S1, supporting information). This study was approved by the ethics review board of West China Hospital, Sichuan University, with a waiver of informed consent because of its retrospective study nature.
Outcome and predictors
Based on an extensive review of all variables in the database and the objective evidence, we selected 99 available preoperative variables which were extracted and integrated with structured query language30,31 (online Supplementary material, supporting information). The primary outcome of interest was ICU stay >24 h because patients who were discharged from ICU within the first 24 h may have been safely monitored postoperatively in a lower intensity unit. 17 Variables routinely assessed during the preoperative period such as patients’ demographics, comorbidities, operative characteristics, and preoperative laboratory tests, which can influence the outcome, were taken into account.
Preoperative comorbidities were recorded using the International Statistical Classification of Disease and Related Health Problems, 10th Revision (ICD-10) codes, and Charlson's comorbidities. 32 Preoperative laboratory tests were the latest taken before the start time of surgery. Surgery details included anesthesia type (general or regional anesthesia), incision type, estimated healing type, surgery type, planned surgery, surgery class, estimated duration of operation, the antimicrobial used before the operation, ASA-PS class, and surgical procedures. The types of surgical procedures were identified by the primary procedure International Classification of Diseases Clinical Modification of 9th Revision Operations and Procedures (ICD-9-CM) codes. We removed minor endoscopic and interventional radiology procedures requiring no anesthesia. 33 As some procedure codes include only a small number of patients, these procedures were classified into 12 basic groups based on the anatomical location of surgery of the ICD-9-CM classification (online Supplementary material, supporting information). Vital signs, such as systolic blood pressure (SBP), diastolic blood pressure (DBP), heart rate, and pulse were measured.
Data preprocessing
Outlier and missing values were taken into consideration in data preprocessing. For continuous variables, observations beyond the top and bottom 1% of the actual distribution were considered outliers which were then imputed with the random numbers from 1% to 25% percentiles and 75% to 99% percentiles, respectively. The multivariate imputation method was used to estimate and impute the missing values with the information of other variables in our dataset.
Statistical analysis
The observations were randomly separated into a training set (70%, n = 94,810) to develop the models and a testing set (30%, n = 40,632) to test the performance of each model.
In order to resolve the class imbalance problem, Synthetic Minority Oversampling Technique (SMOTE) was used in the development cohort,which can achieve better classifying performance than just the copy of existing minority cases. 34
Categorical variables were expressed as frequencies and percentages and chi-square test was used to test for their differences. Continuous variables were expressed as medians and interquartile ranges (IQRs) and Mann–Whitney U-test was used to test for their differences.
To construct the predictive model, we first identified 99 initial available variables based on clinical knowledge. We then carried out feature selection using recursive feature elimination as a wrapper method on top of random forest to find a subset of predictors that can be used to produce a more parsimonious and accurate model. The optimal number of features was 18 with automatic tuning of the number of features selected with 10-fold cross-validation. As a result, the final machine learning model with 18 input variables only was selected in the subsequent analysis.
The following machine learning algorithms were employed: logistic regression (LR), random forest (RF), adaptive boosting (ADA), and gradient boosting machine (GBM) algorithms. These models were chosen due to their widespread use in the machine learning field. Models were developed on the training set with 10-fold cross-validation. And we produced the same sample to train the model with setting seeds.
For each model, we calculated its sensitivity, specificity, positive predictive value (PPV), negative predictive value (NPV), accuracy, F1 score, and the area under the receiver operating characteristic curve (AUROC) on the test set to measure the performance of model. The receiver operating characteristic curve (ROC) plots were used to evaluate the performance of classifiers. At the same time, we used the calibration plot and Brier score to evaluate the calibration of the models.
Secondary analysis
We conducted four secondary analyses after building the models to improve the interpretability of the results.
(1) We estimated the relative influence provided by GBM and reported the impact of different features on predicting ICU admission. (2) According to the results of the testing cohort, the model that attained the best performance was chosen as the final model and the individual patient's predicted probabilities of outcome was calculated. On the basis of predicted probabilities, we explored the distribution of probabilities across the hospital length of stay (LOS). (3) Eighteen features were selected from 99 available variables to construct our final model. In order to assess the performance of ASA-PS in predicting ICU admission, the evaluation metrics were compared between the final model and ASA-PS score. This analysis was chosen because ASA-PS score is a well-recognized and traditional risk stratification method. (4) We also proposed a non-negative matrix factorization (NMF) bi-clustering strategy for our dataset that partitions both the rows and the columns simultaneously, which can improve the interpretability of the model. We then explored their subsequent mortality rate using the Kaplan–Meier method.
Sensitivity analysis
To further validate machine learning prediction performance, we reprocessed the variable measured multiple times before surgery according to time series. Since preoperative variables such as laboratory tests were not uniformly sampled, we took Hyland et al.'s approach 35 to process time series data. We replaced each of the original time series variables with five new features: mean, median, maximum, minimum, and range. We then carried out feature selection using recursive feature elimination and used the four machine learning algorithms to predict.
Statistical analyses were performed with R software (version 3.6.2; The Comprehensive R Archive Network: http://cran.r-project.org).
Results
Patients’ characteristics
A total of 135,442 patients were analyzed in the study, and Supplementary Figure S1 (supporting information) shows the inclusion/exclusion process. Of these, the median (IQR) age was 52 (42, 64) years, 71,162 patients (52.5%) were male and the median (IQR) LOS was 9 (7, 14) days. Overall, 2702 (2.0%) patients were admitted to the ICU postoperatively.
The demographics and important characteristics of patients were summarized in Table 1. Patients requiring ICU admission were older, more likely to be male, longer hospital LOS, more likely to undergo complex surgeries, and had more comorbidities than the patients who were not admitted to the ICU postoperatively. In terms of laboratory tests, patients admitted to the ICU had lower percent of monocyte, calcium, albumin, total protein, cystatin C, high-density lipoprotein (HDL) and cholesterol, as well as higher prothrombin time (PT), mean corpuscular hemoglobin concentration (MCHC), chloride, and activated partial thromboplastin time (aPTT), Serum inorganic phosphorus, and white blood cells (WBC). All predictors were significant between ICU group and non-ICU group, except for fibrinogen (FIB).
Baseline characteristics and predictors stratified by ICU status.

For continuous variables, data are presented as medians and interquartile ranges (IQRs) and Mann–Whitney U-test was used to test for differences. For categorical variables, data are presented as frequencies and percentages and chi-square test was used to test for association.
ASA-PS, American Society of Anesthesiologists Physical Status; aPTT, activated partial thromboplastin time; FIB, fibrinogen; GA, general anesthesia; HDL, high-density lipoprotein; ICU, intensive care unit; LOS, length of stay; MCHC, mean corpuscular hemoglobin; PT, prothrombin time; concentration; RA, regional anesthesia; WBC, white blood cells.
Model performance
The distribution of preoperative features and outcome did not differ between development (n = 94,810) and testing (n = 40,632) cohorts.
We extracted 18 impactful features from the 99 initial available variables based on recursive feature elimination with the visualization (Supplementary Figure S2, supporting information) where the blue line represents the optimal number of trees. The model restricted to the 18 most predictive variables had the highest performance (accuracy: 0.98). We listed all initial inputs in online Supplementary material (supporting information) and parsimonious model with 18 input variables in Supplementary Table S1 (supporting information).
After applying the various machine learning algorithms to the testing cohort, we compared their performance as measured by the ROC plots and other evaluation metrics. Figure 1 shows the ROCs of the four candidate models and Table 2 summarizes their evaluation metrics. Among the four models, the GBM model attained the highest AUROC of 0.90, accuracy of 0.96, and F1 score of 0.34. The Brier scores were 0.1282, 0.0574, 0.0836 and 0.0635 for LR, RF, GBM, and ADA, respectively. The calibration plot is shown in Supplementary Figure S9 (supporting information). Combining discrimination and calibration, GBM had the most outstanding prediction performance.

Receiver operating curves (ROCs) of models for the prediction of intensive care unit (ICU) admission.
Model evaluation on testing set for ICU admission.

ADA, adaptive boosting; AUROC, area under the receiver operating characteristic curve; GBM, gradient boosting machine; ICU, intensive care unit; NPV, negative predictive value; PPV, positive predictive value.
Feature importance
Supplementary Figure S3 (supporting information) shows the top 10 influential predictors and their relative influence provided by GBM. Across these features, the GBM recognized several features as highly significant predictors of postoperatively ICU admission, including surgical procedure, calcium, percent of monocyte, albumin, and PT.
Comparison of risk groups
We grouped patients by surgical procedure and compared their LOS. GBM algorithm was chosen to calculate the risk probabilities for ICU admission to each patient and we then stratified these risk probabilities into two groups over the spectrum of total hospital LOS (Figure 2).

Prediction of intensive care unit (ICU) admission probabilities with hospital length of stay (LOS) among surgical procedures (red represents ICU admission and green represents no ICU admission).
Stratified by individual surgical procedure, the relationship between the predicted probabilities and the observed clinical decision for postoperative ICU admission remained consistent across all of these procedures, with higher rates of ICU admission for patients with higher predicting probabilities. The predicting risk probabilities for postoperatively ICU admission were distinctly different between high and low-risk surgical procedure groups. However, the number of ICU patients in the low-risk group was usually very small.
The percentage of postoperative ICU admissions for each surgical procedure are shown in Table 3 and their hospital LOS are shown in Supplementary Figure S4 (supporting information). Operations on the digestive system, respiratory system, and vascular had the highest percentage of postoperative ICU admissions. The distribution of hospital LOS for the patients with and without ICU admission is shown in Supplementary Figure S5 (supporting information).
Percentage of cases for each surgical specialty reported to have postoperative ICU admission.
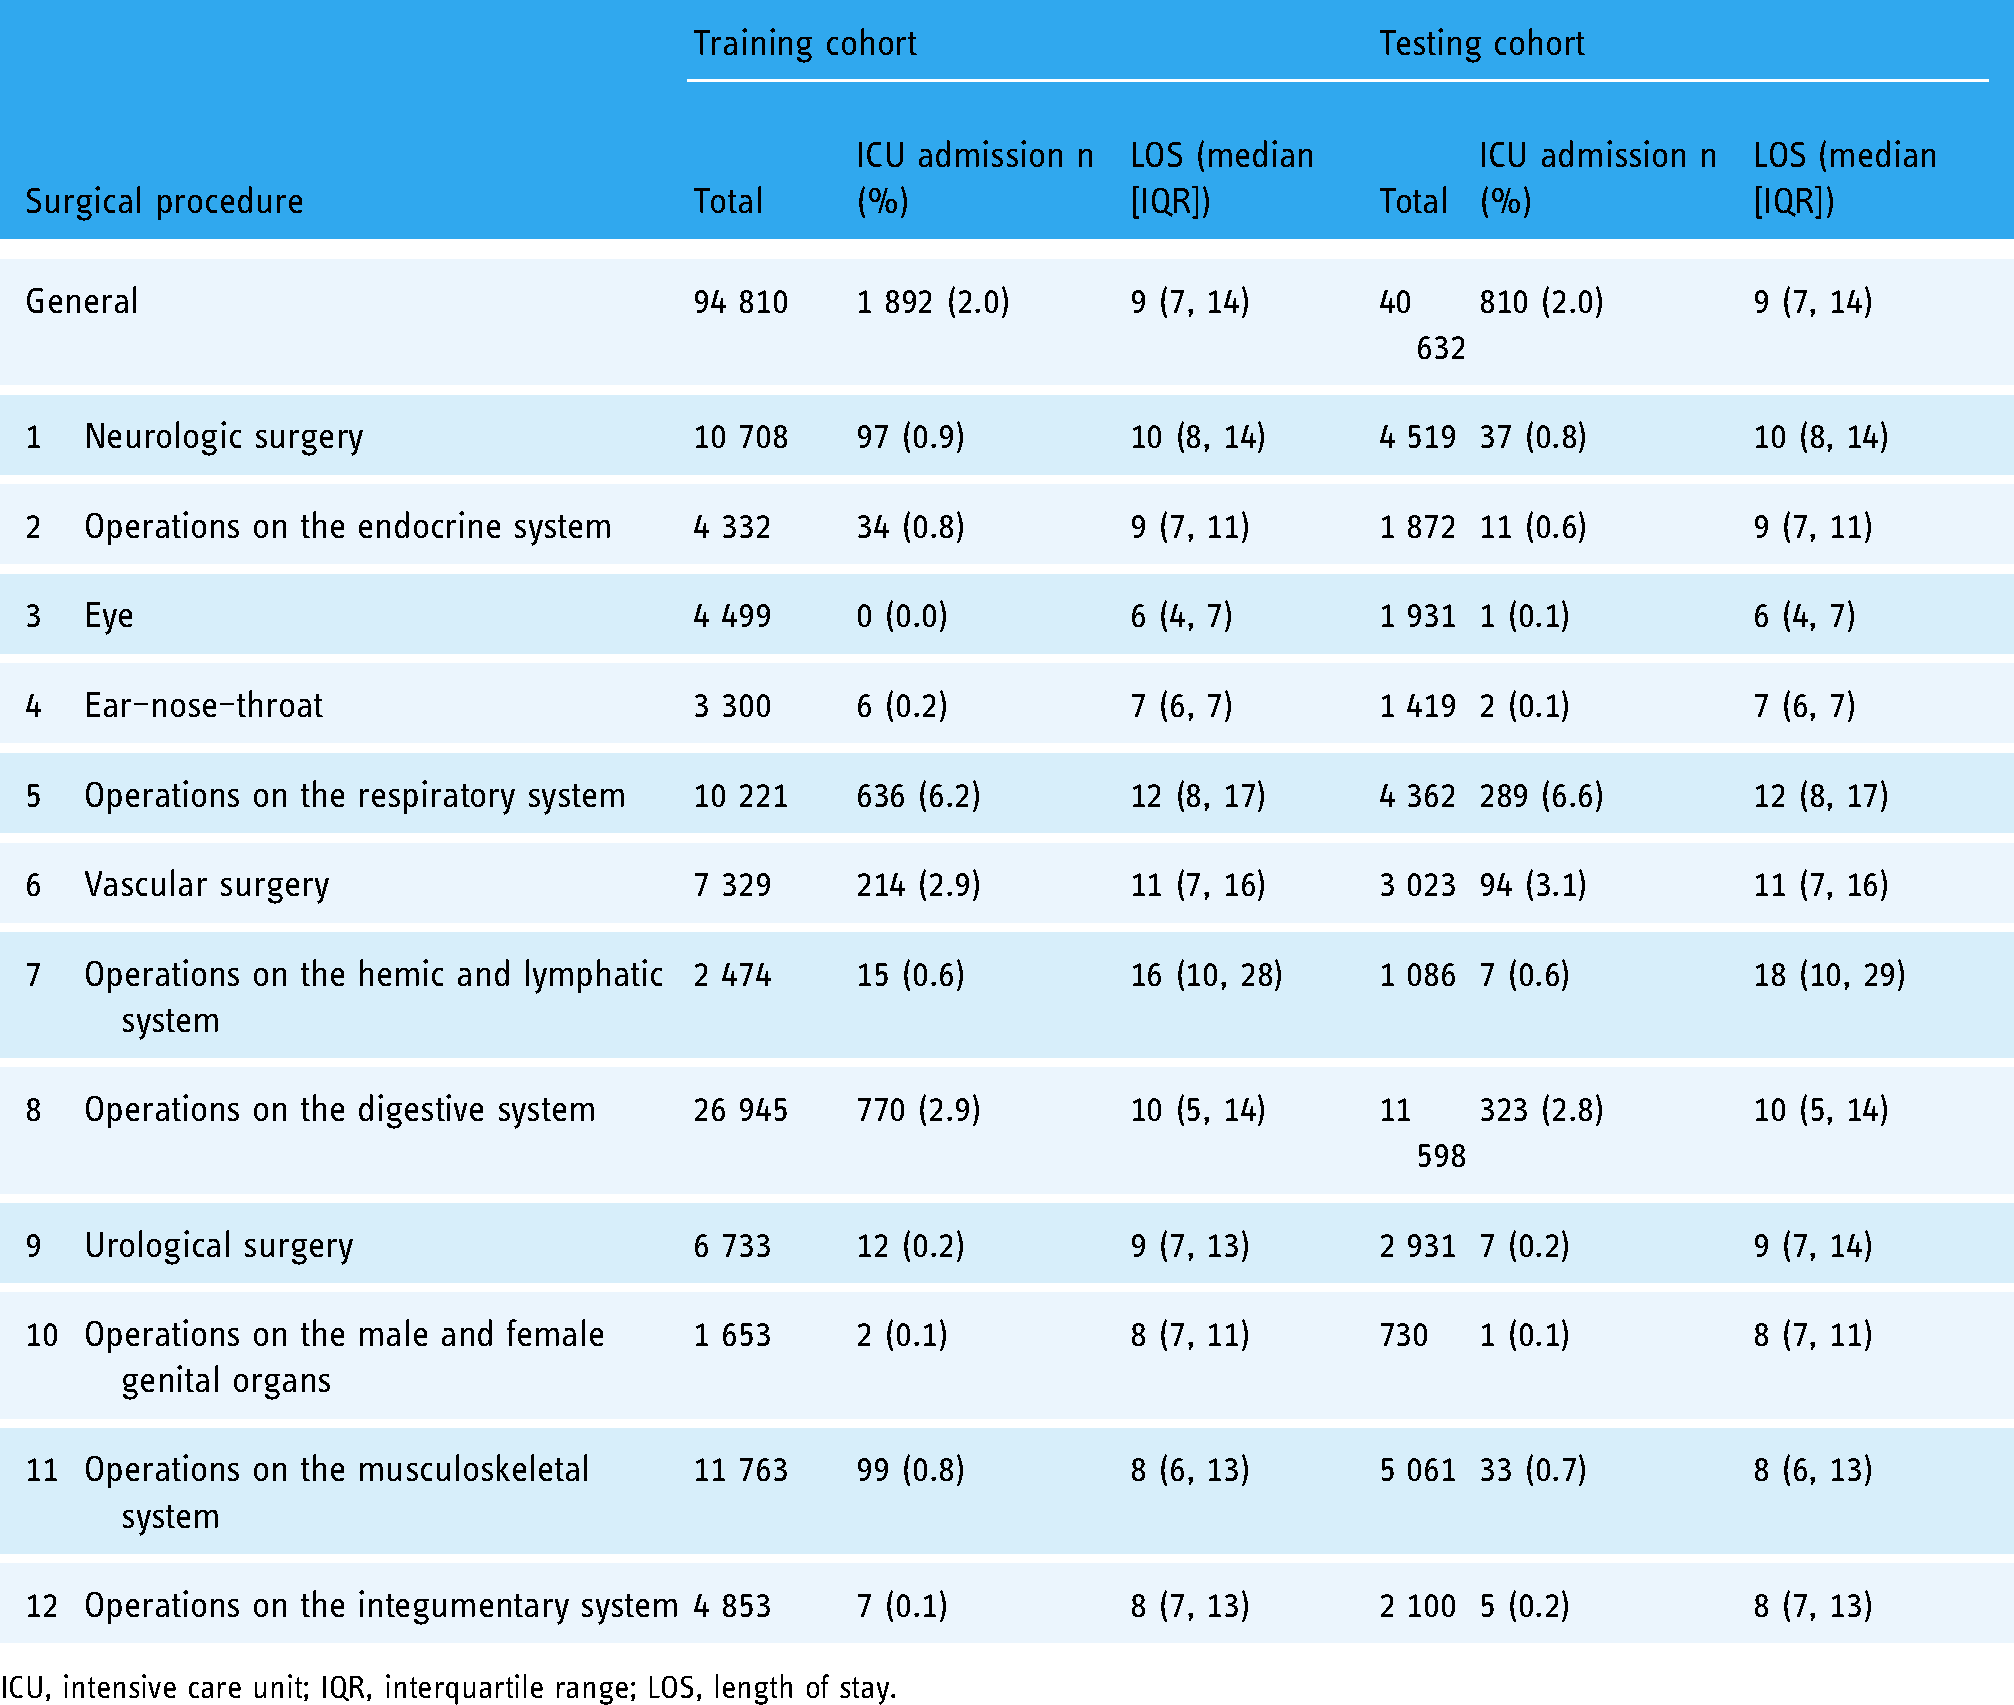
ICU, intensive care unit; IQR, interquartile range; LOS, length of stay.
Comparison with ASA-PS model
The ASA-PS scale has been widely used in the preoperative assessment of surgical patients. Therefore, we compared the ASA-PS score only with the final GBM model without ASA-PS (Table 4). Compared to ASA-PS score (AUROC: 0.68), the GBM had the higher discrimination (AUROC: 0.90). Using only physicians’ subjective assessment, the ASA-PS attained modest inter-rater reliability in clinical practice (Figure 3). The Brier score of 0.4229 for ASA-PS was much higher than that of 0.0836 for GBM, and Supplementary Figure S9 (supporting information) shows their calibration plot.

Receiver operating curves (ROCs) for comparing discrimination of gradient boosting machine (GBM) and the American Society of Anesthesiologists Physical Status (ASA-PS) score.
Prediction performance between machine learning method and traditional score.

ASA-PS, American Society of Anesthesiologists Physical Status; AUROC, area under the receiver operating characteristic curve; GBM, gradient boosting machine without ASA-PS score as input; NPV, negative predictive value; PPV, positive predictive value.
Subgroup analysis
We also grouped patients by the type of surgical procedures and compared their averaged clinical cost across four clusters based on the NMF model. As shown in Supplementary Figure S6 (supporting information), after the permutation of the rows and columns of the dataset, the NMF model selected the ID of samples and surgical procedures within the bi-cluster. Cluster 1 (surgical procedures 1, 7, 10, and 12) had medium cost and wide LOS. Cluster 2 (surgical procedure 8) had medium cost and medium LOS. Cluster 3 (surgical procedures 2, 5, and 6) had above-average cost and medium LOS. Cluster 4 (3, 4, 9, and 11) had wide cost and short LOS (Supplementary Figure S7, supporting information). Surgical procedure 1, 2, 3, 4, 7, 9, 10, and 11 had high survival rate, surgical procedures 6, 8, and 12 had medium survival rate, and surgical procedure 5 had low survival rate (Supplementary Figure S8, supporting information).
Sensitivity analysis
Supplementary Table S2 (supporting information) shows that the AUCs of ADA and RF were slightly higher than that of GBM. However, GBM had the best accuracy and F1 score. Taken together, these two methods using time series data and one time point data as preoperative variables/features have a very similar accuracy, and GBM has the best prediction performance.
Discussion
In this study, we developed prediction machine learning models for the need for ICU admission postoperatively. Using preoperative variables easily available from EHRs, the GBM model was more accurate than other machine learning models and the ASA-PS score. This study shows that machine learning models could be used to improve the discrimination of the prediction model and identify the need for ICU admission after surgery in elective noncardiac surgical patients, which provides an important reference for surgeons to prepare for surgery.
As previously observed, postoperative ICU admission was linked to higher morbidity and mortality. However, most risk scores such as ASA-PS score could not accurately provide the prediction of ICU admission postoperatively. The ability to predict the need for ICU admission after surgery can help develop strategies for a patient's postoperative disposition plan in routine preoperative evaluation, as well as determine protocols directed toward high-risk patients. Previous studies have examined ICU admissions for risk factors36,37 and in a specific subset of patients. 38 However, there is a lack of studies examining predictions of postoperative ICU admissions. We compared the best model in this study with the performance of ASA-PS score in the same dataset and proved that the machine learning models had better prediction performance than the traditional ASA-PS score in predicting ICU admission.
The application of machine learning to medical and clinical conditions forms a major emerging research trend. 27 First, utilizing machine learning methods could significantly improve the performance of prediction model, which shows that there are a lot of opportunities to improve the performance of clinical prediction model in the field of health. 39 More than 130,000 patients with elective noncardiac surgery were included in this study and they had heterogeneity in demographic characteristics and clinical manifestations. The GBM model, the top performing model in this analysis, still maintained high performance in the prediction of ICU admission. These machine learning approaches may be suited to model the health states in a variety of clinical settings for the relationships of nonlinear and higher dimensional among a large number of variables. A machine learning prediction model has been shown to be more accurate than prior models using LR in prehospital triage in the patients with acute aortic syndrome (AAS). 40 And this study has proved that machine learning methods are more accurate than LR in the prediction of ICU admission. Specifically, our proposed model could be used to identify patients who will be admitted to ICU postoperatively before the operation, and improve the allocation of limited ICU resources reasonably. Second, we demonstrate the application of a big data-driven machine learning method in perioperative prediction analysis. Compared with the traditional ASA-PS score, which only focuses on the patients themselves, we consider the variables related to surgery and anesthesia that may be accepted and include the inherent risk of surgery. Our preliminary work included many variables according to the literature and routine available EHRs data; however, the parsimonious model with only 18 variables had nearly the same performance, which indicates that it can be applied more simply and quickly in clinical practice.
Surgical procedure was one of the most important predictors in our study. One strength of this study is the diverse population of patients who underwent surgical procedures. It is common practice to admit patients scheduled for longer and more complex procedures to the ICU by the surgical teams. Of all the surgical procedures analyzed in this study, patients undergoing neurologic, respiratory, cardiovascular, and digestive surgery were the most likely to be admitted to the ICU after surgery. It is unclear if this is due to perceived frailty associated with this population or whether the need for ICU care was actually anticipated by the perioperative personnel.
Several limitations are inherent in this study. One is the retrospective design and use of ICD-9 codes to identify patients. In this study, the actual ICU results were used instead of the decision by clinicians,41,42 and denying ICU admission is common, and age, severity of illness, and diagnosis were important factors in making the decision. Reasons for that include patients too well, patients too sick, lack of beds, and need for more information. 43 The ability to generalize the findings may be limited owing to using the characteristics of patients from a single center. However, the study site is a large tertiary healthcare center with 4300 beds receiving main referrals from southwest of China including Sichuan Province, Chongqing Municipality, Guizhou Province, Yunnan Province, and Tibet Autonomous Region. Therefore, it has a diverse population of patients. And the criteria for ICU admission after surgery might vary based on local needs and resources. We were also unable to define the severity of illness or degree of organ dysfunction for patients that were admitted to the ICU after surgery. Nonetheless, this study serves as the basis of a larger multi-center analysis. Third, obstetrics and gynecology, pediatrics, and stomatology were not included in this study. Lastly, while many approaches based on artificial intelligence to healthcare are criticized for the interpretability, we also visualized the impact of different features to be more explicitly interpretable and intuitive. Further studies are needed to explore the interpretability of machine learning in this area.
Conclusions
In conclusion, the variables in our study are more routinely available and the results based on them can be used more widely. Furthermore, our algorithms included all adult patients with elective noncardiac surgery instead of specific groups, which makes it easier to use. These results provide an opportunity for perioperative optimization interventions in the surgical patients, and further studies are required to assess the impact of empiric admission to ICU after surgery.
Supplemental Material
sj-docx-1-dhj-10.1177_20552076221110543 - Supplemental material for Prediction of intensive care unit admission (>24h) after surgery in elective noncardiac surgical patients using machine learning algorithms
Supplemental material, sj-docx-1-dhj-10.1177_20552076221110543 for Prediction of intensive care unit admission (>24h) after surgery in elective noncardiac surgical patients using machine learning algorithms by Lan Lan, Fangwei Chen, Jiawei Luo, Mengjiao Li, Xuechao Hao, Yao Hu, Jin Yin, Tao Zhu and Xiaobo Zhou in Digital Health
Footnotes
Acknowledgments
The authors would like to thank 1.3.5 project for disciplines of excellence, West China Hospital, Sichuan University (grant number: ZYJC18010), Center of Excellence-International Collaboration Initiative Grant, West China Hospital, Sichuan University (grant number: 139170052), and National Key R&D Program of China (grant number: 2018YFC2001800).
Availability of data and materials
The datasets used and/or analyzed during the current study are available from the corresponding author on reasonable request.
Contributorship
LL: Conception and design, acquisition of data, and drafting the article. FC: Acquisition of data, analysis and interpretation of data, and drafting the article. JL: Analysis and interpretation of data, and revising it critically for important intellectual content. ML: Acquisition of data and revising it critically for important intellectual content. XH: Acquisition of data and revising it critically for important intellectual content: YH: Analysis and interpretation of data, and revising it critically for important intellectual content. JY: Analysis and interpretation of data, and revising it critically for important intellectual content. TZ: Conception and design, and revising it critically for important intellectual content. XZ: Conception and design, and revising it critically for important intellectual content. All authors read and approved the final manuscript.
Declaration of conflicting interests
The author(s) declared no potential conflicts of interest with respect to the research, authorship, and/or publication of this article.
Ethical approval
This study was approved by the ethics review board of West China Hospital, Sichuan University.
Funding
The author(s) disclosed receipt of the following financial support for the research, authorship, and/or publication of this article: This work was partially supported by Center of Excellence-International Collaboration Initiative Grant, West China Hospital, Sichuan University (No. 139170052).
Guarantor
TZ.
Informed consent
Not applicable, because this article does not contain any studies with human or animal subjects.
Trial registration
Not applicable, because this article does not contain any clinical trials.
Supplemental material
Supplemental material for this article is available online.
References
Supplementary Material
Please find the following supplemental material available below.
For Open Access articles published under a Creative Commons License, all supplemental material carries the same license as the article it is associated with.
For non-Open Access articles published, all supplemental material carries a non-exclusive license, and permission requests for re-use of supplemental material or any part of supplemental material shall be sent directly to the copyright owner as specified in the copyright notice associated with the article.