
Abstract
Abstract
Introduction
The care for many patients with diabetes mellitus type 2 in the Netherlands, is contracted by a local care group. The healthcare providers, who collectively shape a care group, provide protocolled diabetes care. Differences exist between care groups in terms of their organizational and financial arrangements. These differences may result in variation in outcomes. The aim of this study is to assess whether variation in healthcare costs, diabetes complications and related hospital admissions on the level of care groups exist.
Methods
A quantitative cohort study was conducted. Patients who used diabetes medication (more than 180 days of defined daily doses per year) for the first time between the years 2014 and 2019 were included. Data were extracted from health insurance claims between 2014 and 2019. Generalized linear mixed models were used to analyse patient variation in healthcare costs (two and six years follow-up), diabetes-related complications and hospital admission days. Intraclass correlation coefficients were calculated to estimate the amount of variation that was attributable to the care groups.
Results
A large variation in outcome variables was observed between patients and a small variation between care groups. The intraclass correlation coefficient for long-term costs was 0.4%; for short-term costs between 0.1% and 0.3%; for complications 1% and for hospital days 4%.
Discussion
A large variation between patients with diabetes mellitus type 2 exists in terms of their healthcare costs and complications. In our study, care groups accounted minimally for this variation. A generalized linear mixed model in combination with year cohorts is a tool to study variations in the long-term outcomes of integrated care initiatives.
Keywords
Introduction
The steady increase of patients with chronic diseases is putting pressure on the healthcare system and healthcare budgets. Diabetes mellitus (DM) is one of those highly prevalent chronic diseases. 1 Ninety percent of patients with DM have DM type 2 (DM2). This group is at high risk of diabetes complications. The treatment of these diabetes complications accounts for the majority of healthcare spending for patients with DM2. These diabetes complications seem to be largely preventable through effective diabetes management. 1
As a potential solution to the constantly rising costs of treating DM2, integrated care groups (hereafter: care groups) and bundled payments (BP) for chronic diseases were introduced in the Netherlands in 2010. The care for nearly all patients with DM2 treated in the primary care in the Netherlands is contracted by a care group. 2 The healthcare providers that collectively shape a care group, provide highly protocolled diabetes care. The different healthcare providers that can form a care group together are diverse: general practitioners (GP), nurse practitioners, internists, specialist nurses, podiatrists, dietitians, ophthalmologists, physiotherapists, psychologists, pharmacists, and medical podiatrists. Which healthcare providers form together the integrated care group differs between care groups, but all care groups have a large representation of GPs 3 : the mean number of GPs per care group in 2013 was 77. Most care groups are therefore run by local GP associations. GP associations are also generally the main contractors.
In the Netherlands, health care insurers sign contracts with health care providers. To encourage the integration of different health care providers within the care group, health care insurers contract and purchase the different care components of the DM disease management program as a single package from the care group. 4 This payment is for the full range of services for the patient. Care groups, in turn, contract general practitioners and other health care providers like dieticians and specialists. This is known as a bundled payment (or BP)5,6 and replaces the traditional Fee For Service (FFS) approach in which the different care components are contracted by the individual health care providers.
A care group is thus a provider-led organization that is clinically and financially responsible for all patients in a disease-specific program. 6 The assumption of integrated care is that the quality of care is improved through better coordination within the care group. This ideally leads to better patient health and lower healthcare costs.3,4 The Dutch care groups are comparable to5,6 clinical commission groups in England 7 and Accountable Care Organizations in the United States. 8
Indeed, previous research based on studies from Europe, Australia and Asia showed that integrated care seems to decrease health care costs or medical spending growth and improves health outcomes9–11 Also, a different payment scheme than FFS seems a powerful tool to stimulate integrated care and influence health care expenditure growth. 12 However, previous research is inconclusive about the effect of bundled payments for integrated care provided by care groups, in terms of patients’ clinical outcomes and healthcare costs3,13,14 in the Netherlands.3,5,11 A few years after the introduction of care groups with BP in the Netherlands, small improvements were detected in outcome measures such as systolic blood pressure and cholesterol 13 and improved coordination of care, 14 but health care expenditure seems to have increased, especially for multimorbid patients. 5
The content of diabetes care is based on a national standard. 15 It is based on recent and evidence-based insights for coordinated, individual prevention and care. 16 The standard is functional, so it only describes what care needs to be provided, not by whom. However, differences exist between care groups in terms of their organizational and financial arrangements. These differences may result in an undesirable variation in outcomes. Every year, care groups in the Netherlands are benchmarked (on a voluntary basis) regarding aspects of the care17,18 they provide. 17 These benchmarks show that the care is highly protocolized and the variation between care groups has decreased over the years. Nevertheless, there is still some undesirable variation between care groups on certain indicators such as the percentage of patients with a low LDL-cholesterol level, lipid-lowering medication and foot and fundus examinations. 17 Quality agreements between various health insurers and care groups also differ, leading to variation between care groups. 19
Variation is not per definition undesirable. The current transition towards personalized, patient centred, and value-based care increases differences between care groups in the care they provide. Studying patient outcome variation between care groups helps to redesign diabetes care towards a more patient centred, integrated approach. Multilevel modelling is an important and often used statistical technique to gain information from the variance of outcome or cost variables between providers and so find ways to improve the disease management program. 18 The key idea is to isolate the variation in outcome variables due to justifiable factors, such as differences in the patient case mix. If there is still a considerable variation attributable to providers, the practices of the best performing providers can provide information on the best way to achieve quality and cost improvements in diabetes care. The research that is most comparable to the present study, investigates spending variation between integrated care organizations with a multilevel model (GLMM). This study showed a small, but significant variation in patients’ healthcare costs between care groups. 20 It used data from one year and clinical patient outcomes were not studied. Given the clinical course of DM2 (many DM2-related complications develop later), it is important to track the patients over a longer period of time.
The present study assessed whether variations exist in long-term (6 years) healthcare costs, diabetes-related complications and hospital admissions of patients with DM2 between care groups in the Netherlands. Additionally, the potential variation over time was examined, using short-term healthcare costs (2 years) of the patients. This study is the first attempt to assess variation in the long-term outcomes of integrated care initiatives in Dutch health care.
Methods
Study design and data collection
The design used in this study is a quantitative cohort study. The individual-level dataset included healthcare claims, patient characteristics (collected by Vektis, the information center established by the Dutch insurers), social-economic status (SES) and pharmaceutical cost groups (FCGs) (collected for the Dutch risk equalization system) for the years 2012–2019. This dataset was provided by the Dutch Healthcare Authority (Nederlandse Zorgautoriteit, NZa). The dataset was pseudonymized. Public data from CBS (Statistics Netherlands) was used to account for the degree of urbanization in the patients’ region.
Study population
Patients with DM2 were selected if they received integrated care between 2014 and 2019. Healthcare declaration codes were used to identify which patients received integrated care by a care group (codes are available in the Supplemental Material). Further, patients were selected who started to use more than 180 defined daily doses (DDD) of DM medicines per year for the first time between 2014 and 2019. This threshold for medication use coincides with the threshold used in the Dutch risk equalization system. Patients above this threshold generally have higher healthcare costs than patients without DM. 21 Data from 2012 to 2013 was used to exclude patients whose medication usage already exceeded this threshold before 2014. The patients included were classified into cohorts 2014–2019, with the year indicating the first year in which their medication usage exceeded the threshold. All analyses were based on cohort 2014, except for the analyses on short-term healthcare costs.
Patients with DM type 1 (DM1), patients with gestational diabetes and patients younger than 18 years were not eligible for care by a care group and thus expected to be automatically excluded from this study. Patients younger than 18 years were explicitly excluded. The following patients were also explicitly excluded: patients treated by multiple care groups during the study period or patients treated by a care group that did not exist continuously throughout the study period.
Variables
The following outcome variables were constructed: total healthcare costs, number of diabetes-related complications, and total days of hospital admissions related to complications. Total healthcare costs were the total costs per patient in the following sectors: general practitioner (including first-line multidisciplinary care), pharmaceutical care, hospital care, medical aids, podiatry, and dietetics.
For the main analysis of long-term costs, the total 6 years (2014–2019) cost was summed up into a single outcome measure. The additional analysis of short-term costs used the sum of total costs in the first 2 years of the cohort as an outcome variable.
An a-priori list of 13 possible diabetes-related complications was created based on literature1,22 Diagnosis treatment combinations (DTCs) within the relevant target groups, that is, specialism-diagnosis combinations, corresponding to these complications were selected. DTCs that only included screening or diagnostics for the complication were not included (list complications, target groups and DTCs available in the Supplemental Material). This strategy was intended to capture serious complications that needed medical care and thus involved high hospital costs. Every complication was counted once per patient. The total number of diabetes-related complications was summed for the time period 2014–2019.
Hospital admission days were extracted based on the care activity codes (included in the Supplemental Material) within the complications selected. Activity codes were only available from 2016 onwards. Thus hospital admission days in the period 2016–2019 were included.
Confounding variables
Based on previous research and literature on the factors that are correlated with diabetes-related complications and healthcare costs, the following variables we controlled for: gender, age, socioeconomic status (SES), degree of urbanization (as a proxy for capacity and competition of hospitals), and the number of pre-existing comorbidities.23–28 These characteristics are known to influence healthcare costs, the likelihood of complications and hospitalizations. Socioeconomic status was defined as in the Dutch risk equalization system in 2014. Pre-existing co-morbidities were counted based on pharmaceutical cost groups (FCGs) for the patient in the year of inclusion in the study. FCGs are defined as in the risk equalization system and are based on medication use for different diseases. Supplemental Appendix 5 describes all the FCGs that were included. The death of a patient during the study period was taken into account by including a dummy variable in the analyses of total costs, and by including the time of exposure (time at-risk) in the analysis of complications and hospital admissions.
At the care group level, the size of the care group was controlled for expressed in the total number of diabetes patients, and the primary health insurer. The primary health insurer was used as a proxy for the content of the care group’s protocols and the disciplines participating in the group. The care groups’ primary healthcare insurers were grouped into six groups. There were four groups for each of the four biggest healthcare insurers; one group was a combination of two healthcare insurers (both primary healthcare insurers for the same care groups) and one group included three smaller healthcare insurers.
Analyses
The data had a nested structure because patients were nested within care groups. Because of this nested structure and the non-normal distribution of the outcome measures, a Generalized Linear Mixed Model (GLMM) was used. 29 The levels in the model were the patients and the care groups.
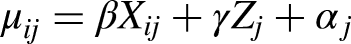
In the analysis of total costs, a log-normal distribution with identity link function was used, while in the analysis of the number of complications and admission days, a negative binomial distribution with log link function was assumed. In the latter case, the dispersion parameter of the model was assessed to check whether the negative binomial distribution fitted the data better than a Poisson distribution.
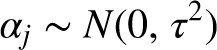
The total costs (long-term and short-term) were estimated using the following model:
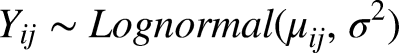
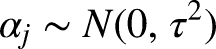

The statistical software package R, version 4.0.2 31 was used. 32 Data cleaning, manipulation, and descriptive statistics were mainly carried out using the package ‘data.table’. 33 Regression analyses were based on Bayesian inference, using the ‘brms’ package. 31 The methods and recommendations for Bayesian inference by Gelman and van der Schoot 34 were used. 35 Multilevel modelling in the ‘brms’ package was based on Bürkner and Nalborczyk.34,36 The priors were set on the defaults for the package, which were weakly informative. This assumption was checked visually and by carrying out a sensitivity analysis.
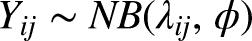
First, a crude model was run without the covariates as fixed effects but with the random intercept for the care group. Then the model was extended with the patient confounding variables, and lastly with the care group confounding variables. The variation of outcome measures that can be attributed to the care group level, was based on the Intraclass Correlation Coefficient (ICC). The ICC was calculated by dividing the between-unit variance by the total variance for Gaussian models. 37 However, in the negative binomial mixed models, the between-unit variance was absent because of the different scales of the cluster error variance and the outcome measures. 30 Variance Decomposition (VD) is the recommended alternative in this case. For the VD, draws from the posterior predictive distribution with and without random effects were calculated first. Then the variances for the draws were calculated. Lastly, the VD was the ratio between the difference of the variances and the variance of the draws from the distribution with random effects. 38 As a verification, the ICC was calculated with a different, rough method proposed39,40 by Nakagawa et al. 39 using 4000 posterior samples for lambda (i.e. expected number of complications) 1 and 2.
Additionally, a test was run on whether the model with the care-group-specific random intercept was preferable to a model without a random intercept. This was done by comparing the R2 of both models, and by performing a leave-one-out cross-validation (LOO) comparison. LOO is a method for testing Bayesian models that estimate the predictive accuracy of the model using the log-likelihood of posterior simulations. 41 The outcome is the expected log predictive density (ELPD). In the LOO compare output, the difference in expected predictive accuracies between the models is expressed by the ELPD difference.
The variables of patient age and care group size were standardized to help the model-fitting process. For all models, chain convergence was reached and checked through visual observations of the trace plots, Ȓ and substantial effective sample sizes (ESS). The distribution of the predicted versus observed values was plotted to check the model fit. The appropriateness of the default priors was verified by sampling and plotting the priors and comparing them with the posteriors of the same parameters, and by sensitivity analyses. Lastly, it was verified that the negative binomial distribution was preferable to the Poisson distribution in the models on complications and hospital admissions since the 95% credible interval of the dispersion parameters did not include zero.
Sensitivity analyses
Three sensitivity analyses were conducted: using different priors; running all models on data from cohort 2015; and including the GP practices within the care groups as an extra level in the model.
Results
Patient and care group characteristics
A total of 235,080 Patients who used more than 180 defined daily doses of diabetes medication for the first time in the period 2014–2019 were identified. A total of 143,283 patients were included in the study (see flowchart in Supplemental Files). Table 1 presents the descriptive statistics of patient characteristics in the cohorts 2014–2018.
Patient characteristics of all cohorts 2014–2018.
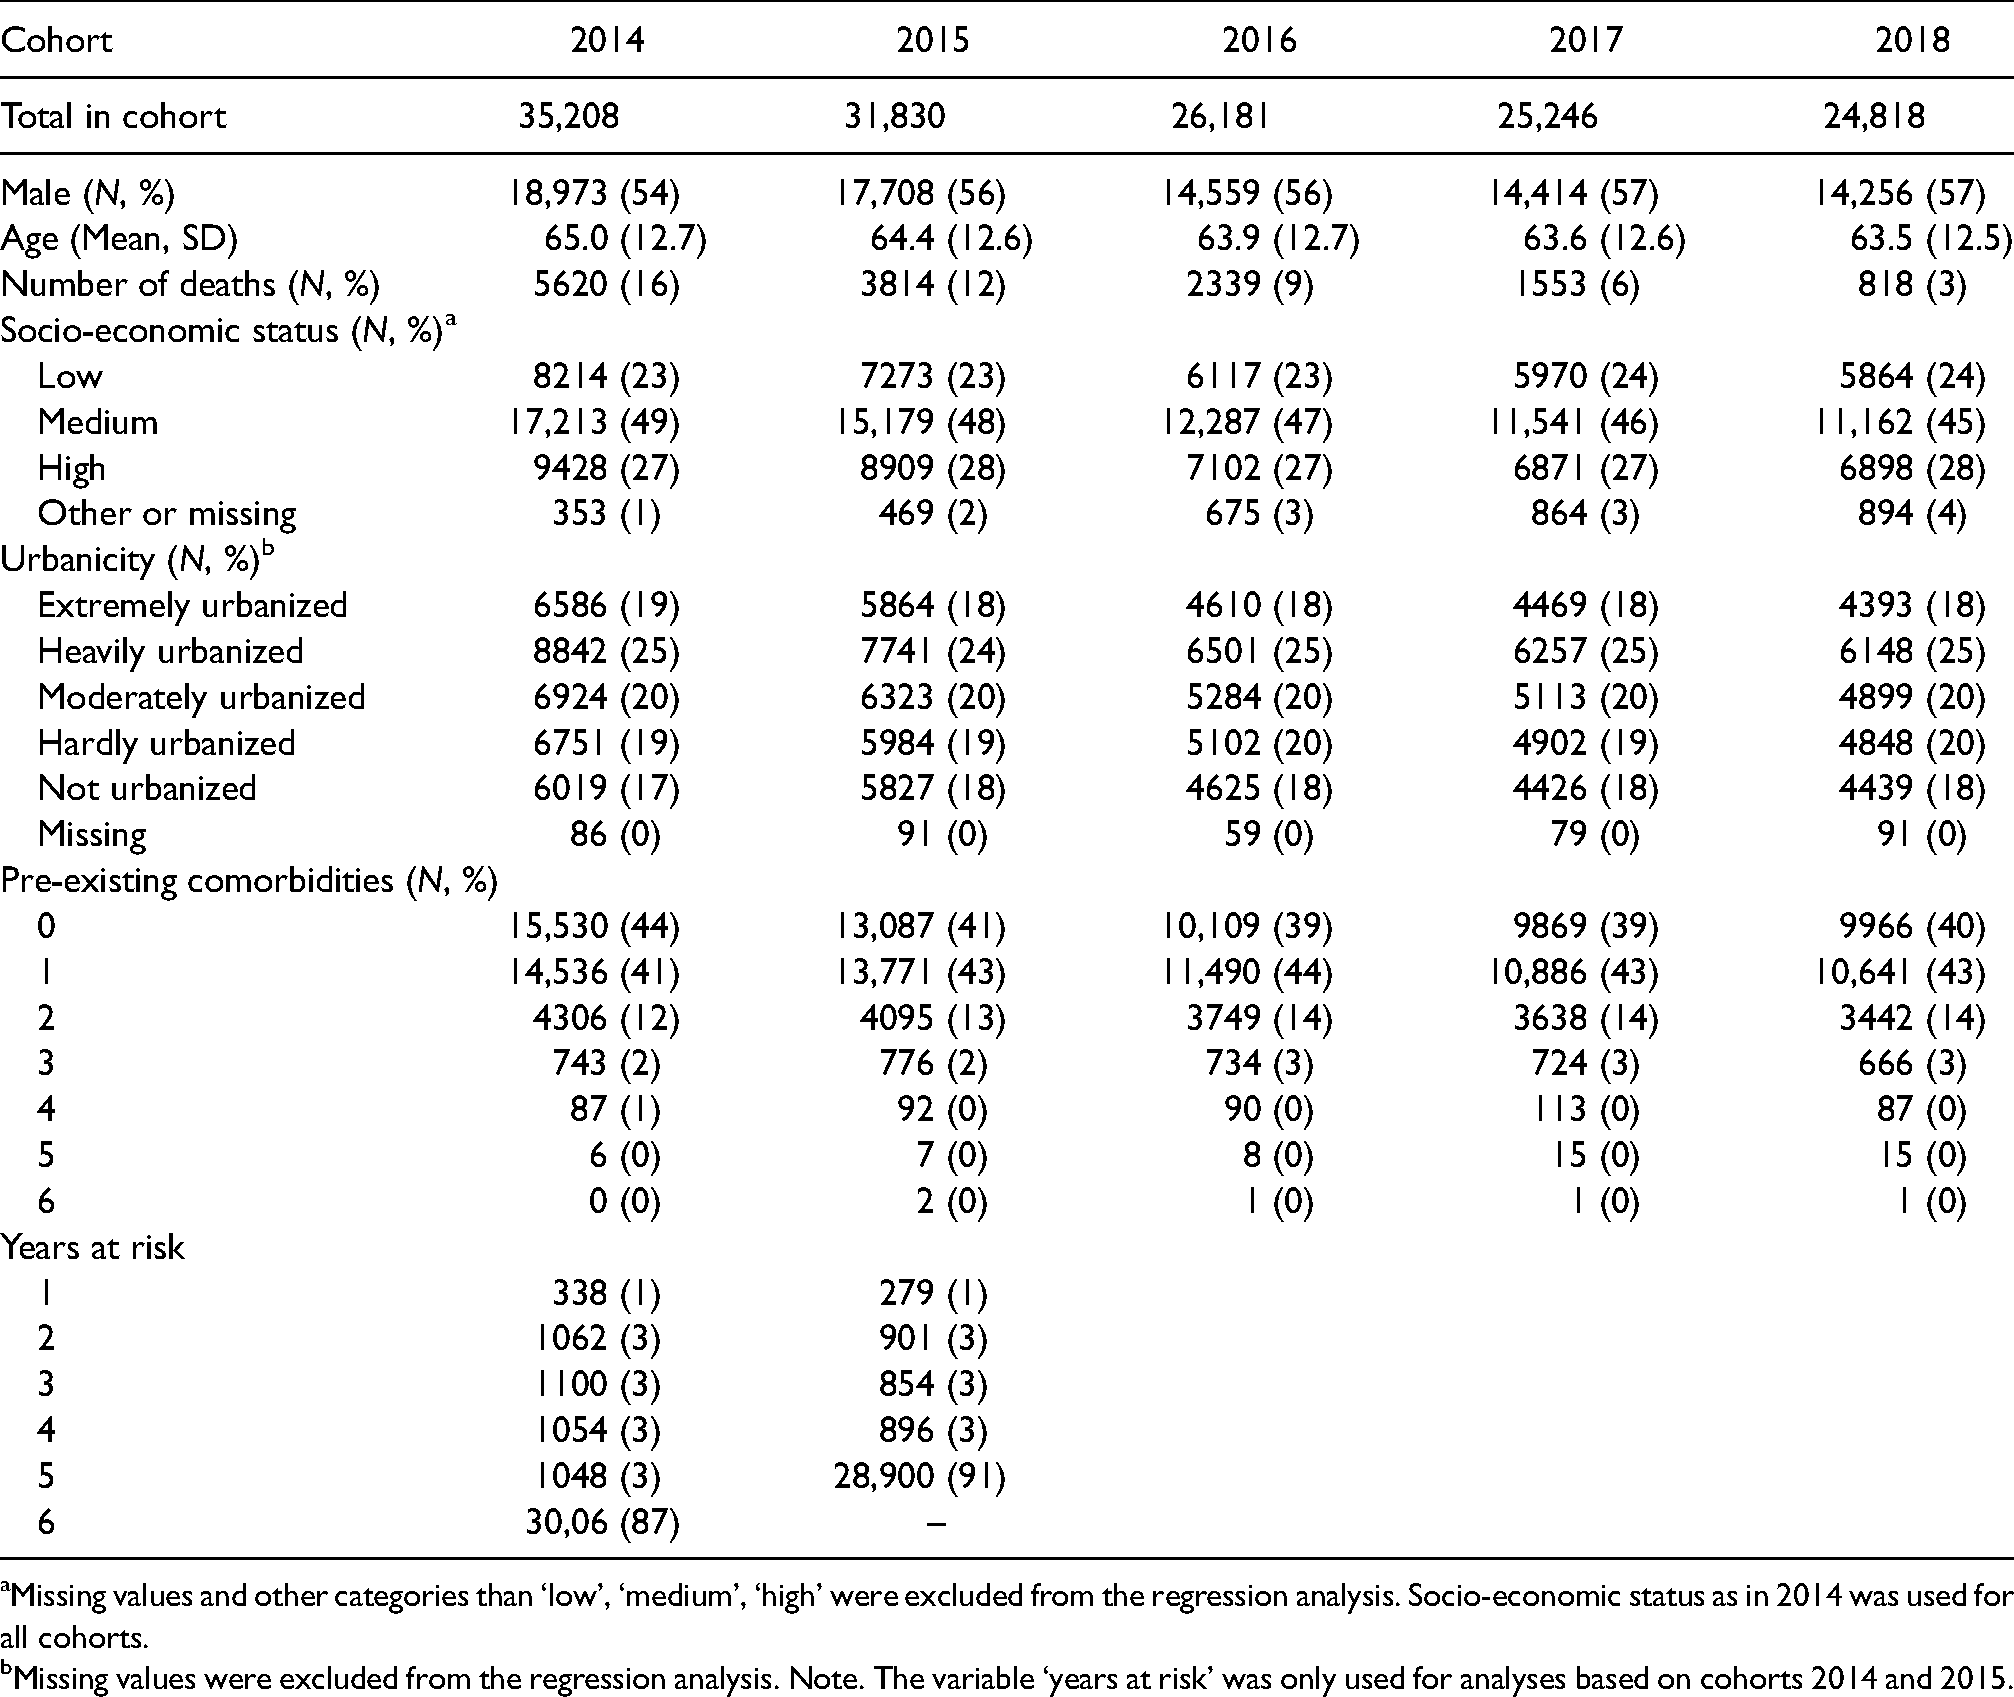
Missing values and other categories than ‘low’, ‘medium’, ‘high’ were excluded from the regression analysis. Socio-economic status as in 2014 was used for all cohorts.
Missing values were excluded from the regression analysis. Note. The variable ‘years at risk’ was only used for analyses based on cohorts 2014 and 2015.
The size of a care group, defined as the number of patients treated per year, was highly variable (minimum, 25th percentile, median, 75th percentile and maximum were 244, 1373, 4422, 8664 and 30,758 patients, respectively). The number of care groups per healthcare insurer group varied from five up to 31.
Description of outcome variables
Almost half of the patients’ healthcare costs were attributable to the hospital sector (see Supplemental Files). The other half of the healthcare costs were mainly incurred in the pharmaceutical care and general practitioner care sectors. Low costs were observed in the podiatry and dietetics sectors.
Within the 6-year study period, 36.8% of patients had at least one complication but only 12.7% were hospitalized for at least one day due to those complications. For more details see Supplemental Files.
Regression results in long-term costs
Table 2 describes the results of the models on long-term log-transformed healthcare costs. Model 1 (unadjusted model) indicates that the average cost per patient was €25,931 (exp(9.74 + 0.92^2/2)) over the 6-year study period. In Model 2, age, sex, death in the study period, socio-economic status, and pre-existing comorbidities explained about 6% of the variation. Care group characteristics (i.e. size and primary insurer of the care group) did not explain additional variance in the patients’ healthcare costs (model 3). In this final model, the ICC was 0.4%.
Bayesian multilevel regression model for the effect of care groups on the logarithm of long-term healthcare costs.
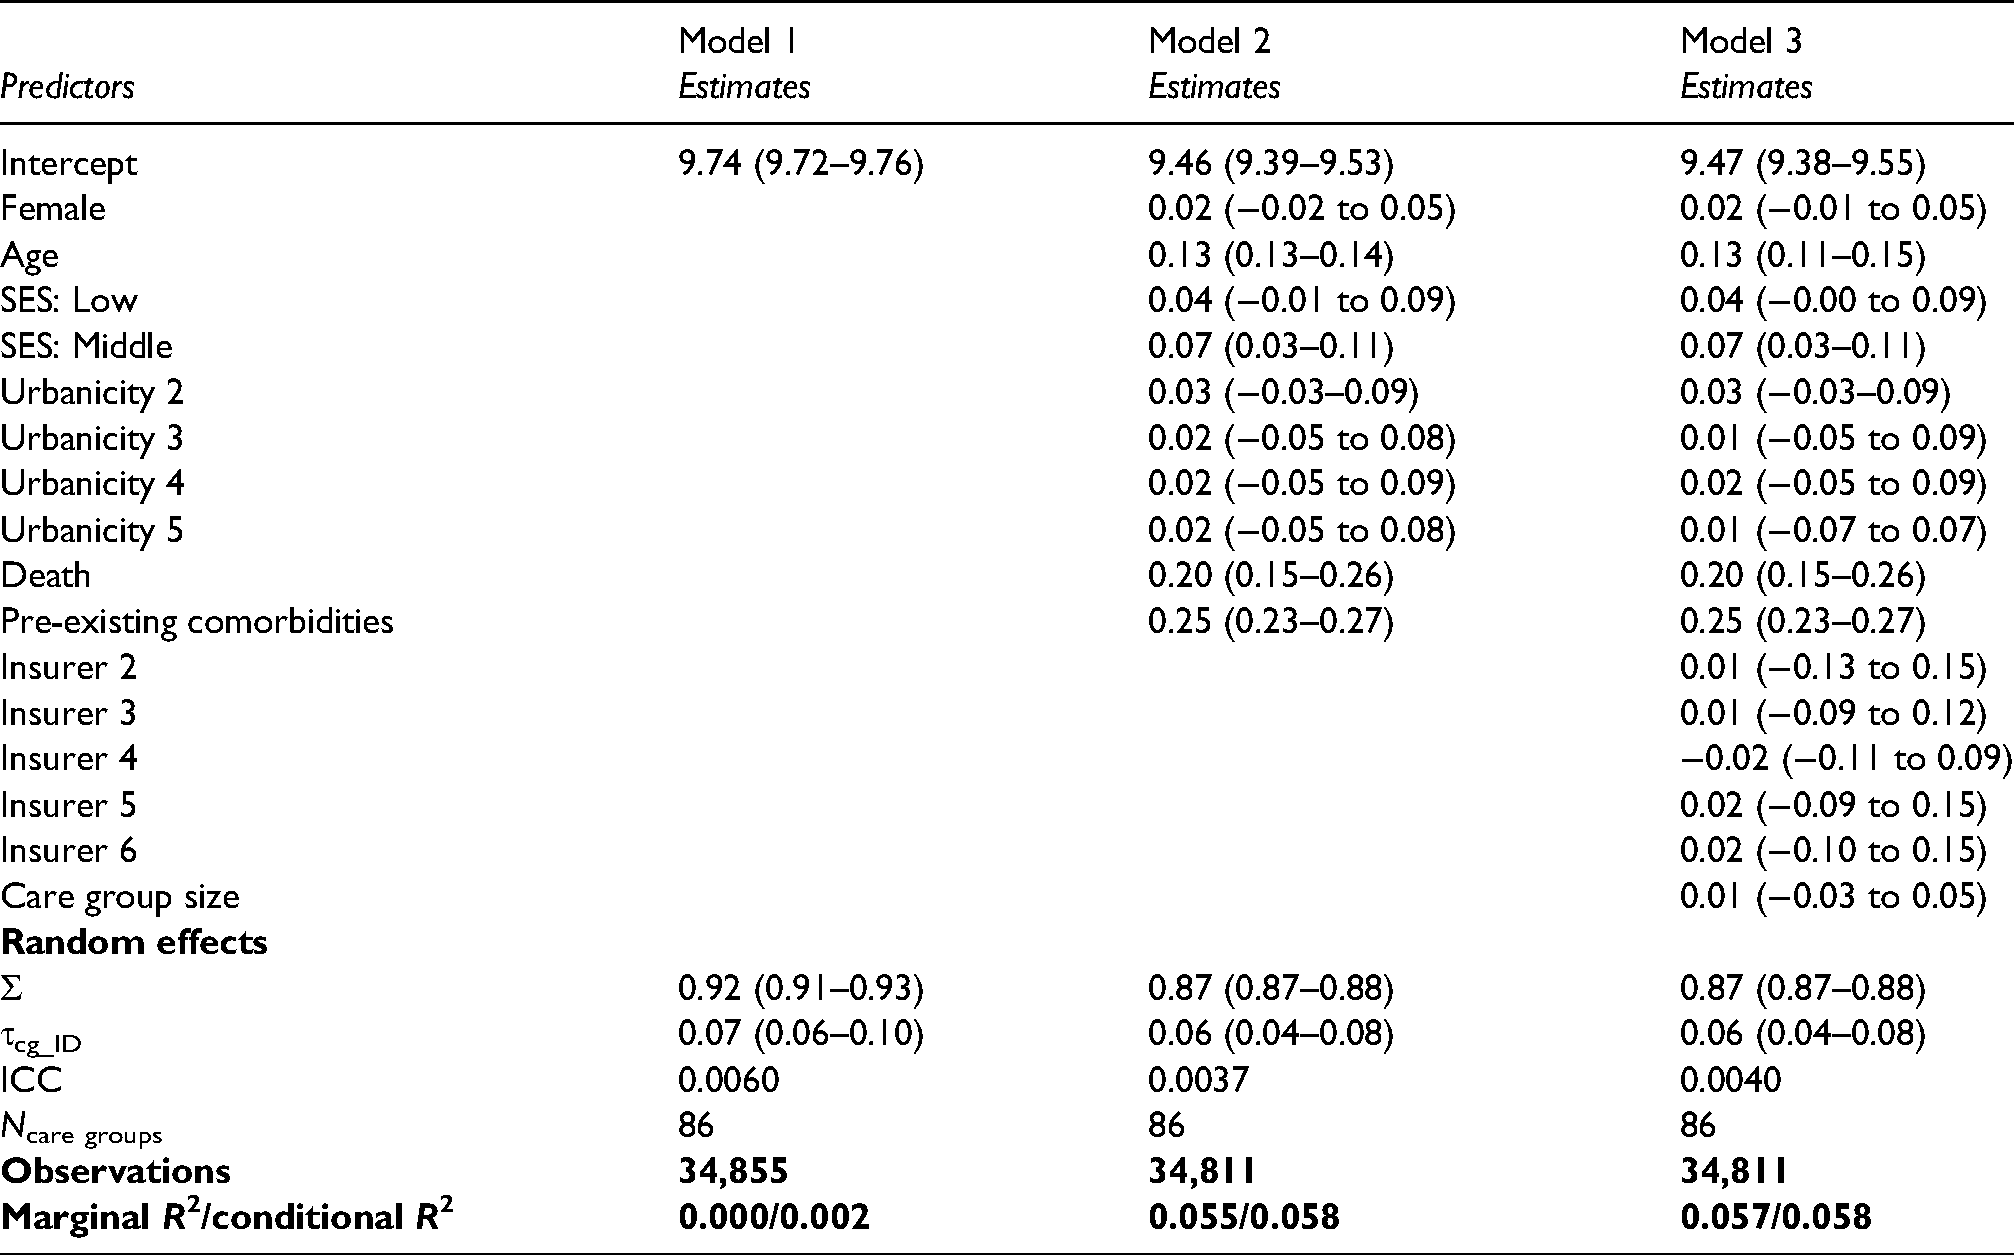
The R2 of a model without random effects but with all other explanatory variables (not shown in the table) was 0.03, which is certainly lower than the R2 of the model with random effects (0.06). The ELPD difference, based on the LOO comparison, for the model without random intercept compared to the full model was −822.9 with a standard error of 40.2. This indicates that the expected predictive accuracy of the model with the random intercept is significantly higher than that of the model without the random intercept, showing that the random intercept for care groups did explain a small part of the variation.
Figure 1 shows the integrated-care-group-specific intercept in the full model (model 3). The 95% CIs of the intercepts overlapped zero in all but five care groups.
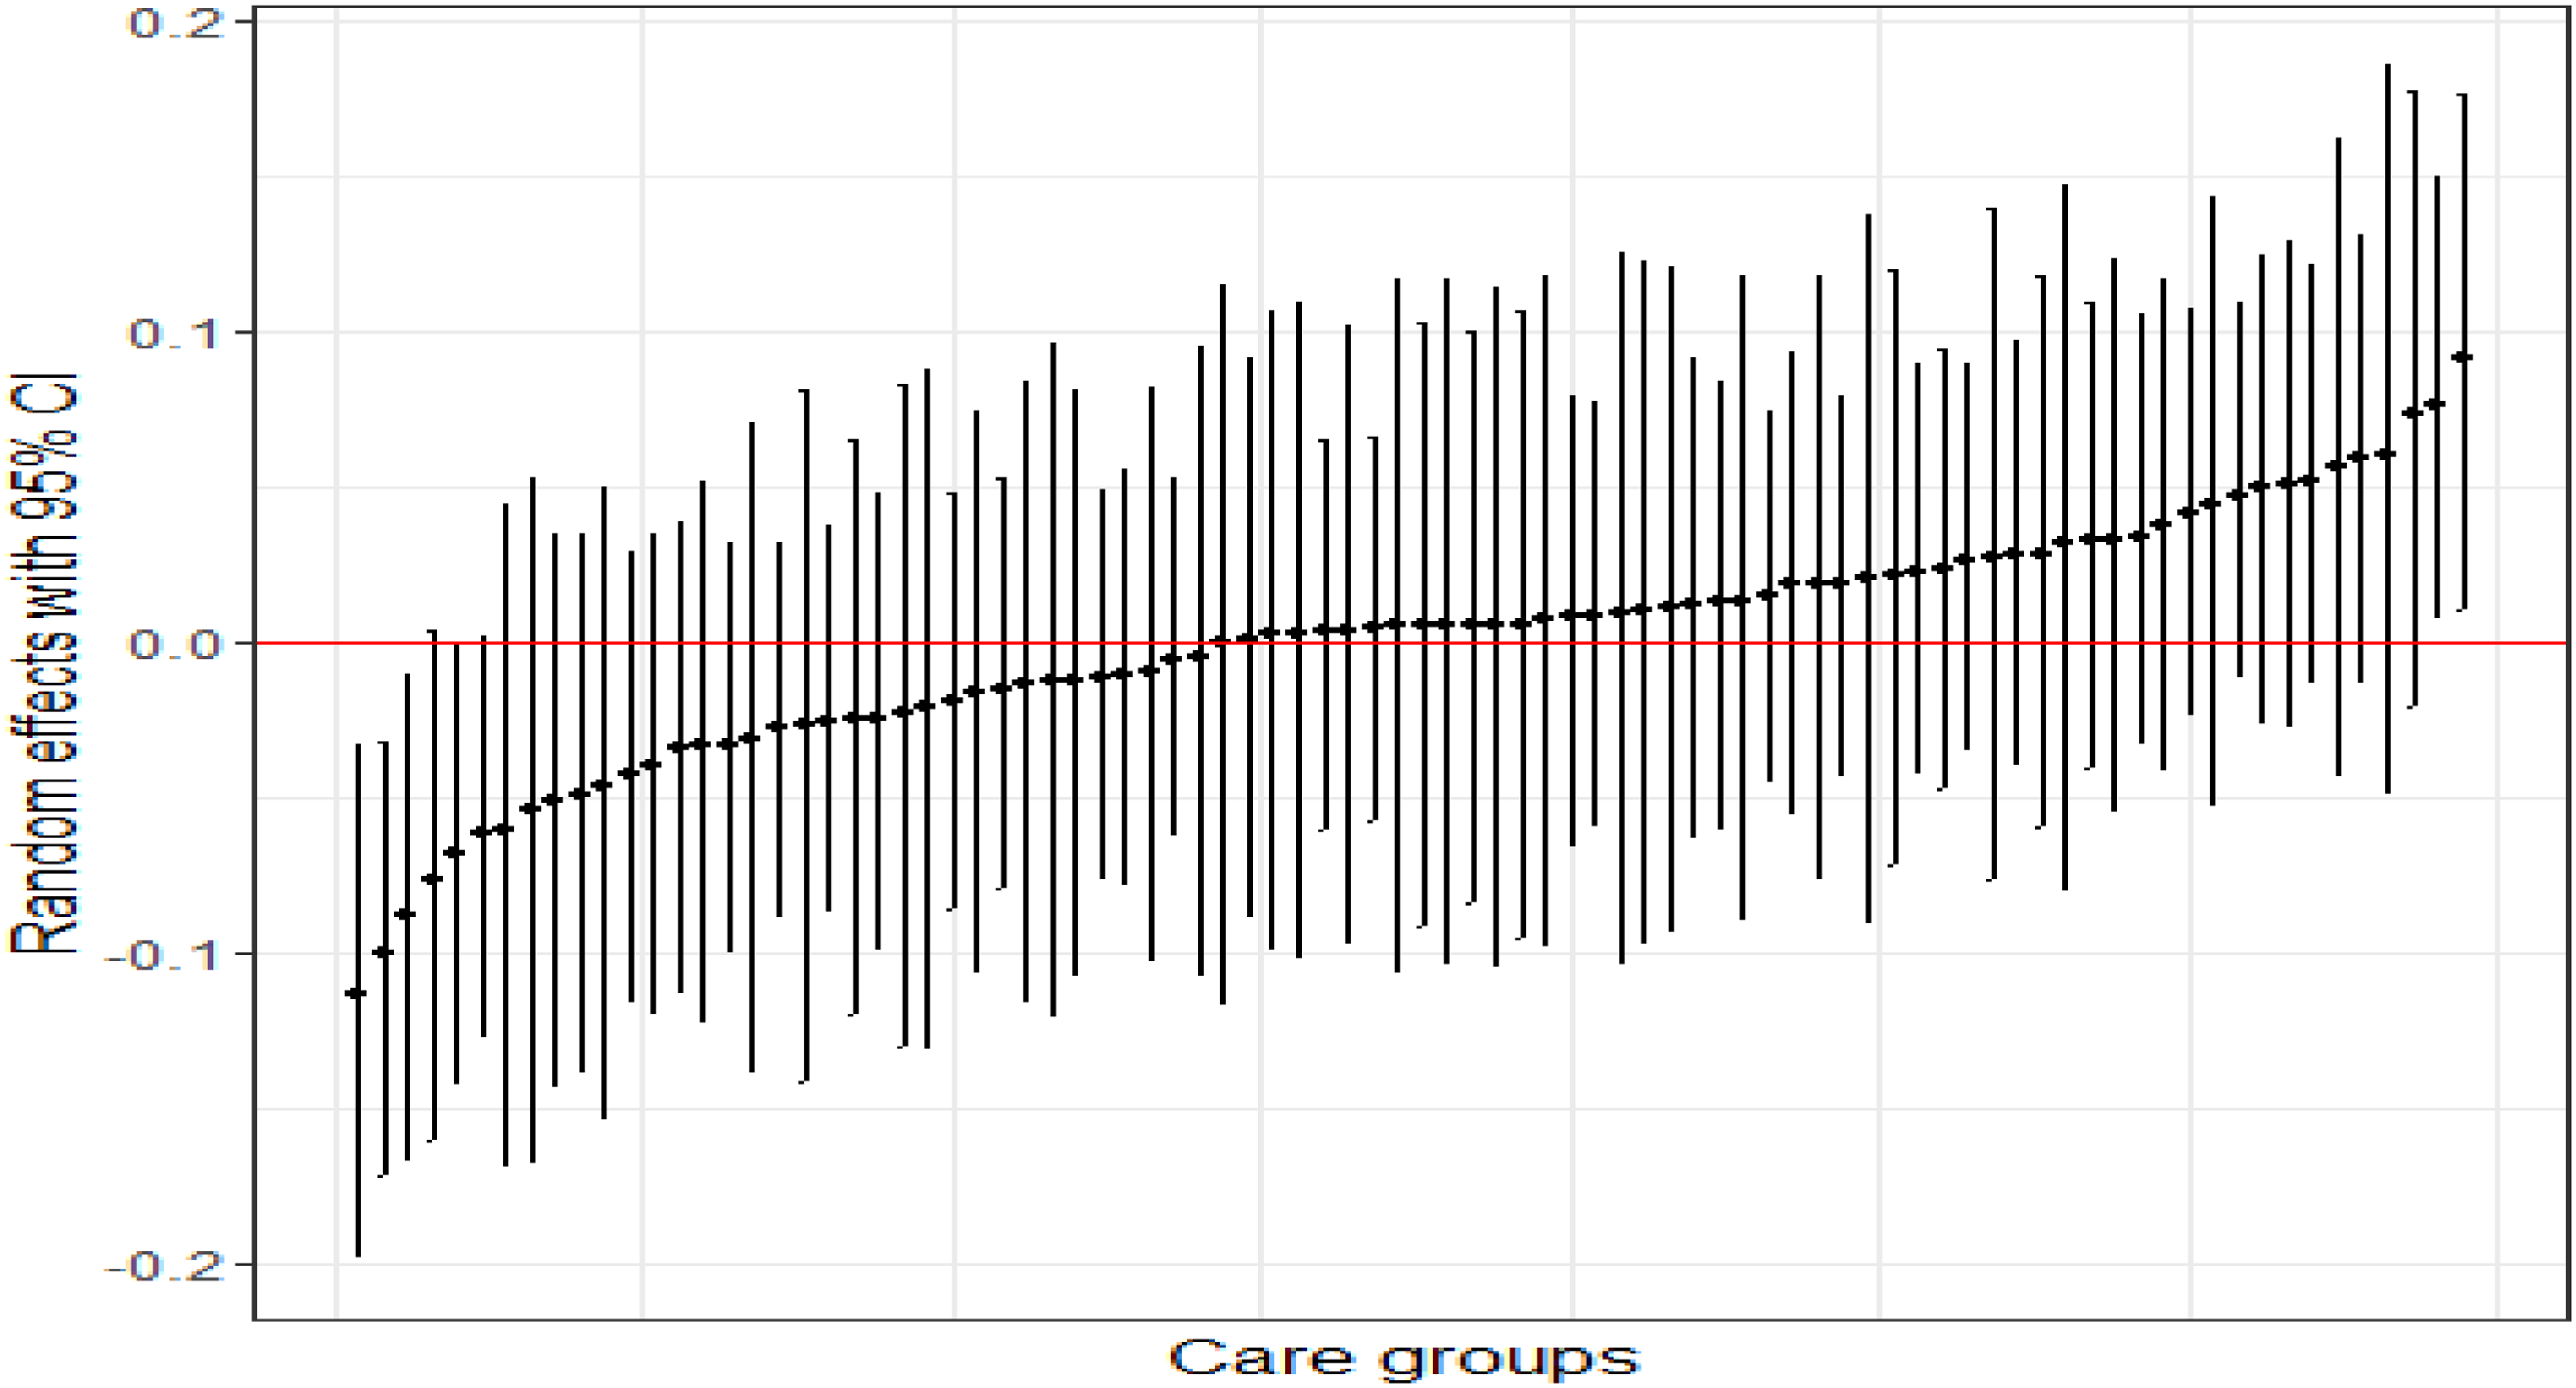
Effect ranges of the care-group-specific intercept in the full model of the long-term healthcare costs of patients in cohort 2014.
Regression results in number of complications and hospital admission days
Table 3 presents the parameter estimates for the full model on the number of complications and hospital admission days.
Bayesian multilevel regression model for the effect of care groups on the number of complications and hospital days.
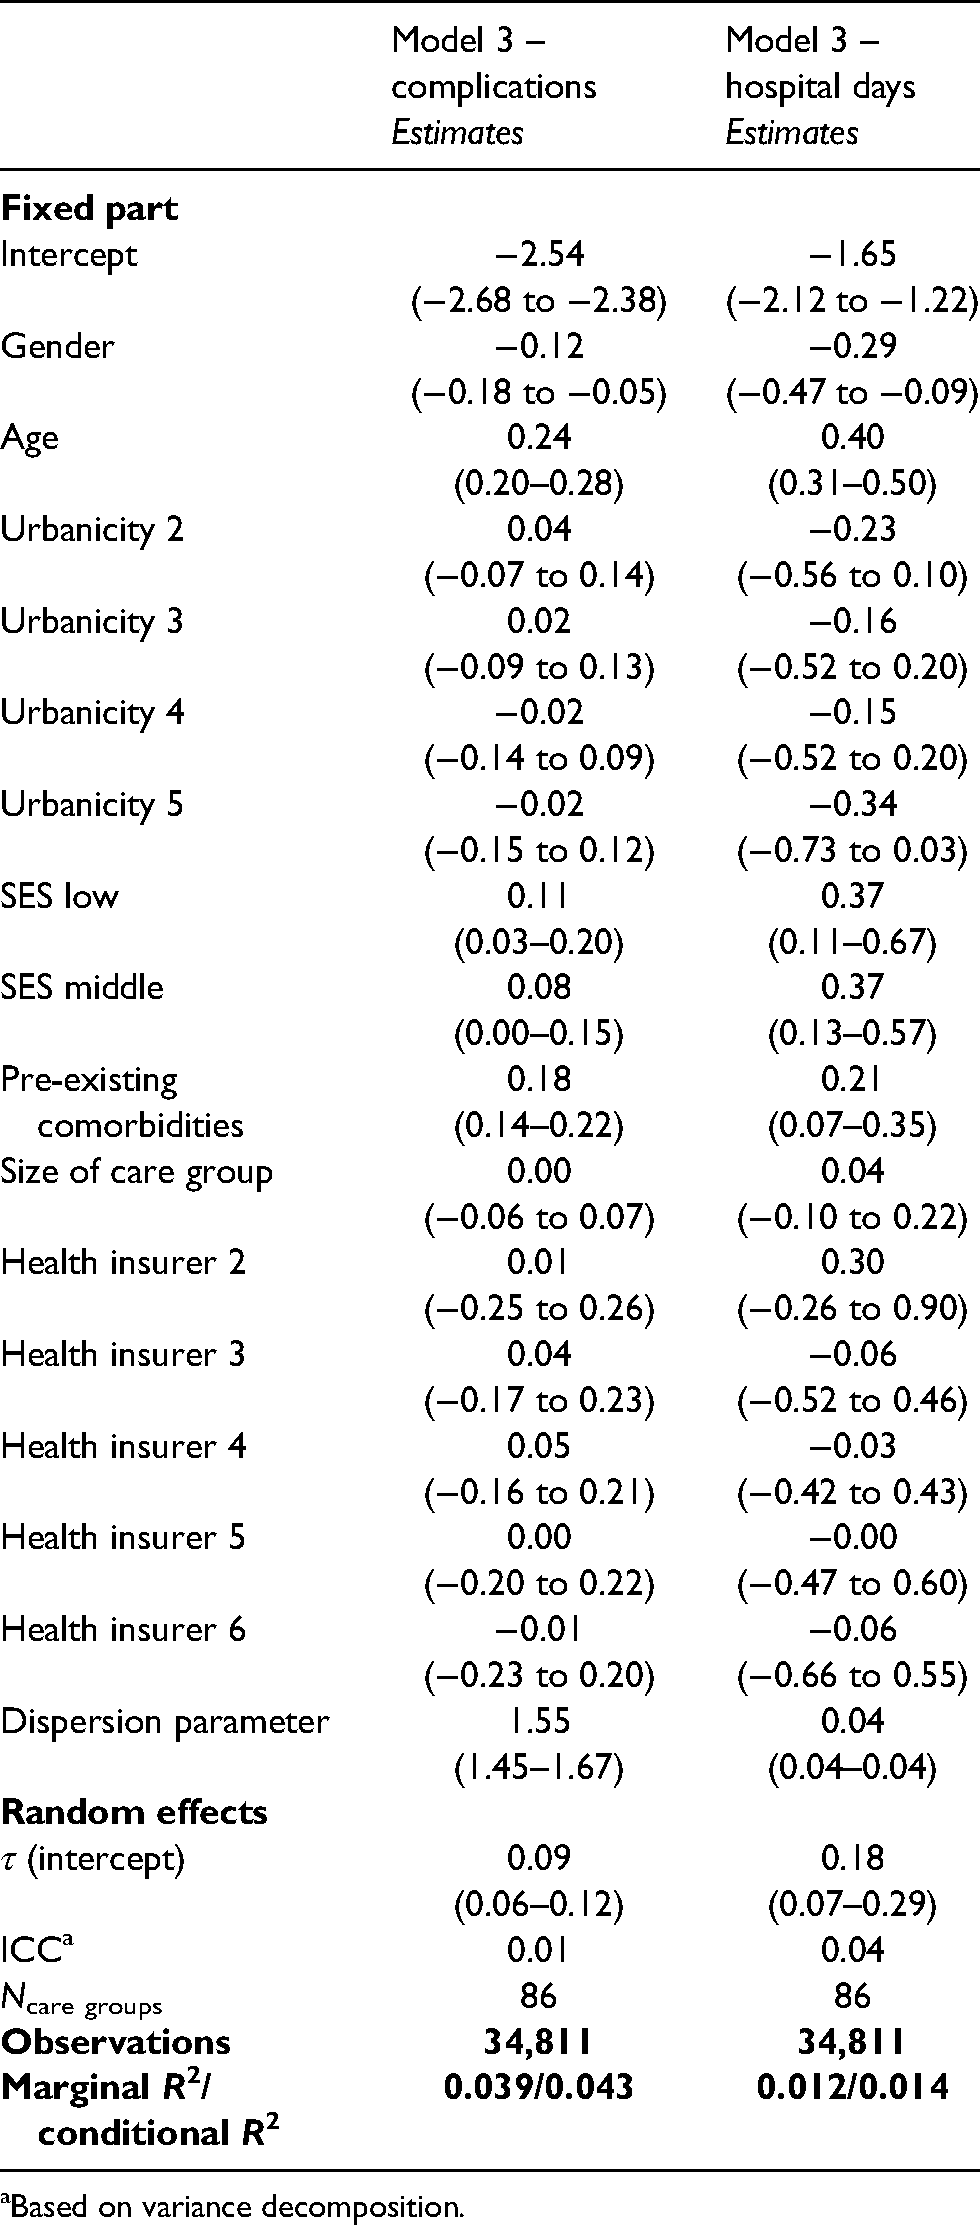
Based on variance decomposition.
The ICC in the model on complications was 0.01, calculated with the variance decomposition method. The mean of the ICCs calculated with Nakagawa’s 40 method39,40 by using 4000 posterior samples for lambda (i.e. expected number of complications) 1 and 2 was 0.009 and 0.011, respectively, which is comparable to the ICC of the variance decomposition method. In the model on hospital admission days, the ICC was 0.04.
The explained variance by the models on complications and hospitals days, that is, the R2, were 0.043 and 0.014, respectively, while the R2 of the same models without random intercept were 0.040 and 0.012, respectively. The ELPD difference, based on the LOO comparison, for the model without random intercept compared to the full model, was −29.1 (with a standard error of 7.7) for complications and −1.5 (with a standard error of 4.8) for hospital days. Both the LOO comparison and the R2 indicated a minor comparative advantage for the models with random intercept (although in the model on hospital days the difference was insignificant), which indicates that the intercepts for the care groups differ from each other.
The care-group-specific random effects (model 3) including the 95% CI ranges are displayed in Figure 2(A). The 95% CIs of the intercepts overlapped zero in all, but four care groups on the outcome complications. The variance between the care groups is larger for hospital days than for complications (Figure 2(B)), but all 95% CIs overlapped zero for the outcome of hospital days.
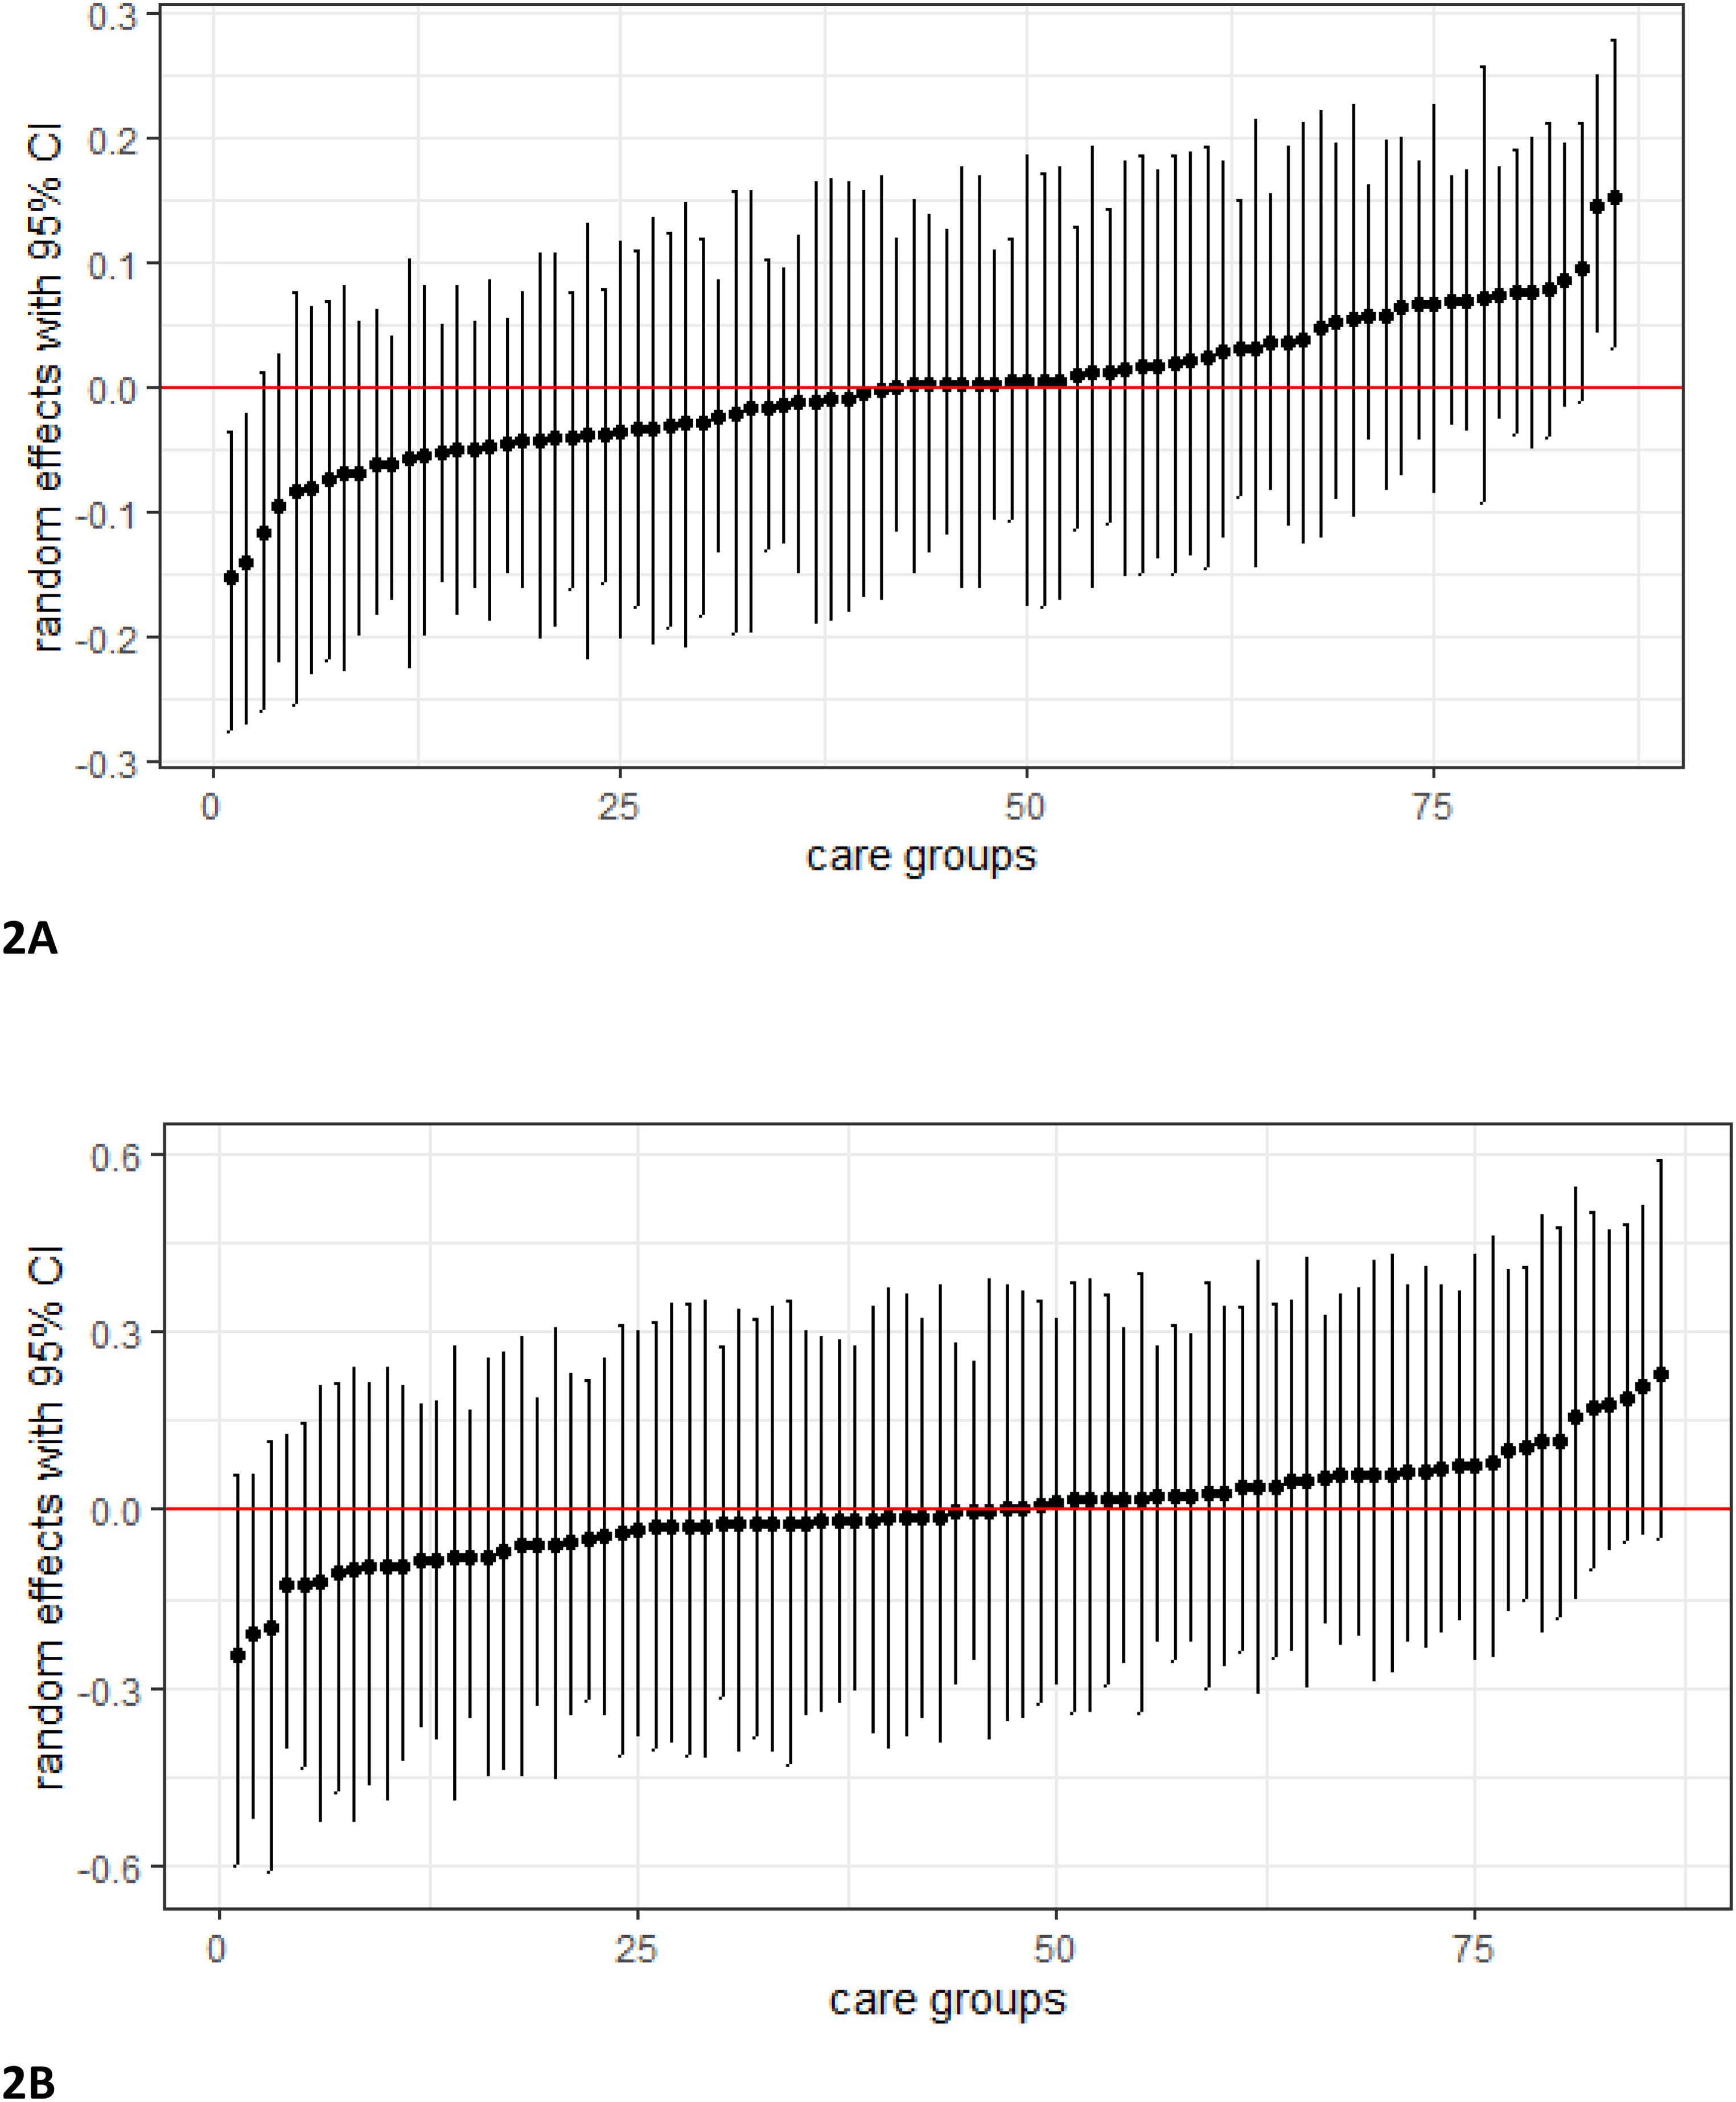
Effect ranges of the care-group-specific intercept in the full model of the diabetes-related complications of patients (A) hospital admission days of patients (B) in cohort 2014.
Short-term costs
In the analyses with short-term healthcare costs, the ICC of cohort 2014 was slightly higher than in the other cohorts; however, no consistent trend was visible throughout all the years. See Supplemental Files for the full results of the estimations.
Sensitivity analyses
All results were very similar to the primary analysis (see Supplemental Files).
Discussion
A large degree of variation exists between patients with DM2 in terms of long-term healthcare costs, diabetes-related complications and hospital days. Care groups accounted only minimally for this variation. This suggests that care groups generally perform equally regarding patients’ outcomes and costs. Our results are only generalizable to patients who used medication for their DM2 (a minimum of 180 daily defined doses for at least one year).
Our findings are consistent with a similar, previous study in this field that uses GLMM and short-term outcomes. In that study based on 2009 data, care groups also had a minimal effect on total healthcare costs. 20 A larger care group effect was found in the variation in diabetes-specific hospital costs. In the present study, the cost of diabetes-specific hospital costs was not assessed separately from the total costs. Patients were followed for 6 years, and it was hard to disentangle the cost of diabetes-specific hospital costs from that of non-diabetes-specific hospital costs because good management of diabetes prevents and delays complications in a wide variety of diseases. Therefore the present study took a broader range of costs into account than those relating to diabetes-specific costs alone. However, a closer look at diabetes-related complications and hospital admission days was taken and no considerable care group effect was observed for the outcome measures in this study.
Currently, 90% of patients with DM2 receive care based on recommended protocols and guidelines. 40 Furthermore, the longer a care program or care group exists, the better its processes and patient outcomes can become.17 The present study focused on a time period of multiple years after the implementation of integrated care, so all care groups may have reached similar levels of quality. This may explain why care groups did not have a large effect on the variation of patient outcomes in our study. Data about the maturity of the provided integrated care was not available.
Nevertheless, care groups did account for some variation in patient outcomes. This study did not explain the variation. Several factors could explain this variation. Firstly, despite the standardization of diabetes care, the guidelines are still flexible in some respects, such as the fulfilment of specific tasks and roles and the frequency of screening for risk factors. This could lead to differences in the provision of care and consequently in healthcare costs and outcomes. For example, foot care and diagnostics vary widely between care groups, and various studies show this is sometimes managed inadequately.17 The maturity of integrated care provided by the care group and the number and type of health care providers within a care group are potentially important factors. Secondly, patients’ healthcare behaviours may differ across care groups, and it was not possible to fully capture this in our study. For example, the proportion of patients who smoke differs significantly between care groups, which could contribute to differences in the development of complications and related costs.17 Thirdly, differences in hospitalizations and consequently healthcare costs could be affected by the characteristics of regional hospital care, such as payment methods, hospital working culture, and traveling distance.20,38,42 The aim of our study was to assess whether variation between care groups existed in patients’ costs and outcomes and not to explain the potential variation. Therefore, this study cannot explain the observed variation.
A new transformation from standardized care to personalized, tailored care has been introduced to increase the quality of integrated care groups. 40 Additionally, current clinical guidelines in the Netherlands are insufficient for meeting the needs of patients with multiple diseases, which results in maltreatment of adverse events. This calls for the need to move from single-disease integrated care to patient-centred care, integrating multiple care programs for different diseases.5,40 When moving away from standardized diabetes care, integrated care groups will have an increasingly large influence on outcomes. This may increase variation in patient outcomes. It is of great importance to closely follow this transformation and to study variation in outcomes again afterwards. The current study showed an analytical approach for assessing long-term variation between3,20 care groups. GLMM in combination with year cohorts seems to be a valuable tool for assessing variations in selected, measurable long-term outcomes for integrated care initiatives. Therefore, the present study could help researchers to learn from this analytic approach in their attempts to redesign diabetes care towards a more person-centred, integrated approach.
Our study has several strengths. Firstly, this study included a long (six-year) follow-up of patients.3,20 Even so, diabetes complications can take many years to arise, and the effect of care groups on these complications may still be outside the time horizon of our study. However, the specific selection of patients in our study together with the six-year follow-up did increase the likelihood of observing complications. Additionally, with respect to the efficiency of integrated care, reductions in hospital admissions were already observed within one year in other studies. 43
Secondly, patients were identified based on receiving medication for more than 180 days a year for the first time, and thus all patients were in approximately the same stage of their disease. Some general practitioners in care groups diagnose and refer patients to the integrated care program earlier than general practitioners in other care groups. 44 Therefore, simply taking all the patients newly included in the integrated care program for DM2 reduces the comparability of care group populations, producing bias in the results. Our selection made the study population more homogeneous, and thus comparisons between the care group populations were fairer as a result. This method can be an example for other studies struggling with different inclusion criteria for an integrated care program between regions. Moreover, with this method, a group of patients of specific interest when analysing possibilities to cost reduction was identified. Rather than looking at all the patients with DM2, since this group of patients incurs higher healthcare costs than the average citizen.
Thirdly, selection bias was minimized since analyses were performed on data for all Dutch citizens who used medication for DM2 and received care from care groups. Fourth, the three sensitivity analyses all led to the same overall results which strengthen the conclusion.
The study also has limitations. With respect to the medication criterion and the mean age of the sample in the present study, it is conceivable that the health of the patients included in our study had already suffered considerable damage by the start of inclusion of this study. It is questionable whether receiving treatment in a care group could still have an impact on that damage, and thus reduce complications and the associated hospitalizations and healthcare costs. This may be easier to achieve for patients who are in a less severe stage of the disease. However, disease management programs have been found to be the most beneficial for patients with poorly controlled diabetes and who have been ill for longer, 45 which means care groups could have a considerable impact on preventing complications in this population.
Secondly, no conclusions can be drawn regarding the effect of care groups versus no care groups on patients’ total healthcare costs, complications and number of hospital days. With the most recent data, it is impossible to make this comparison because almost all patients in the primary care are treated by a care group. Patients not treated by a care group are generally different from patients treated by a care group (for example in a more severe stage of the disease).
Thirdly, in line with the existing literature, some significant factors were identified that influenced patients’ healthcare costs and complications, and SES was included as a variable that was excluded from previous studies. Based on the generally low explained variance of our models, much of the variation is caused by chance or could be explained by unobserved characteristics outside the scope of this study. Many variables can influence the performance of care groups and patient outcomes. Examples of factors that could not be included in this study but could potentially have influenced our outcomes to include ethnicity, 1 duration of the disease, 45 self-reported health status, 27 and level of education. 46 Data on supply variables (such as regional capacity or physicians beliefs) were also unavailable. 27 Some of these variables were partly captured using the variables included in the present study.
Fourth, the aim of the present study was not to explain potential variation between care groups. The aim of this study was to assess whether the variation is observed between care groups. Therefore, several potentially important factors contributing to variation in the care delivery between care groups were not included. For example, data about the maturity of the care group, the number and type of professionals in the care group and details about the care delivery of health care providers included in the care group (in comparison to care from providers not included in a care group). The care groups included in the present study existed for at least six years, but we do not know whether all care groups reached the same level of maturity regarding the provision of integrated diabetes care. It could take over ten years to reach a reasonable mature level of integration and thus the long-term effect of integrated care initiatives may not be visible yet. 8
Finally, there may have been some underestimation of the number of complications. Since complications were identified based on DTCs, it is possible that some complications were registered under DTCs that were not identified as diabetes-related in this study. In addition, every complication was counted only once, even in cases where a patient developed that complication multiple times. Patients can recover from some complications, and thus they can occur repeatedly. The present study did not capture these, which could also have resulted in underestimation.
Future research may focus on other outcome measures such as patient satisfaction and patient-reported outcome measures (PROMs) in order to broaden the scope of the effect measures. Furthermore, future studies should include more data on participant characteristics and supply variables, data on patients at other stages of the disease and data with a longer follow-up period to detect more complications. Future studies could learn from the analytical approach presented in this study for assessing long-term variation between care groups. If the significant variation is observed, it is important to understand this variation.
The long-term healthcare costs, diabetes-related complications and hospital days of patients with DM2 vary significantly, but care groups seem to account only minimally for this variation. GLMM in combination with year cohorts is a tool to study variations in the long-term outcomes of integrated care initiatives.
Footnotes
Availability of data and material
The individual level data used in this study is not publicly available due to privacy laws.
Code availability
The code used for the analyses is available from the corresponding author on reasonable request
Declaration of conflicting interests
The authors declared no potential conflicts of interest with respect to the research, authorship, and/or publication of this article.
Funding
The authors received no financial support for the research, authorship, and/or publication of this article.
Supplemental material
Supplemental material for this article is available online.
References
Supplementary Material
Please find the following supplemental material available below.
For Open Access articles published under a Creative Commons License, all supplemental material carries the same license as the article it is associated with.
For non-Open Access articles published, all supplemental material carries a non-exclusive license, and permission requests for re-use of supplemental material or any part of supplemental material shall be sent directly to the copyright owner as specified in the copyright notice associated with the article.