
Abstract
Background:
With the rising prevalence of diabetes, machine learning (ML) models have been increasingly used for prediction of diabetes and its complications, due to their ability to handle large complex data sets. This study aims to evaluate the quality and performance of ML models developed to predict microvascular and macrovascular diabetes complications in an adult Type 2 diabetes population.
Methods:
A systematic review was conducted in MEDLINE®, Embase®, the Cochrane® Library, Web of Science®, and DBLP Computer Science Bibliography databases according to the PRISMA (Preferred Reporting Items for Systematic Reviews and Meta-Analyses) checklist. Studies that developed or validated ML prediction models for microvascular or macrovascular complications in people with Type 2 diabetes were included. Prediction performance was evaluated using area under the receiver operating characteristic curve (AUC). An AUC >0.75 indicates clearly useful discrimination performance, while a positive mean relative AUC difference indicates better comparative model performance.
Results:
Of 13 606 articles screened, 32 studies comprising 87 ML models were included. Neural networks (n = 15) were the most frequently utilized. Age, duration of diabetes, and body mass index were common predictors in ML models. Across predicted outcomes, 36% of the models demonstrated clearly useful discrimination. Most ML models reported positive mean relative AUC compared with non-ML methods, with random forest showing the best overall performance for microvascular and macrovascular outcomes. Majority (n = 31) of studies had high risk of bias.
Conclusions:
Random forest was found to have the overall best prediction performance. Current ML prediction models remain largely exploratory, and external validation studies are required before their clinical implementation.
Protocol Registration:
Open Science Framework (registration number: 10.17605/OSF.IO/UP49X).
Introduction
Diabetes mellitus is a rapidly growing health epidemic, with the number of people with diabetes projected to increase from 463 million (9.3% global prevalence) in 2019 to 700 million (10.9% global prevalence) in 2045.1,2 Complications from diabetes are prevalent, with over 50% and 25% of people with Type 2 diabetes shown to suffer from microvascular and macrovascular complications, respectively. 3 These complications often lead to physical, psychological, and functional impairments,4,5 resulting in a strain on health care systems.1,6
Early intervention is a key strategy in the management of Type 2 diabetes to slow disease progression.7,8 The ability to accurately predict an individual’s risk of developing diabetes complications would aid physicians planning disease management and enable policymakers to better distribute health care resources. The duration of diabetes, severity of hyperglycemia, presence of hypertension, and genetic predisposition are well-established clinical risk factors for Type 2 diabetes complications. 9 However, other biological, 10 lifestyle, 1 socioeconomic, 11 and psychological 12 factors also play important roles in the clinical course of diabetes progression. The multitude of factors, many of which may also be inter-related, makes it difficult to predict the risk of long-term complications.
Machine learning (ML) is a branch of artificial intelligence that involves algorithms to make predictions based on existing data. 13 These methods have been increasingly utilized for health care applications in recent years.14,15 Compared with traditional statistical approaches, ML methods are better able to handle large complex data sets. 16 In the field of diabetes research, ML methods, such as support vector machine, have been applied for risk prediction and to identify predictive and diagnostic biomarkers of diabetes.14,17 Cluster analysis has also been used to identify groups of patients with different characteristics and risk of developing diabetes complications.18,19
Existing reviews of prediction models for microvascular20-23 and macrovascular24,25 complications of diabetes have largely centered on non-ML methods. Another three reviews that summarized the applications of ML in diabetes research did not focus on diabetes complications.14,17,26 Therefore, this review aims to evaluate the quality and performance of ML models developed to predict microvascular and macrovascular diabetes complications in an adult Type 2 diabetes population.
Methods
Study Design
We conducted a systematic review in accordance with the “Preferred reporting items for systematic reviews and meta-analyses” (PRISMA) checklist. 27 The “Checklist for Critical Appraisal and Data Extraction for Systematic Reviews of Prediction Modelling Studies” (CHARMS) was used to frame this review’s objective. 28
Search Strategy
MEDLINE® (via PubMed®), Embase®, the Cochrane® Library, Web of Science®, and DBLP Computer Science Bibliography databases were searched for articles published from inception till March 31, 2020. The DBLP database was included to search for ML studies not indexed by Web of Science® or the other health-related databases. Hand-searching of references within included articles was conducted to shortlist other potential articles. Our search strategy utilized a combination of subject terms related to “machine learning,” “prediction,” and “diabetes complications” (Electronic supplementary material (ESM) Table 1).
The protocol for this review has been registered on Open Science Framework (Registration number: 10.17605/OSF.IO/UP49X; available from: https://doi.org/10.17605/OSF.IO/UP49X).
Brief Overview of ML Methods
ML methods can be broadly divided into supervised and unsupervised learning. In supervised learning, the target variable is known by the algorithm, and the algorithm is trained on labeled data sets to predict this variable. 13 For unsupervised learning, there is no “correct answer” for the algorithm to predict and it learns to identify patterns within unlabelled data sets. 29 Examples of supervised learning include support vector machine and neural network, while that of unsupervised learning include clustering and manifold learning. A brief description of common ML methods is presented in ESM Table 2.
Eligibility Criteria
Full-text, English language articles that developed or validated prognostic ML models in an adult (age ≥ 18 years old) Type 2 diabetes population were included. The outcomes of interest were microvascular and macrovascular complications of diabetes (retinopathy, neuropathy, nephropathy, heart disease, stroke, and peripheral vascular disease).
Case reports, case series, irrelevant reviews, and meta-analyses were excluded. We also excluded diagnostic ML models and prognostic ML models that predicted diabetes onset without complications. Logistic regression, penalized regression, and generalized additive models were not considered as ML methods in our review and were excluded. 30
In this review, prognostic ML models refer to models that predict the probability of the future occurrence of the disease in an individual, while diagnostic models predict the disease status of an individual.
Study Selection
Two independent reviewers (K.R.T. and Y.J.C.) reviewed the abstracts of retrieved articles and assessed the full text of relevant studies for eligibility. Disagreements during the selection process were discussed to reach a consensus. A third independent reviewer (J.J.B.S.) was consulted for arbitration of unresolved disagreements.
Data Extraction
Data were extracted using a standardized form comprising items from CHARMS 28 and “Transparent Reporting of a multivariable prediction model for Individual Prognosis Or Diagnosis” (TRIPOD) guidelines. 31
CHARMS was designed to guide the systematic review of prediction modeling studies and provides a list of relevant items to extract from studies, while TRIPOD comprises a checklist of 22 items developed to guide the reporting of prediction models.
The information extracted included publication details, study design and objectives, predicted outcomes, participant profile, sample size, model development process, model performance, and evaluation.
Corresponding authors of included studies were contacted for additional details when required.
Data Analysis
Predictor variables used in ML methods were grouped into seven categories, namely demographics, history, physical examination, laboratory investigations, other investigations, treatment, and other variables (ESM Table 3).
To obtain an indication of sufficient sample size and risk of overfitting the data for ML models, events per variable was used. This was derived by dividing the number of events of interest by the number of predictor variables. Machine learning techniques are suggested to have an events per variable of more than 200 to minimize overfitting. 32
The performance of each ML model was evaluated using AUC and C-statistics. Area under the receiver operating characteristic curve and C-statistics describe the likelihood that a model will make a positive prediction. For example, an AUC of <0.5 indicates that the model makes a positive prediction less than 50% of the time. An AUC or C-statistic of <0.60, 0.6–0.75, and >0.75 were regarded as having poor, possibly helpful, and clearly useful discrimination, respectively. 33
To compare the performance of different ML methodologies, plots of relative AUC and C-statistic difference were made. The relative AUC difference was calculated using the following formula:
Relative AUC difference = (ML model − comparison model)/comparison model × 100%
Mean relative AUC difference was calculated by averaging the relative AUC differences for that model, and positive values indicate better comparative model performance.
A meta-analysis was not conducted because of the substantial heterogeneity across included studies with regard to study design, model development, and validation methodologies.
Assessment of Bias
The quality of included studies was assessed by two independent reviewers (K.R.T. and Y.J.C.) for risk of bias using the “Prediction model Risk Of Bias Assessment Tool” (PROBAST). 34 All disagreements were resolved through discussions with a third independent reviewer (J.J.B.S.).
Evaluation of Cumulative Evidence
The quality of cumulative evidence for studies that reported AUC as their performance metric was assessed and included all ML algorithms that predicted a similar outcome in at least two studies. As there were no Grading of Recommendations, Assessment, Development and Evaluations (GRADE) guidelines available for prognostic models, the GRADE approach for diagnostic tests and strategies was adapted. 35
Three factors were considered: risk of bias, indirectness, and imprecision. Because of the inconsistent reporting of confidence intervals and the heterogeneity across studies, results from multiple studies were not pooled, and assessment of inconsistency and publication bias was not made.
Results
Overview
Of 13 606 citations retrieved, 125 articles were identified for full-text screening and 32 articles were included in the final analyses (Figure 1). There were 30 model development studies and 2 model validation studies.
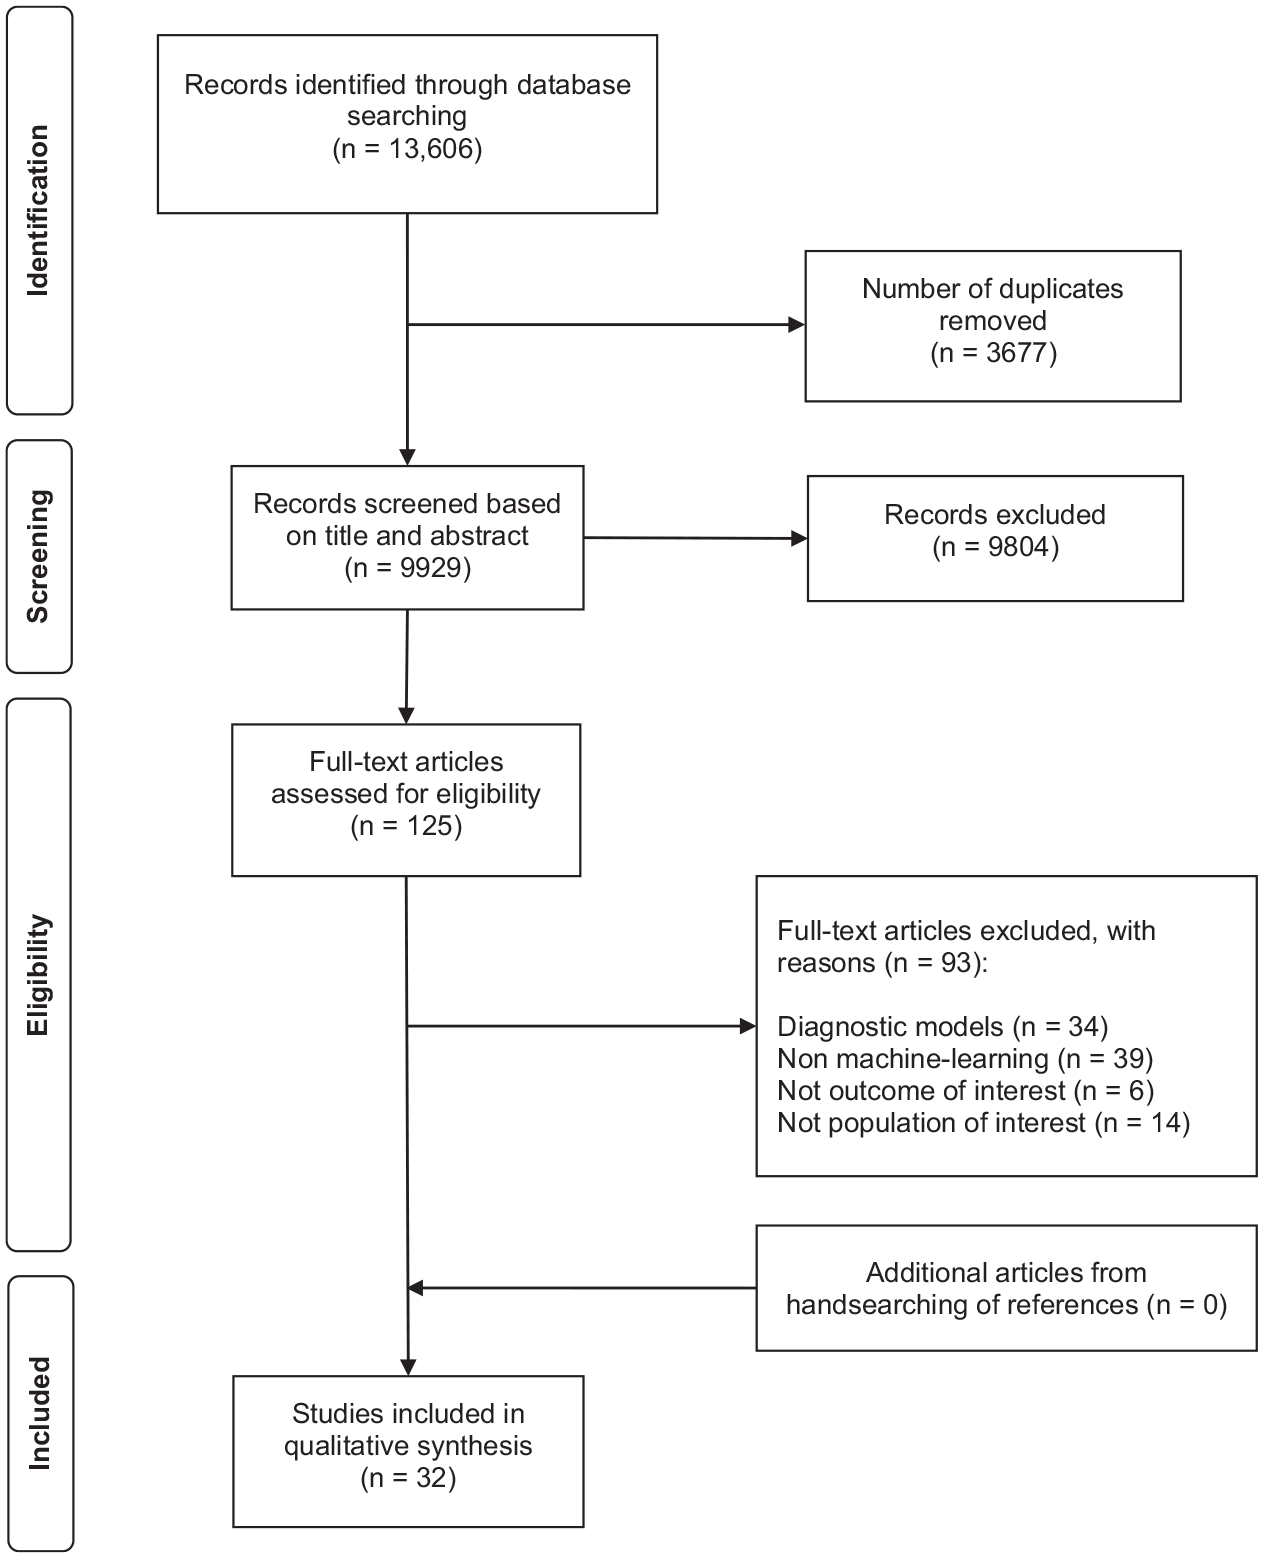
Preferred Reporting Items for Systematic Reviews and Meta-Analyses flow diagram for study selection.
Study Characteristics
Majority of studies were retrospective in design (n = 29), with over half of the development (n = 17) and validation (n = 6) data sets having sample sizes larger than 1000. Most model development studies (n = 14) had an events per variable below 10, with only 2 (7%) having an events per variable above 200. The events per variable were all below 10 for external validations (Table 1).
Study Characteristics of Included Studies.
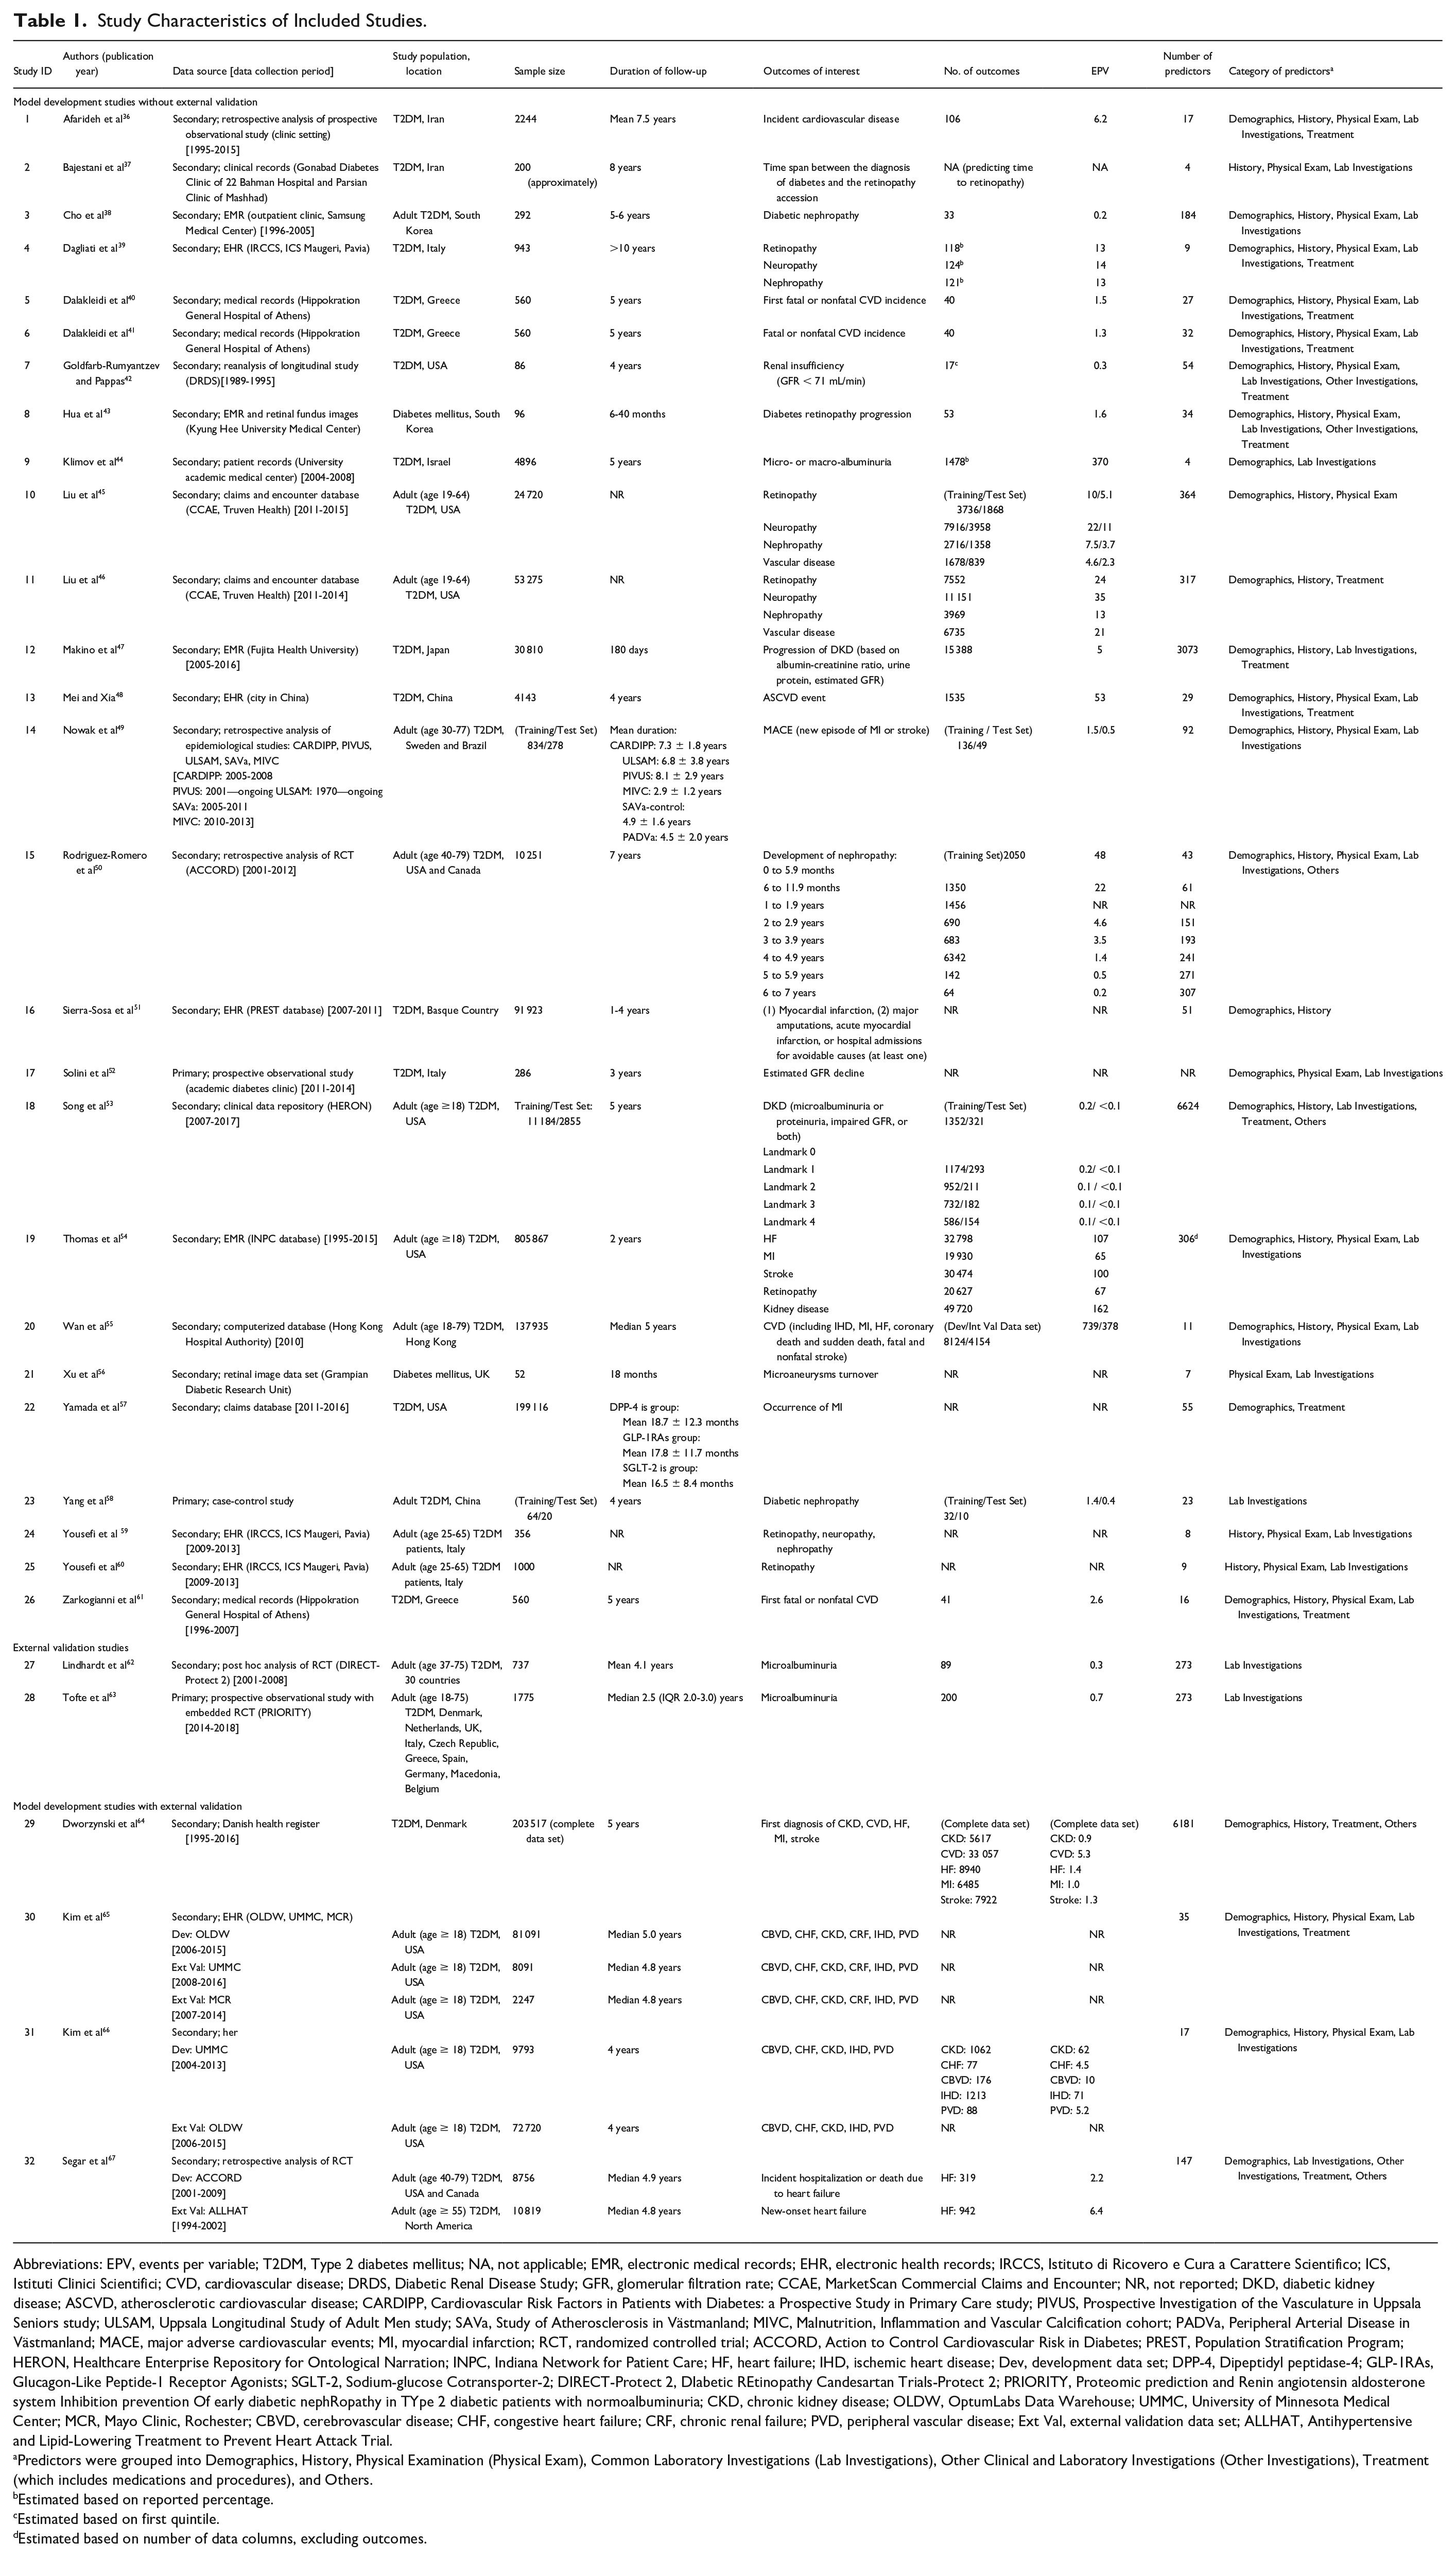
Abbreviations: EPV, events per variable; T2DM, Type 2 diabetes mellitus; NA, not applicable; EMR, electronic medical records; EHR, electronic health records; IRCCS, Istituto di Ricovero e Cura a Carattere Scientifico; ICS, Istituti Clinici Scientifici; CVD, cardiovascular disease; DRDS, Diabetic Renal Disease Study; GFR, glomerular filtration rate; CCAE, MarketScan Commercial Claims and Encounter; NR, not reported; DKD, diabetic kidney disease; ASCVD, atherosclerotic cardiovascular disease; CARDIPP, Cardiovascular Risk Factors in Patients with Diabetes: a Prospective Study in Primary Care study; PIVUS, Prospective Investigation of the Vasculature in Uppsala Seniors study; ULSAM, Uppsala Longitudinal Study of Adult Men study; SAVa, Study of Atherosclerosis in Västmanland; MIVC, Malnutrition, Inflammation and Vascular Calcification cohort; PADVa, Peripheral Arterial Disease in Västmanland; MACE, major adverse cardiovascular events; MI, myocardial infarction; RCT, randomized controlled trial; ACCORD, Action to Control Cardiovascular Risk in Diabetes; PREST, Population Stratification Program; HERON, Healthcare Enterprise Repository for Ontological Narration; INPC, Indiana Network for Patient Care; HF, heart failure; IHD, ischemic heart disease; Dev, development data set; DPP-4, Dipeptidyl peptidase-4; GLP-1RAs, Glucagon-Like Peptide-1 Receptor Agonists; SGLT-2, Sodium-glucose Cotransporter-2; DIRECT-Protect 2, DIabetic REtinopathy Candesartan Trials-Protect 2; PRIORITY, Proteomic prediction and Renin angiotensin aldosterone system Inhibition prevention Of early diabetic nephRopathy in TYpe 2 diabetic patients with normoalbuminuria; CKD, chronic kidney disease; OLDW, OptumLabs Data Warehouse; UMMC, University of Minnesota Medical Center; MCR, Mayo Clinic, Rochester; CBVD, cerebrovascular disease; CHF, congestive heart failure; CRF, chronic renal failure; PVD, peripheral vascular disease; Ext Val, external validation data set; ALLHAT, Antihypertensive and Lipid-Lowering Treatment to Prevent Heart Attack Trial.
Predictors were grouped into Demographics, History, Physical Examination (Physical Exam), Common Laboratory Investigations (Lab Investigations), Other Clinical and Laboratory Investigations (Other Investigations), Treatment (which includes medications and procedures), and Others.
Estimated based on reported percentage.
Estimated based on first quintile.
Estimated based on number of data columns, excluding outcomes.
Predictors and Outcomes
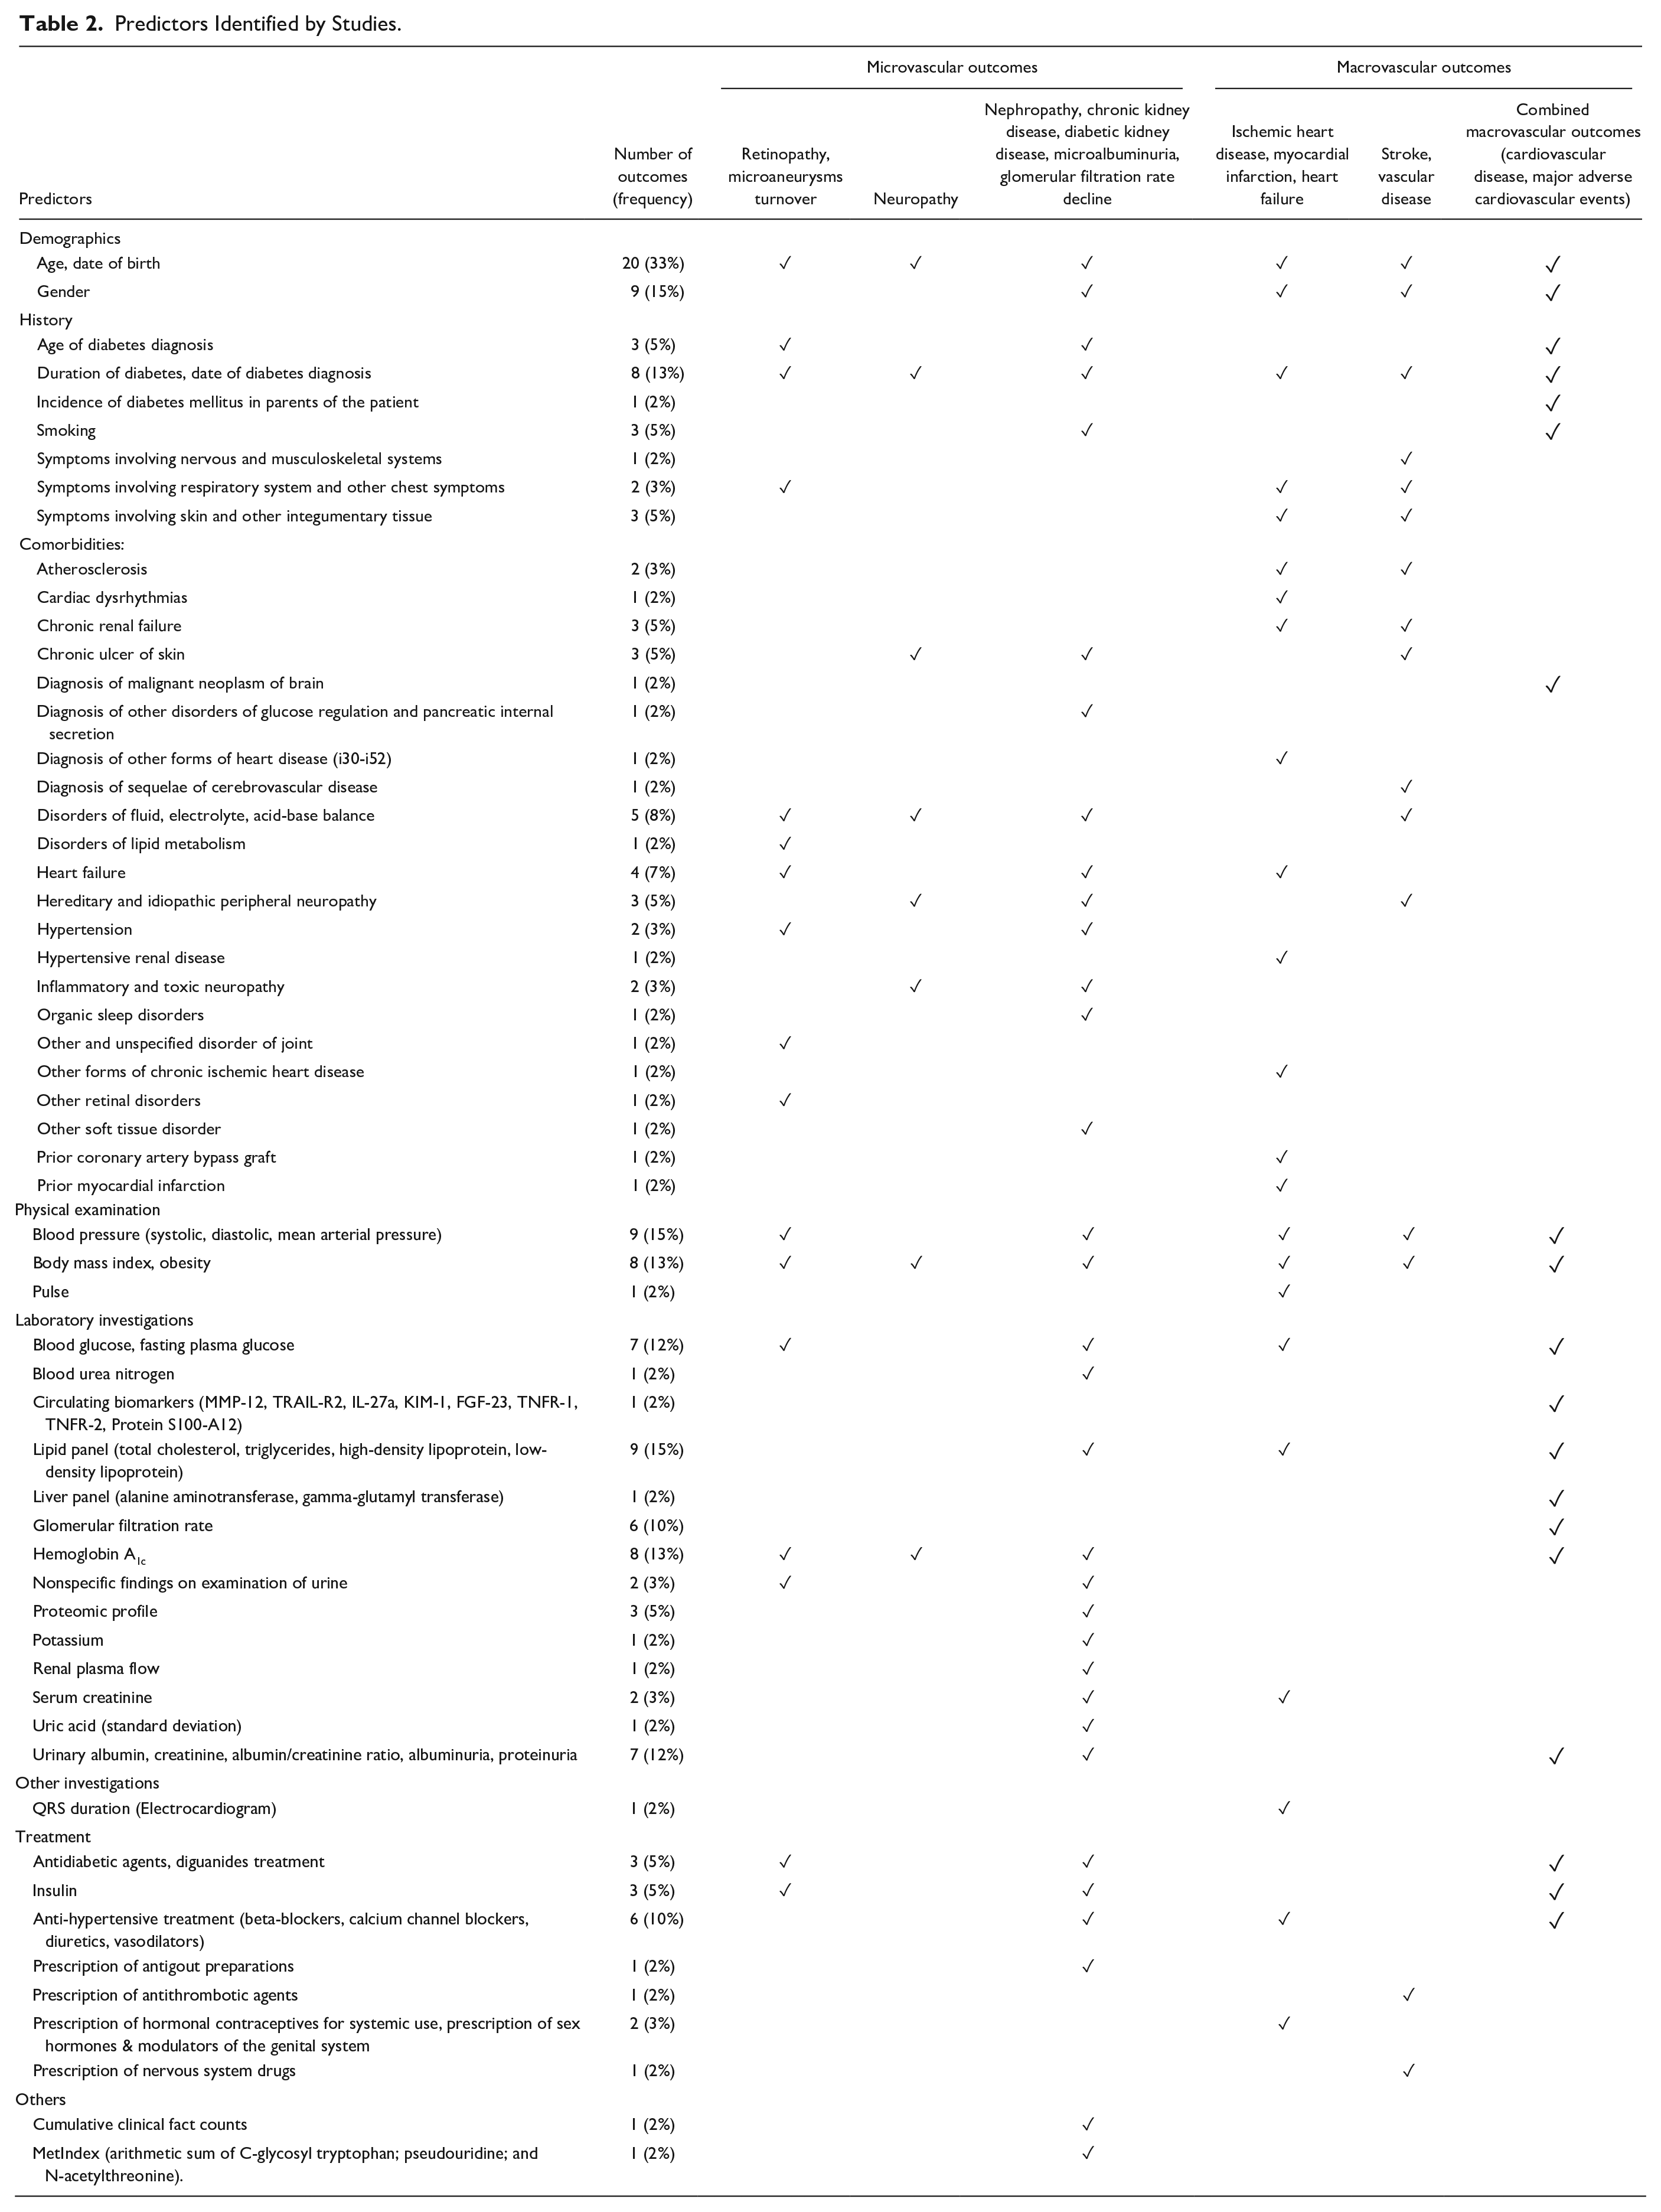
Of the 60 outcomes identified, microvascular complications (n = 32), specifically kidney-related complications, were the most often studied (n = 19). Age (n = 20) was the most frequently used variable to predict these outcomes. Other predictors common across all microvascular and macrovascular outcomes include duration of diabetes (n = 8) and body mass index (n = 8) (Table 2).
Predictors Identified by Studies.
ML Models
A total of 87 ML models were identified. Majority were supervised learning methods of which neural networks (n = 15) and Bayesian algorithms (n = 8) were the most well-studied methodologies (Table 3). The details of model development and validation for individual studies are summarized in ESM Table 4.
List of ML Methods in Included Studies.
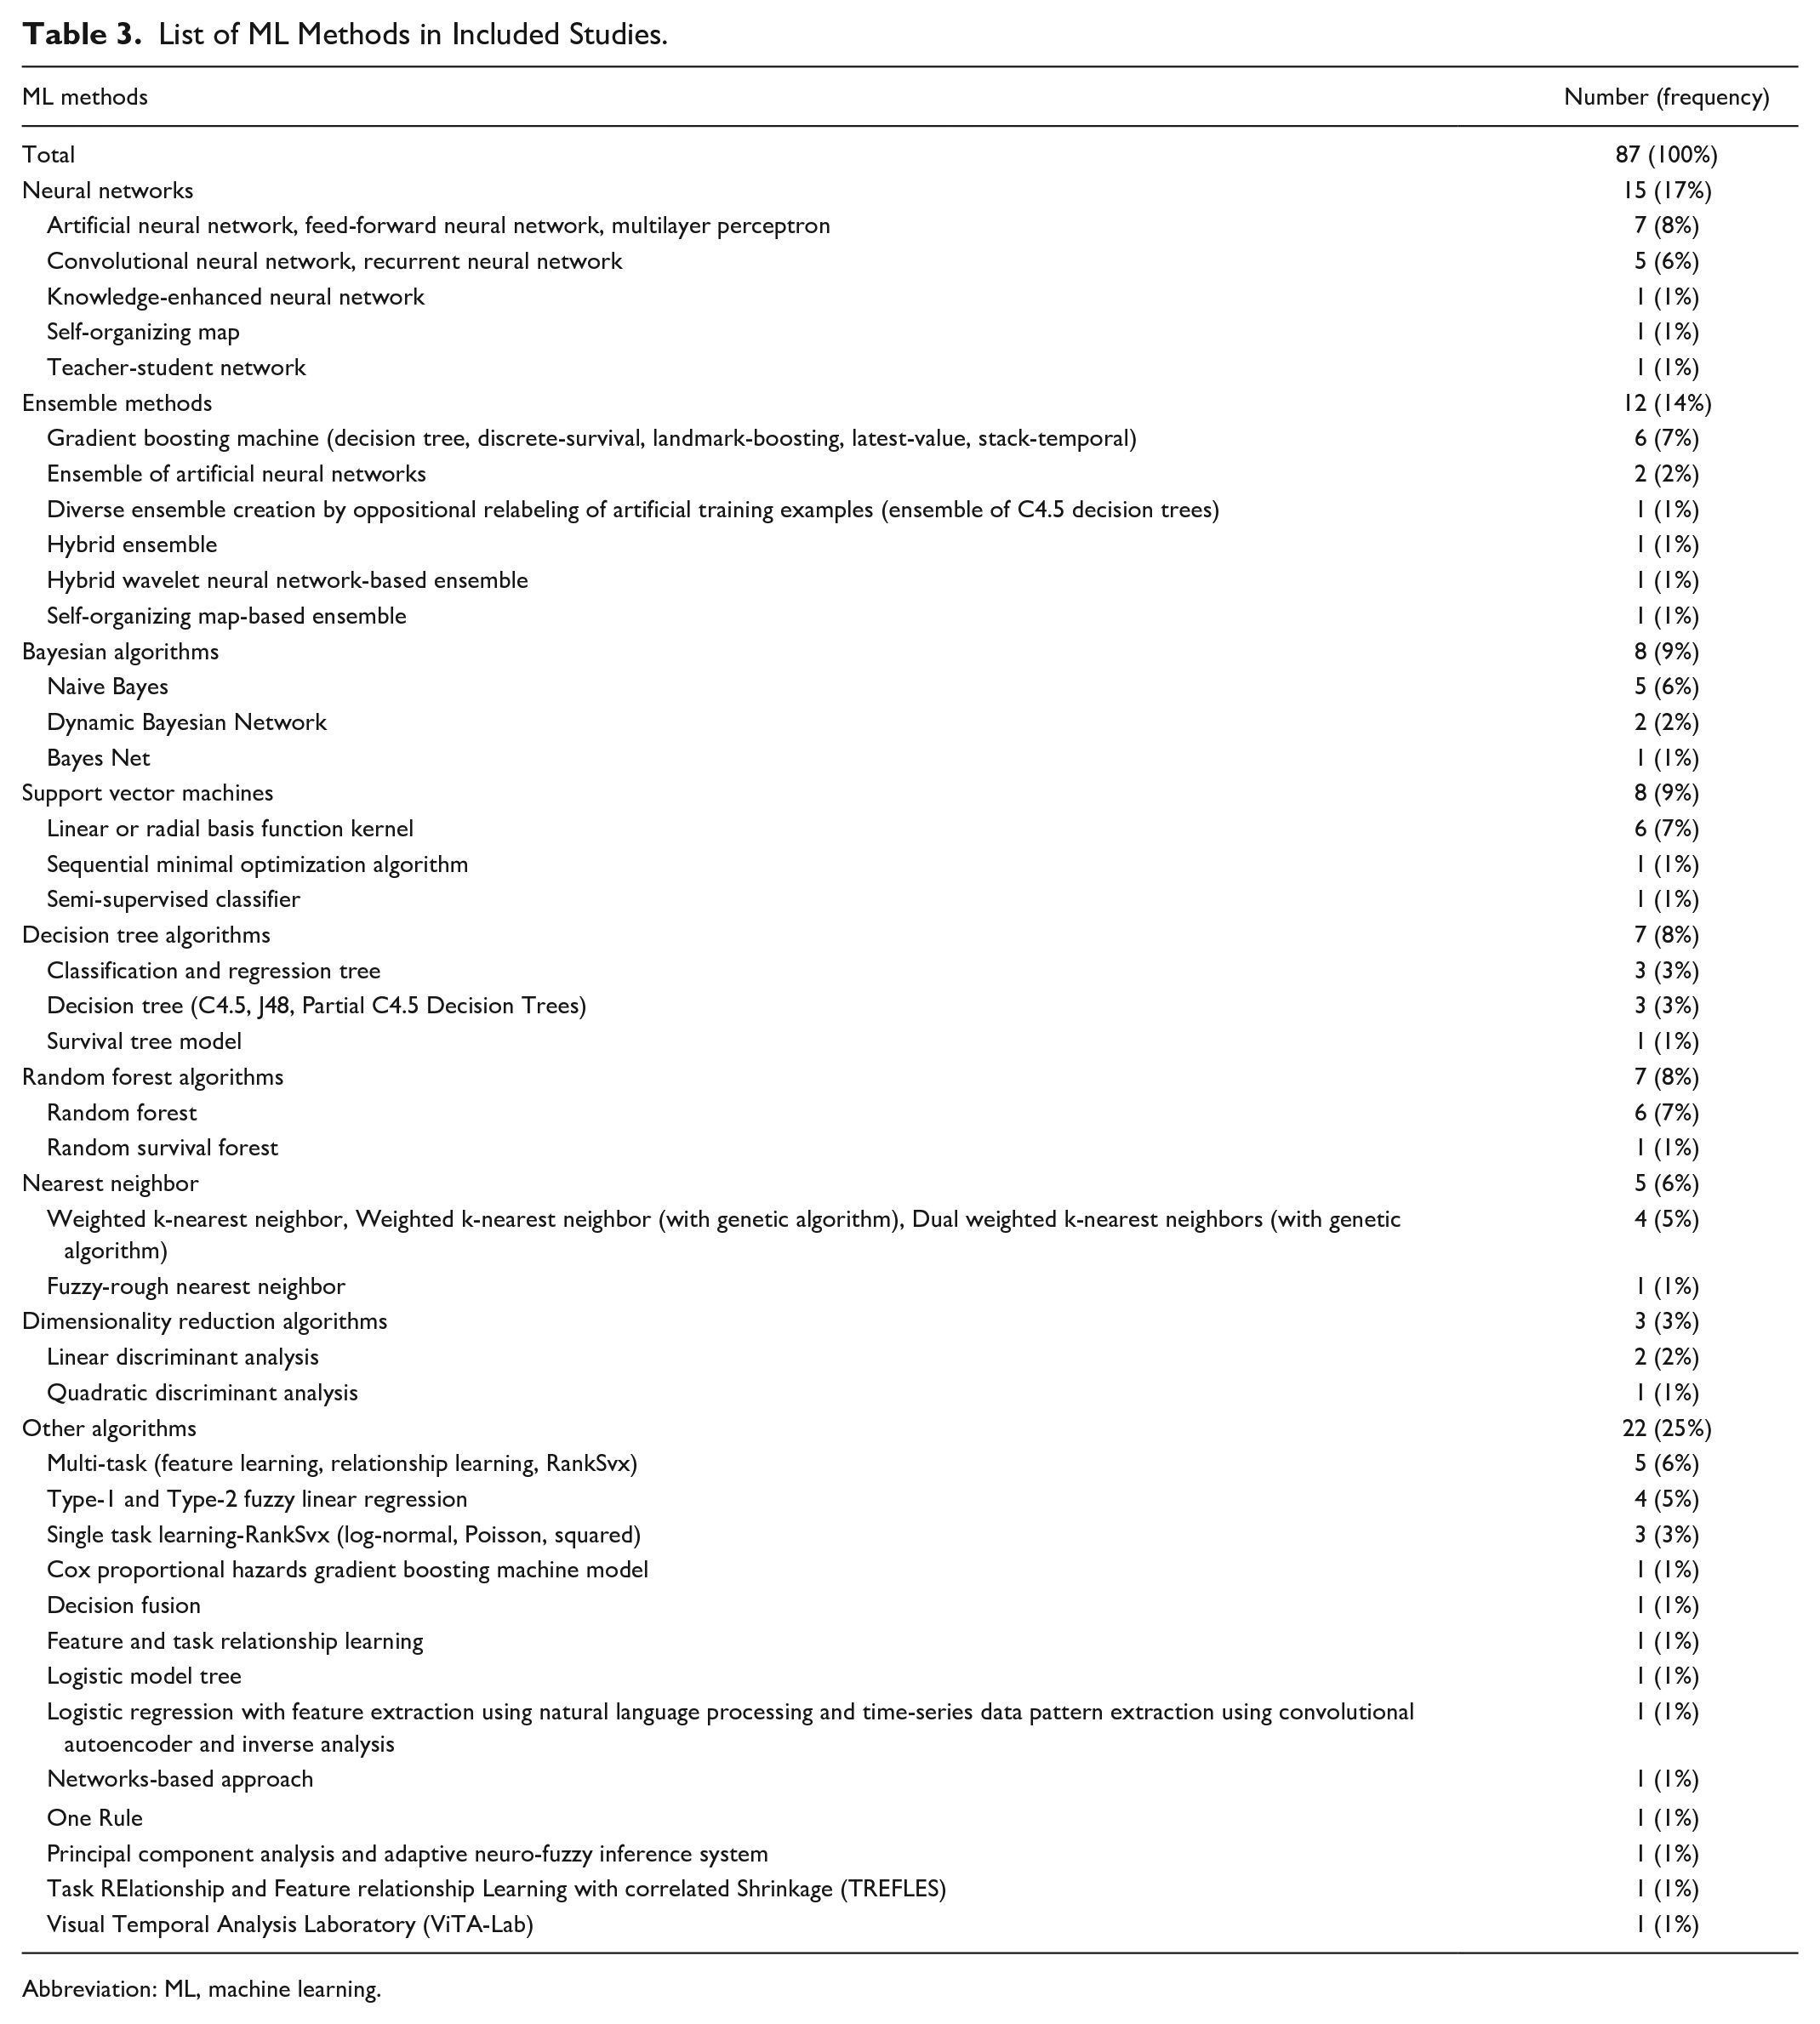
Abbreviation: ML, machine learning.
Model Performance
Across all predicted outcomes (n = 278), only 36% (n = 100) of ML models demonstrated clearly useful discrimination. 46% (n = 127) showed a possibly helpful discrimination, while 18% (n = 51) showed poor discrimination ability. For microvascular outcomes, four ML methods showed better performance: neural network (mean AUC = 0.87), decision tree (mean AUC = 0.86), support vector machine (mean AUC = 0.84), and random forest (mean AUC = 0.84). For macrovascular outcomes, ML model performance was generally lower, with ensemble methods (mean AUC = 0.70), neural network (mean AUC = 0.69), and random forest (mean AUC = 0.69) showing relatively better performance (Figure 2).
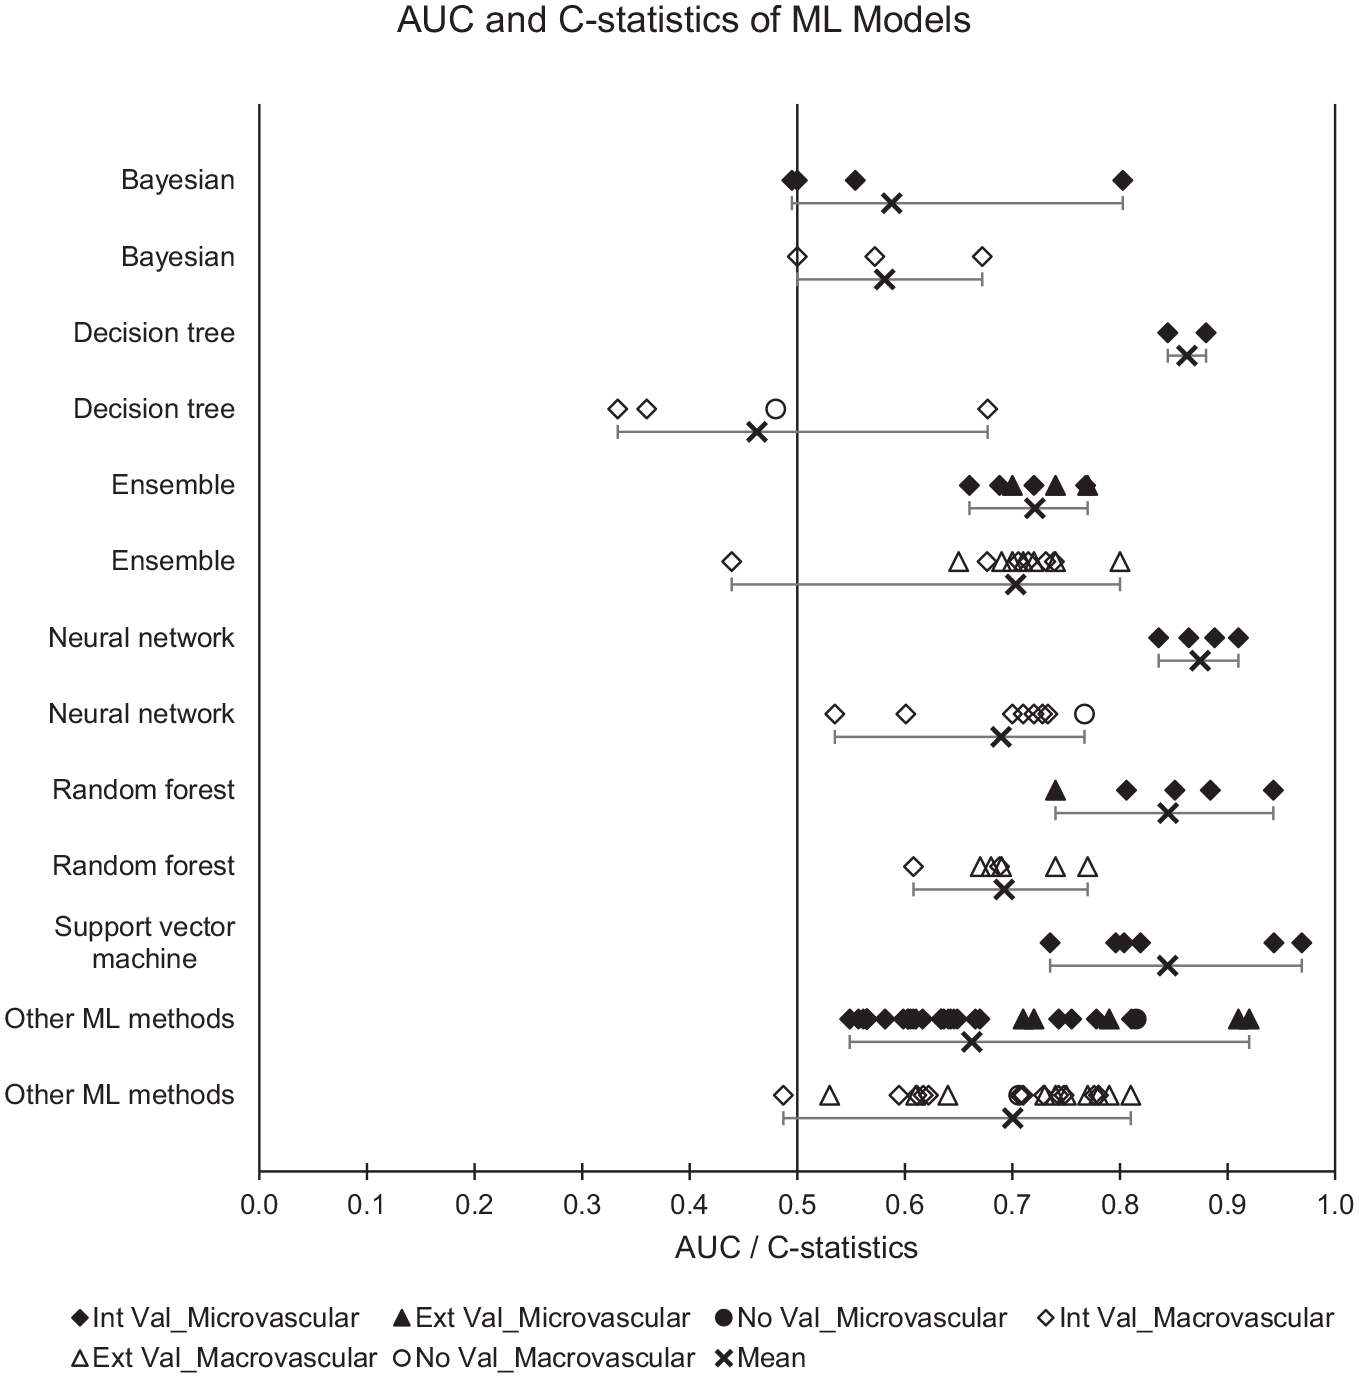
Plot of AUC and C-statistics with minimum-mean-maximum for ML models. Abbreviations: AUC, area under the receiver operating characteristic curve; ML, machine learning; Black, microvascular outcomes; White, macrovascular outcomes; Diamond, Internal validation (Int Val); Triangle, External validation (Ext Val); Circle, No validation (No Val); Cross with horizontal bars, Minimum–Mean–Maximum across studies; Int Val, internal validation; Ext Val, external validation; No Val, no validation.
A summary plot of AUC and C-statistics for individual studies is provided in ESM Figure 1.
Comparison of Model Performance
Assessment of relative model performance was made based on studies that evaluated multiple prediction models. From the 16 comparison studies, ML methodologies had better performance than non-ML models such as logistic regression and Cox models. For microvascular outcomes, all ML methods had a positive mean relative AUC difference, except for Bayesian algorithms (mean relative AUC difference = −26%). For macrovascular outcomes, most ML methods showed comparable or better performance than non-ML methods, except for decision tree (mean relative AUC difference = −14%) and Bayesian algorithms (mean relative AUC difference = −1%) (Figure 3a).
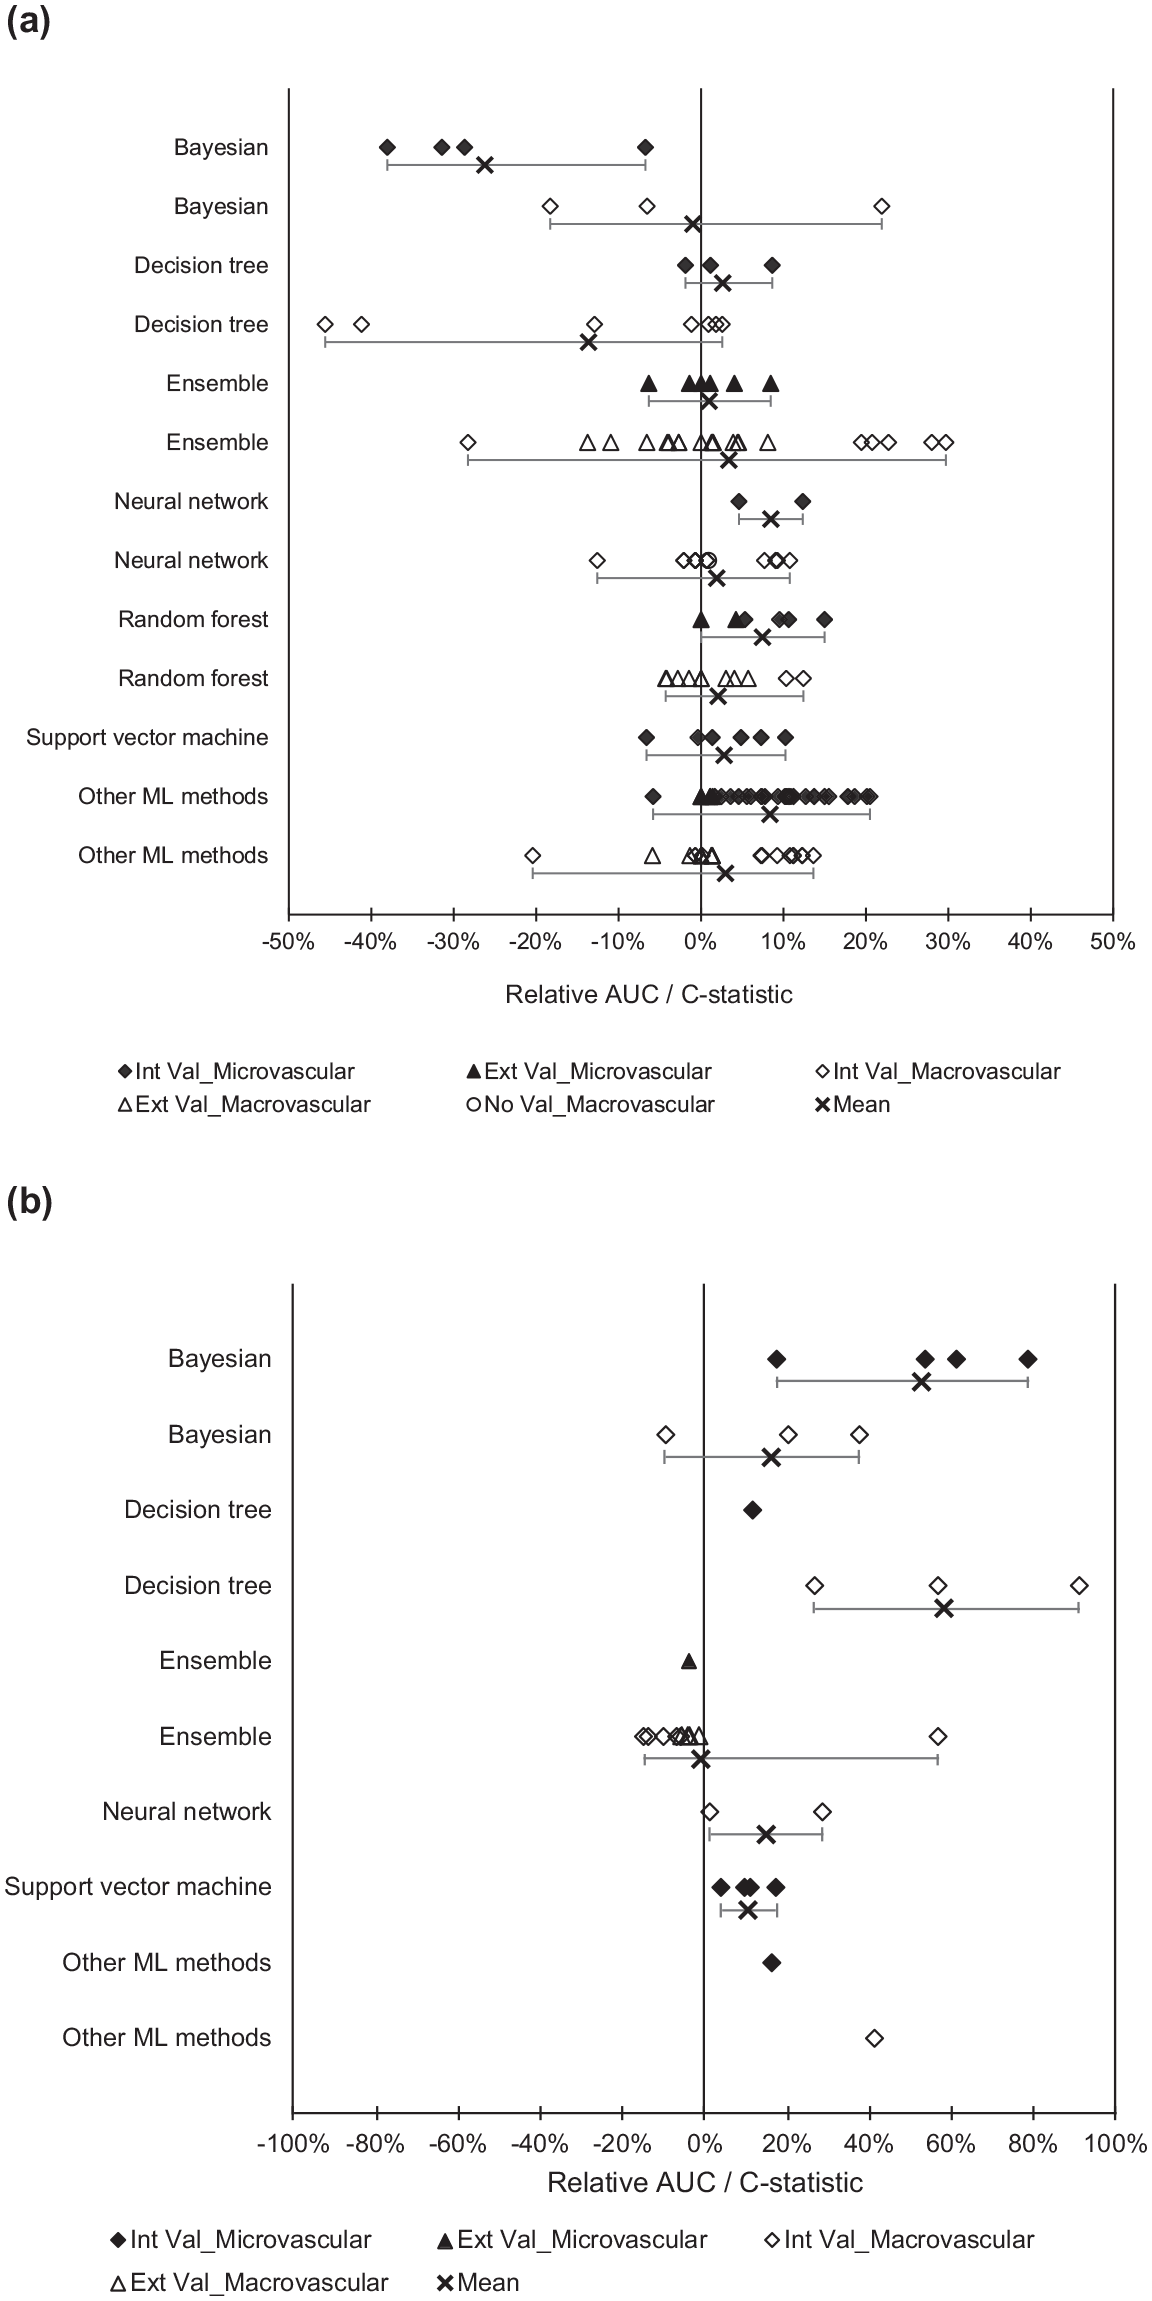
Plot of relative AUC difference with minimum-mean-maximum. Comparison of (a) ML and non-ML models and (b) random forest with other ML methods. Abbreviations: AUC, area under the receiver operating characteristic curve; ML, machine learning; Black, microvascular outcomes; White, macrovascular outcomes; Diamond, Internal validation (Int Val); Triangle, External validation (Ext Val); Circle, No validation (No Val); Cross with horizontal bars, Minimum–Mean–Maximum across studies; Int Val, internal validation; Ext Val, external validation; No Val, no validation.
For microvascular outcomes, random forest was the overall best performing model (mean relative AUC difference from 10% to 53%) (Figure 3b). Support vector machines only showed better performance than Bayesian algorithms (mean relative AUC difference = 39%), while neural network was found to perform better than decision tree in one study (relative AUC difference = 3%).
For macrovascular outcomes, random forest was again the overall best performing model (mean relative AUC difference from 15% to 58%) 61 (Figure 3b). Neural networks (mean relative AUC difference = 32%) and Bayesian algorithms (mean relative AUC difference = 36%) performed better than decision tree algorithms.
The comparative performance of support vector machine, neural network, Bayesian, and decision tree algorithms is represented in ESM Figure 2.
Model Evaluation
A large proportion of model development studies (n = 27) conducted internal validation. Resampling methods such as bootstrap and cross-validation were the most frequently used (n = 18). Three studies did not provide information on any form of internal or external validation.44,57,59 Only six studies performed external validations of ML models.
Summary of Bias and Applicability
Most studies (n = 31) were rated to have high risk of bias while one study was rated as unclear risk of bias. The risk of bias was mainly in the analysis domain, because of low events per variable (for development studies), low number of outcomes (for validation studies), not reporting relevant performance measures (overall performance, discrimination, or calibration), lack of internal validation with resampling methods, and dichotomization of continuous predictor variables (ESM Table 5).
Confidence in Cumulative Evidence
The quality of cumulative evidence for the discrimination performance of ML algorithms was low to very low, because of the high risk of bias in studies, indirectness of outcomes, and imprecision of results (ESM Table 6).
Discussion
This review has evaluated the performance of 87 prognostic prediction ML models for diabetes complications in people with Type 2 diabetes. Most ML models reported an AUC between 0.6 and 0.75 (possibly helpful discrimination), while 36% achieved an AUC above 0.75 (clearly useful discrimination). 33
From 16 comparison studies, ML methods generally showed better performance than non-ML methods. It must be noted, however, that these studies were rated at high risk of bias. This was similar to a review by Christodoulou et al, which found that the performance of ML and non-ML methods for prediction of clinical outcomes in the general population using models with low risk of bias were comparable. However, they noted that comparisons among models with high risk of bias tended to favor ML methods. 30
Among ML methods, random forest showed an overall better discrimination ability for both microvascular and macrovascular outcomes. A possible explanation is that random forest combines multiple models to overcome the limitations of single models, thereby reducing variance and improving prediction accuracy.
In terms of predictors used in ML models, common predictors for both microvascular and macrovascular outcomes include age, duration of diabetes, and body mass index. Prolonged hyperglycemia is known to cause vascular damage through nonenzymatic glycosylation of proteins, oxidative stress, and inflammation. 68 Likewise, the relationship between age and diabetic complications has been linked to age-related impaired vascular function such as arterial stiffening, increased insulin resistance, and obesity. 66 The relationship between body mass index and diabetes complications is less clear, with a previous study suggesting that it was positively correlated with diabetic kidney disease but not with diabetic retinopathy. 69 Given that age and duration of diabetes can be obtained from electronic health data sets and their clinical relevance in the development of diabetes complications, researchers should consider including them when developing future ML predictive models.
In terms of model development, many studies were limited by small number of outcomes examined and sample sizes, often with events per variable below 10. In addition, internal validations with resampling and external validations were inconsistently performed. This raises concerns of model overfitting and optimism, as ML techniques have been found to require significantly larger events per variable (>200) to achieve a stable AUC and a small optimism compared with traditional statistical methods such as logistic regression. 32
The ML models in this review were considered largely exploratory, and future validation studies are required before clinical implementation. 16 For studies with externally validated models, further model-impact studies should also be considered. 70 For example, the random survival forest-based model developed by Segar et al, 67 which was validated in a diabetes population with high cardiovascular risk, require further validation in a general setting with lower-risk individuals with Type 2 diabetes. Likewise, support vector machine classifier developed by Good et al would benefit from further studies to determine the cost-effectiveness of utilizing urinary proteomics (which is more expensive than standard urine albumin tests) as predictors in clinical practice.
The overall reporting quality was not standardized across studies, where details such as inclusion and exclusion criteria, method of measure of outcomes, and relevant performance measures were omitted in several studies. In view of the inconsistencies in reporting across studies, future developers of prediction models should consider adopting the reporting guidelines recommended by TRIPOD. 31 All development studies should also perform internal validation with resampling methods such as bootstrap, to quantify model overfitting and optimism. 34
Based on the findings from this review, future researchers may wish to consider the use of random forest algorithms either as the primary prediction model or as a comparison model during evaluation. Another ensemble method—extreme gradient boosting (XGBoost)—which was not covered in this review has also shown good prediction performance and can be explored in future studies. 71
It is important to recognize that the prediction performance of ML models is heavily dependent on the choice of data (for training and testing) and the tuning of model parameters. For example, class imbalance due to small minority class and poor-quality data sets can affect prediction accuracy. 72 Consequently, fair evaluation and comparisons can only be made through standardized benchmark testing with fixed data sets. We propose for data-sharing via open-access data sets to be made available to researchers for external validation of their prediction models. Future studies could also look at standardizing the various outcome definitions for diabetes complications to allow for more objective comparisons of prediction models across different studies.
Finally, to facilitate the clinical translation of models, it is important to select predictors that can be readily obtained in clinical practice (eg, demographics and routine investigations such as fasting blood glucose) and to ensure that ML model predictions can be easily interpreted.
Strengths and Limitations
We have conducted a comprehensive review of ML prediction models for diabetes complications using a broad search strategy to include a wide range of ML methods. Through our detailed assessment of the model development process and prediction performance, we have also identified potential ML models and clinical variables for future research, as well as highlighted key research gaps.
Nonetheless, this review is presented with the following limitations. First, we could only evaluate model performance based on discrimination measures (AUC and C-statistics), as calibration measures were lacking in most studies. Second, we were unable to pool the model performance across studies because of the heterogeneity of included studies. Instead, comparisons were made using the relative AUC difference calculated from studies that evaluated multiple prediction models. Finally, only publications in English language were included in this review. However, our preliminary screen without language restrictions did not find any potentially relevant publications in other languages.
Conclusions
The performance of ML methods mostly ranged from acceptable to good, with random forest showing an overall better performance for predicting diabetes complications. There is a need to improve the overall reporting quality of studies, with most studies rated at high risk of bias. Existing ML models are largely exploratory, with further validation studies needed before they can be implemented in clinical practice.
Supplemental Material
sj-docx-1-dst-10.1177_19322968211056917 – Supplemental material for Evaluation of Machine Learning Methods Developed for Prediction of Diabetes Complications: A Systematic Review
Supplemental material, sj-docx-1-dst-10.1177_19322968211056917 for Evaluation of Machine Learning Methods Developed for Prediction of Diabetes Complications: A Systematic Review by Kuo Ren Tan, Jun Jie Benjamin Seng, Yu Heng Kwan, Ying Jie Chen, Sueziani Binte Zainudin, Dionne Hui Fang Loh, Nan Liu and Lian Leng Low in Journal of Diabetes Science and Technology
Footnotes
Abbreviations
AUC, area under the receiver operating characteristic curve; CHARMS, checklist for Critical Appraisal and Data Extraction for Systematic Reviews of Prediction Modeling Studies; GRADE, Grading Of Recommendations, Assessment, Development and Evaluations; ICD, International Classification of Diseases; ML, machine learning; PRISMA, Preferred Reporting Items for Systematic Reviews and Meta-Analyses; PROBAST, Prediction model Risk Of Bias Assessment Tool.
Authors’ Contribution
LLL is the study’s principal investigator. YHK, JJBS, and LLL conceptualized the research question. KRT, YJC, and JJBS are the independent reviewers for this study. LLL, NL, JJBS, YHK, and DHFL provided expertise on refining the search strategy and data extraction form. KRT and YJC performed the screening of articles, data extraction, and risk of bias assessment. KRT was responsible for analyzing the data and drafted the initial manuscript. All authors critically reviewed and contributed to subsequent draft revisions and approved the final manuscript.
Declaration of Conflicting Interests
The author(s) declared no potential conflicts of interest with respect to the research, authorship, and/or publication of this article.
Funding
The author(s) disclosed receipt of the following financial support for the research, authorship, and/or publication of this article: This research was supported by the National Innovation Challenge Grant by Ministry of Health, Singapore (Ref: MOH/NIC/CDM1/2018) and the AM-ETHOS Duke-NUS Medical Student Fellowship Award (Ref: AM-ETHOS01/FY2020/28-A28).
ORCID iDs
Data Availability
All data generated or analyzed during this study are included in this published article and the electronic supplementary material.
Supplemental Material
Supplemental material for this article is available online.
References
Supplementary Material
Please find the following supplemental material available below.
For Open Access articles published under a Creative Commons License, all supplemental material carries the same license as the article it is associated with.
For non-Open Access articles published, all supplemental material carries a non-exclusive license, and permission requests for re-use of supplemental material or any part of supplemental material shall be sent directly to the copyright owner as specified in the copyright notice associated with the article.