
Abstract
We examine the social antecedents of contributing to campaigns, with a particular focus on the role of population density and social networking opportunities. Using 10 years of US campaign contribution data from the Federal Election Commission and a national survey of party leaders, we find that recruiting contributors is easier in a densely populated region, where the daily opportunity of individuals being exposed to the same information via their social networks is high. Furthermore, the effect of population density is heterogeneous with respect to mobility: if a region has substantial commuting outflow, the chance of being mobilized from the place of residence decreases, but the chance of mobilization in their place of work increases. This analysis also reveals differences between political parties. Democrats are more dependent on social networking in population dense areas. This difference in the importance of social networking opportunities present in geographical space helps explain macro-level patterns in party fundraising.
Introduction
This study focuses on the role of population density in influencing per-capita political donations in the US. Given time and travel restrictions, we suspect densely populated areas provide a larger number of socially connected actors from whom to draw donations. These effects, however, are not likely to be homogeneous with respect to mobility and affluence. As epidemiologists have noted, commuting patterns significantly affect density, with areas receiving a large inward flow increasing in density during much of the day and those with large outflows decreasing in density (Dalziel et al., 2013; Charaudeau et al., 2014). Moreover, given that political donations are strongly correlated with affluence (Verba et al., 2004), the density of potential donors is likely to be more determined by the density of affluent persons than total population density. Finally, it has been noted by other scholars that Democratic candidates are particularly reliant on large population areas (i.e., cities) for both votes and mobilization (Bartels 2006; Gimpel et al., 2006). Because of this, we suspect Democrats will be more reliant on mobilization within population- and affluence-dense areas than Republicans.
We test these hypotheses using two data sources. First, we geolocated 10 years of US campaign contribution data from the Federal Election Commission (FEC) and combined it with data from the US Census to analyze the relationship between population density and per-capita donations. Second, we use a new national survey of party leaders to analyze whether those in population dense areas are more likely to report that personal contacts and civil society organizations are important for recruiting donors. In both datasets, we also test whether these effects are stronger for the Democratic Party than for the Republican Party.
Previous research has focused on the geographical distribution of contributions. Tam Cho (2003) finds evidence of contagion of contribution behavior among Asian Americans. Gimpel et al., (2006) find evidence of spatial correlation among adjacent zip codes, consistent with the spread of behavior along social networks. Tam Cho and Gimpel (2007) find, in a study of campaign fundraising in Texas, that contributing is spatially dependent, suggesting the possibility of diffusion via spatially dependent social networks. None of these studies, however, take into account the effect of mobility (commuting), which can dramatically change daytime populations in urban areas, nor do they attempt to test the behaviors that underlie the geographic structure from the viewpoint of the actual fundraisers.
Geography of political networks and money
Modern political campaigns have a great deal of flexibility in where they raise money, with more than two-thirds of individual donations originating from outside the district to which they are directed (Gimpel et al., 2008). How might population density affect where fundraising takes place? The answer depends on what mobilizes individuals to contribute to a campaign. If political contributions primarily reflect underlying individual political preferences and capacities, then it is not obvious why population density should be associated with contribution patterns (controlling for factors like income). However, if contribution behavior is social, population density might be quite important.
Francia et al., (2003: 43) and Gimpel et al., (2006: 627) identify three reasons why the decision to donate may be interdependent, which they label “material,” “purposive,” and “solidary.” Material explanations for spatial clustering suggest that individuals in geographic proximity are more likely to hold common interests in government policy. Purposive donations—based on ideology—are shaped by interactions with family, co-workers, and others in an individual’s social network. Finally, solidary motives are linked to people’s desire to improve their social ties or standing through their behavior (Brady et al., 1999; Francia et al., 2003). This can include a friendship with the candidate and/or a candidate’s supporter, participation in social events and fundraisers, or gaining special recognition as a contributor.
How are these individual incentives related to population density? First, from the material perspective, it has long been noted that economic activity scales non-linearly with population density (e.g., Bettencourt et al., 2007), and that particular economic interests tend to cluster (e.g., Silicon Valley) (Malmberg and Maskell, 2002). This provides opportunities for fundraisers to find individuals with common interests. As Francia et al., (2003: 44) note, business executives may contribute due to real or perceived pressure from associates with whom they work. Second, Gimpel et al., (2006: 627) suggest that individuals are more likely to believe a candidate is good if someone they trust lends their endorsement. Previous studies have found that individuals tend to give because someone they know and trust asked them to do so (Francia et al., 2003: 45). These regular contacts and reciprocity that underlie interpersonal trust “are easier to organize in the context of physical proximity” (Morgan, 2004: 8). Third, workplace ties are likely to play an especially important role in purposive and solidary giving. These networks are typified by high trust, regular exchanges of information (high bandwidth) (Aral and Van Alstyne, 2011), and large numbers of “weak” ties—because such ties are not completely self-selected—that can transfer novel information (Granovetter, 1973; Mutz, 2006: 29). The importance of these workplace ties in urban communities can be directly observed in the FEC data, with the clustering of large campaign donations in time within particular organizations, suggesting coordinated action. 1 Fourth, organized political activity and interest organization is strongly associated with urbanization (Glaeser, 1994; Knudson and Clark, 2013). Such social and political organizations are fertile ground for large coordinated donations. Finally, political parties are not passive actors. Even if individual social networks were exactly the same in both rural and urban environments, potential networking contacts and the number of networks within a particular area will be greater in an urban environment. Economists have long recognized this role of density in the spread of ideas and information (Glaeser, 1994). Thus, when organizing a fundraiser and attempting to maximize attendance of potential donors, political parties should favor urban environments. We note such a pattern in Section 5 of the supplementary material (SM).
Thus, we anticipate that, controlling for income factors, more money will be raised in densely populated regions. Further, we anticipate that regions with a denser population of the affluent will be especially likely to contribute to campaigns, as the social networks in these regions will be populated by people with the means to contribute substantial amounts.
Population density, however, varies dramatically by time of day and week. In some areas, population density increases during the work day, and, in others, it decreases. Residential population density understates the density of the former and overstates the density of the latter. In epidemiology, for example, commuting increases disease spread in areas with an incoming commuter population beyond what would be expected based on residential population density (Dalziel et al., 2013; Charaudeau et al., 2014). We therefore anticipate that areas with incoming commuters will have higher levels of contributions.
Finally, we expect the importance of population density (and work and social activities) to be greater for fundraising efforts by the Democratic Party than by the Republican Party. This is partially because of the early adoption of direct mailing for fundraising by the Republican Party (see e.g., Gimpel et al., 2006), which allow candidates to reach donors in areas with lower population density. Democrats also generally rely on labor groups and organized interests which tend to be located in population dense, commuter attracting areas. (Bartels, 2006). Finally, Republican contributors may be more motivated by individual characteristics (ideology, wealth, and interests) than by network affiliations (Gimpel et al., 2006). This produces hypotheses both on the aggregate and party leader level.
Method
The FEC data
Federal campaign finance disclosure laws require recipients to report any contribution over $200 to the FEC. The FEC releases this information to the public in the form of a large database dump. Curated versions of the data sets from 1990 to the present are available from transparencydata.com (a collaboration among The Center for Responsive Politics, Sunlight Foundation and the National Institute on Money and State Politics).
The raw FEC data consist of contribution event records—each record corresponding to a single monetary contribution to one political candidate or committee. Each record specifies the name, address, and occupation of the contributor, the date of the contribution, the name and party affiliation of the recipient, the seat for which the recipient was running, and the outcome of the election. We process this large data to the county-level, which is the lowest level on which some of our variables of interest (e.g., affluence and commuter flows) are observed.
Variables of interest
Dependent variable
Campaign contribution is operationalized as the amount of contribution per person in the county (contributions per capita). The amount is the accumulated contribution of the election cycles 2000, 2002, 2004, 2006, 2008, and 2010, covering years 1999 to 2010.
Independent variables
We use the following independent variables in our analysis:
Population density—the number of people per square mile within the county.
Average income—the average income for earning population in each county.
R voteshare—percentage presidential Republican voteshare in the county.
Affluence density—number of people earning $100,000 or more, per square mile.
Proportion affluent—proportion of earning population with earnings of $100,000 or more.
Inflow—incoming commuters as a proportion of total working residents in county. 2
Outflow—outgoing commuters as a proportion of total working residents in county.
Because of their skewed distribution, the variable for contributions per capita, average income, population density, and affluence were log transformed. Correlations between some independent variables can be relatively high, so we will present several different combinations of the independent variables in our models (summary and maps in SM). 3
Models
Several studies have demonstrated that political contributions are geographically correlated (Tam Cho 2003; Gimpel et al., 2006; Tam Cho and Gimpel 2007; see Table A2 in SM). This means that, similar to serial autocorrelation in timeseries data, the errors in our model are unlikely to be independent and identically distributed. Two major regression techniques have been used to incorporate spatial information in a model, namely, spatial lag and spatial error models (Anselin, 2013). Theoretically, a spatial lag model suggests a particular diffusion process in the dependent variable. In this study, we are less interested in modeling the pattern of diffusion than in estimating the effect of our main independent variables, accounting for the expected geographic dependence. Thus, we have chosen a spatial error model (SEM) to address the spatial pattern, including potentially unobserved variables or spatial heterogeneity that are difficult to quantify. For large-scale data, the SEM can be difficult to compute, so we utilize LeSage and Pace’s (2007) matrix exponential spatial specification (MESS) to do the computation (see SM for details).
Geographic results
Table 1 looks at three models for both political parties. Model 1 shows a positive and significant effect of population density on contributions per-capita (p < 0.001). We find that a 1% increase in population density results in a 0.1% increase in per-capita contributions. We also find a statistically significant relationship with the proportion of the population considered affluent and average income (p < 0.001). A 1% increase in the proportion of the population that is associated with a 19.7% increase in contributions per-capita. For average income, we find that a 1% increase results in a 0.95% increase in contributions per-capita. In sum, we find some support for
Model comparisons at county level (N = 2,986) for both political parties.
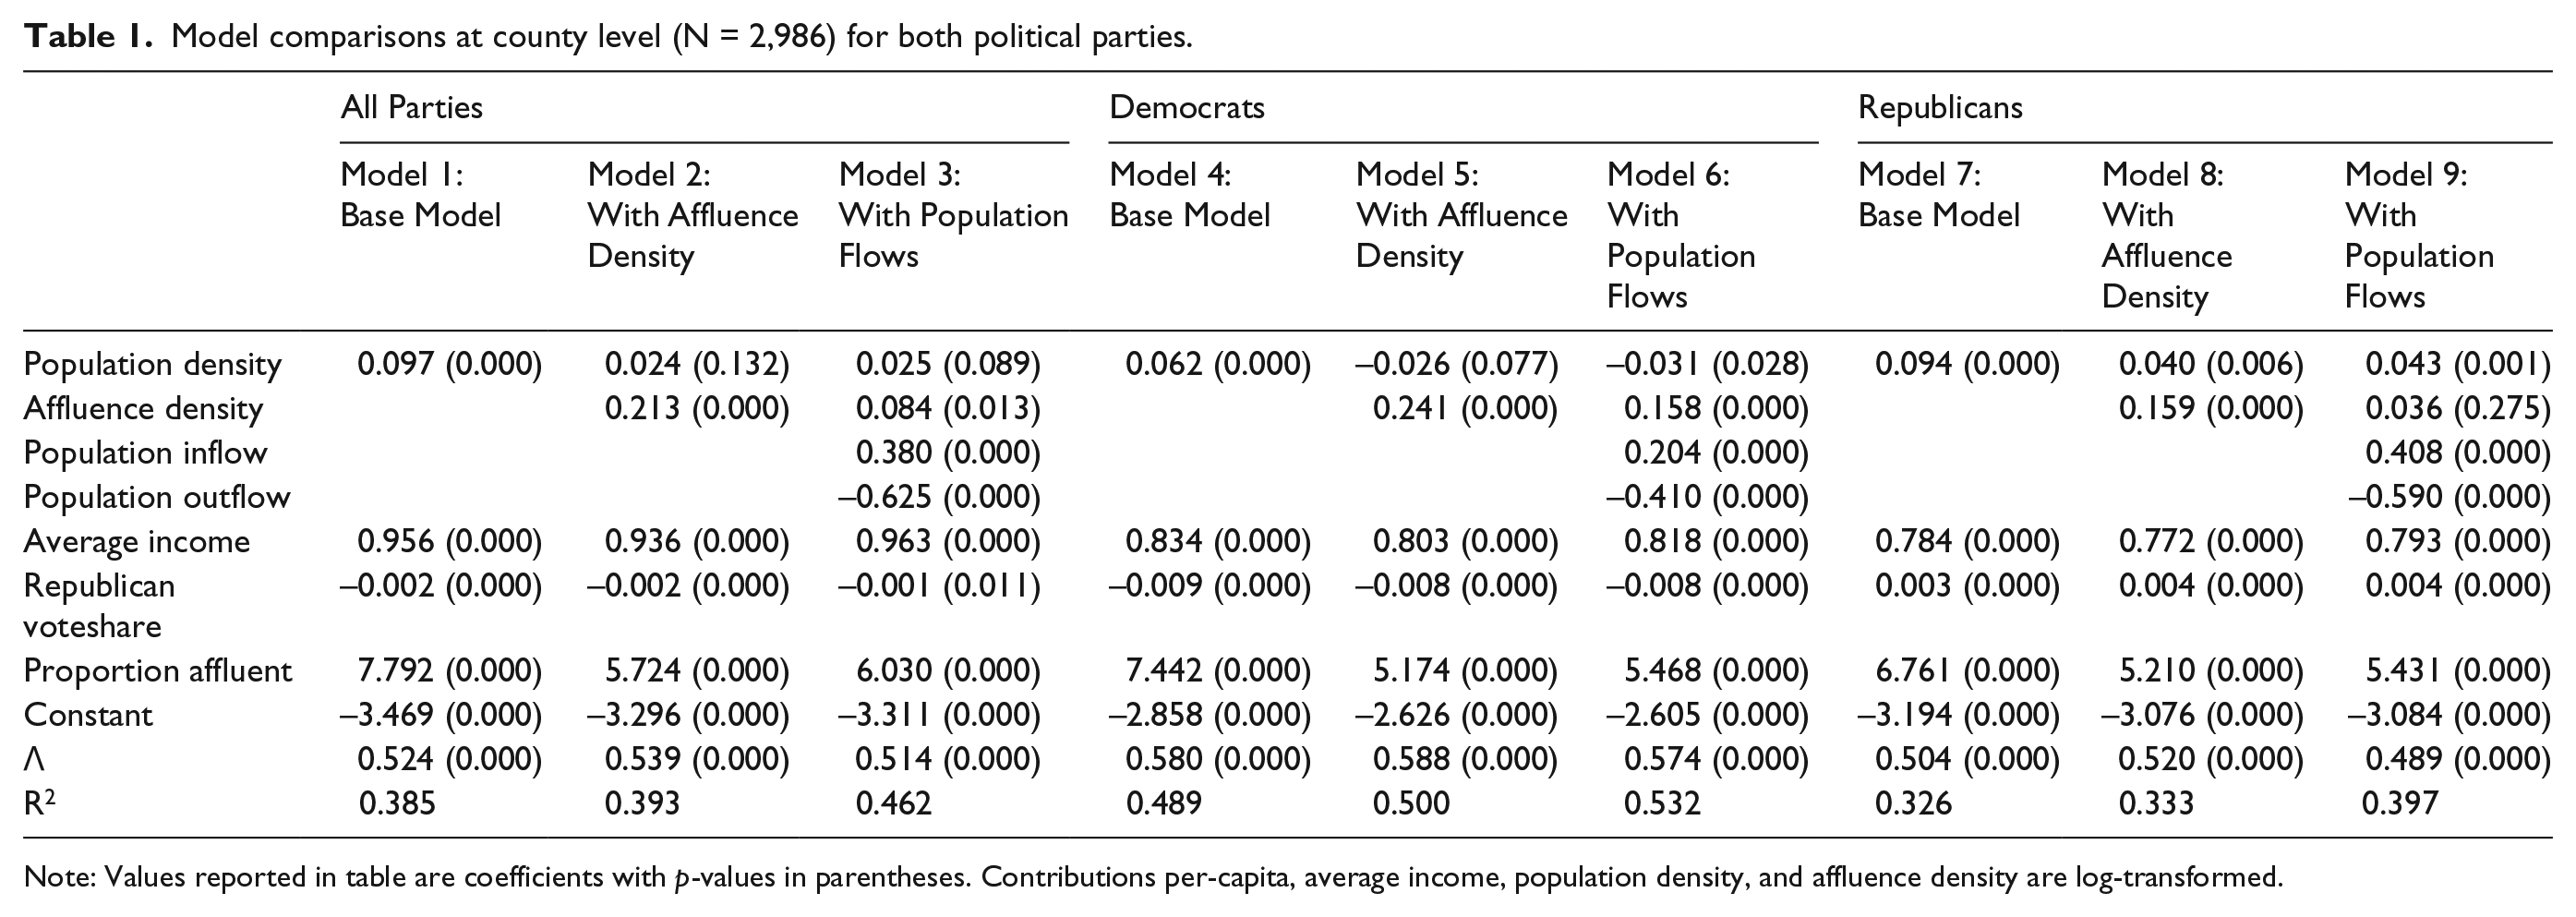
Note: Values reported in table are coefficients with p-values in parentheses. Contributions per-capita, average income, population density, and affluence density are log-transformed.
Model 2 in Table 1 adds the density of affluent individuals in the county. Density of affluence has a statistically significant relationship with contributions (p < 0.001) and the coefficient indicates that a 1% increase in affluence density increases contributions per capita by about 0.2%. This provides strong evidence for
Finally, Model 3 in Table 1 adds the population inflows and outflows due to commuting. Both have a significant impact on campaign contributions (p < 0.001) in the expected direction. For a 10% increase in commuting inflows per capita, contributions increase by 0.91%. Conversely, a 1% increase in commuting outflows results in a 1.55% decrease in political contributions. This provides strong support for
In Models 4 through 9 of Table 1, we run the same models, separated by political party. The results support the contention that Democrats are more dependent on these social networks than Republicans (Gimpel et al., 2006). While density remains important for both parties, these variables do a much better job of explaining contributions to the Democratic Party (R2 = 0.532) than for the Republican Party (R2 = 0.397), supporting
Behavior of Party Leaders
To further explore the role of network connections in campaign contributions, we inserted a question into the 2013 National Survey of Party Leaders (see e.g., Broockman et al., 2014). Details of the survey are available in the SM.
In the survey, we asked respondents—“Thinking about
Figure 1 reports the relationship between population density and wealth density within the county in which the party leader operates, and their propensity to select an option. In this figure, the bars show the magnitude of the regression coefficients with the range spikes indicating 95% confidence intervals. Consistent with the social network explanation of why population density matters for per capita campaign contributions, the left-hand graph shows that party leaders in population dense areas are more likely to report that having a friend or colleagues who donates is one of the most important factors in recruiting new donors (b = 0.082, p < 0.01). Conversely, party leaders in less population dense areas rely more on whether the person has donated to other charities (b = −0.133, p < 0.001). Similarly, the right-hand graph demonstrates that in more wealth dense areas, party leaders report that social networks, knowing a friend or colleague who donates, are of primary importance (b = 0.115, p < 0.01). They are also more likely to report that membership in a labor or business organization is important (b = 0.011, p < 0.05). Those leaders in less wealth dense counties are more likely to report that donations to other charities is important (b = −0.183, p < 0.001).

Impact of population and wealth density on most important characteristics for first-time donors according to party leaders.
Figure 2 shows the percentage of respondents who identify each option as important, broken down by political parties. The first graph shows the responses from leaders of both political parties. Clearly, social networks play a significant role in finding donors. Well over half (56.9%) included having a friend or colleague who also donates as a major factor. The second most popular response (43.3%) was that the potential donor was a member of a social club or advocacy group with ties to the party. Finally, about the same percentage of respondents (41.6%) said that the potential donor being well off, being a member of a labor or business group affiliated with the party, or making donations to other charities were among the most important attributes.

Most important characteristics for first-time donors according to party leaders by party.
Consistent with the results in the aggregate, the survey also revealed significant differences between Democratic and Republican party leaders. Democratic leaders were more likely to report that having a friend or colleague who donates is important (58.9% versus 54.1%), but this difference was not statistically significant (p = 0.333). More pronounced were the differences in reporting that membership in a social or advocacy group affiliated with the party was important. Among Democrats about 50% of respondents said that membership was important, versus only 34.1% of Republicans (p < 0.001). Similarly, 56.8% of Democratic respondents said that membership in a labor or business organization with ties to the party was important, while only 20.6% of Republican respondents gave a similar indication (p < 0.001). Republicans, on the other hand, were more likely to report that membership in other professional groups (35.9% versus 26.9%, p = 0.057), donation to other charities (47.6% versus 37.2%, p = 0.036), and being personally well off (46.4% versus 38%, p = 0.091) were important.
In sum, the survey of party leaders suggests that the results from the aggregate data are not artifacts and that the social network mechanism we posit is correct. Party leaders generally recognize the importance of social networks, but these social networks are more important for leaders in population and wealth dense areas. Further, Democratic Party leaders report being more dependent on these networks than their Republican counterparts for recruiting first-time donors.
Conclusions
Using ten-year aggregated FEC data, we confirm that the significant amount of contribution money per capita can be well explained by three driving factors in geographical politics: income distribution, population density, and working commutes. A survey of party leaders confirmed the proposed mechanisms for this relationship—the social networking opportunities for recruiting donors.
We also noted a substantial difference between the Democratic and Republican parties in terms of the importance of social networking opportunities in a given area. The inclusion of population and affluence density makes a much larger difference in models of donations for Democrats than Republicans, suggesting that the Democrats are much more dependent on these networking opportunities than Republicans. This is confirmed when we look at the experiences of county-level party leaders. While both parties report that social network factors are among the most important factors in first-time donation, Democrats are significantly more likely to identify membership in labor, business, social, and advocacy organizations with ties to the party as one of the most important factors in first-time donation. They are also more likely to report that having a friend or colleague who donates is among the most important.
Footnotes
Declaration of conflicting interest
The author(s) declared no potential conflicts of interest with respect to the research, authorship, and/or publication of this article.
Funding
This research was supported by NSF grant number 1637067. Any opinion, findings, and conclusions or recommendations expressed in this material do not necessarily reflect the views of the funding sources.
Supplementary materials
The supplementary files are available at http://journals.sagepub.com/doi/suppl/ DOI: 10.1177/2053168017742015. The replication files are available at ![]() .
.
Notes
Carnegie Corporation of New York Grant
This publication was made possible (in part) by a grant from Carnegie Corporation of New York. The statements made and views expressed are solely the responsibility of the author.
References
Supplementary Material
Please find the following supplemental material available below.
For Open Access articles published under a Creative Commons License, all supplemental material carries the same license as the article it is associated with.
For non-Open Access articles published, all supplemental material carries a non-exclusive license, and permission requests for re-use of supplemental material or any part of supplemental material shall be sent directly to the copyright owner as specified in the copyright notice associated with the article.