
Abstract
Background
Left ventricular ejection fraction (LVEF) is generally measured by echocardiography but is increasingly available with myocardial perfusion scintigraphy. With myocardial perfusion scintigraphy, the threshold of LVEF below which there is a risk for myocardial infarct or sudden cardiac death is higher for women (51%) than for men (43%). We tested the hypothesis that such a sex difference may also occur with echocardiography and myocardial perfusion scintigraphy.
Methods
Four hundred and four men, mean age = 67.7 ± SD = 12.3 yr; 339 women, 67.7 ± 11.7 yr had separate myocardial perfusion scintigraphy and echocardiography examinations within six months. A subset of 327 of these patients (181 men, 68.8 ± 12.1 yr; 146 women, 66.4 ± 12.1 yr) had examinations within one month and were additionally analysed as this sub-group. Myocardial perfusion scintigraphy and echocardiography were used to measure LVEF at rest and their agreement (neither considered as a reference method) was assessed by Bland–Altman plots: LVEF difference (myocardial perfusion scintigraphy minus echocardiography ) against average LVEF (
Results
Of patients who had myocardial perfusion scintigraphy and echocardiography performed within six months, mean LVEF difference = +1.1% (95% limits of agreement: −19.3 to +21.6) in men but +10.9% (−10.7 to +32.5) in women. LVEF difference diverged from zero marginally in men (mean difference = +1.1, 95%CI = +0.1 to +2.1, p = 0.028) but more in women (+10.9, +9.8 to +12.1, p < 0.001). The LVEF difference correlated with average LVEF itself in both men (r = 0.305, p < 0.001) and women (r = 0.361, p < 0.001), and with age in women (r = 0.117, p = 0.031). Similar results were observed for the subset.
Conclusions
Caution should be taken when interpreting LVEF measured by different techniques due to their wide limits of agreement and systematic bias, more markedly in women.
Introduction
Left ventricular ejection fraction (LVEF) is routinely used in clinical practice for diagnostic, prognostic and therapeutic procedures to measure left ventricular function1–4 and is useful to evaluate responses to treatment in clinical trials. 5 Several non-invasive methods are used to estimate LVEF and because of its low cost, availability and operational ease, echocardiography (Echo) is the most common. However, LVEF estimates are increasingly provided by other methods such as myocardial perfusion scintigraphy (MPS), computed tomography and cardiovascular magnetic resonance.4,6,7
When LVEF is reported as an outcome measure, it is important to know which technique is used as data may not be interchangeable between methods, as each will have various measurement errors and intrinsic biases. To estimate the comparability of data between methods, an approach is to measure LVEF in the same subject by the two methods. This has been done when comparing values using two techniques such as Echo and MPS8–13; or when comparing either method with a more invasive procedure such as ventriculography.9,13,14 Comparability is generally gauged by calculating the significance of a correlation coefficient when data pairs are plotted as a function of each other.
However, such a correlation analysis ignores any systematic bias between the two methods: evident when a linear regression of data pairs does not have a slope of unity or the plot fails to approach the origin. An alternative approach is a Bland–Altman analysis whereby the difference in values by the two methods is presented against the average of these values. 15 This detects any relative bias as well as emphasises the range of differences in each data pair that a regression plot displays less clearly. 16 A few such analyses have compared different methods to estimate LVEF8,12,14 and in these both bias and a large variation of differences within data pairs were evident, which suggested interchange of data between different methods was not justified. However, several confounders may contribute to this negative conclusion that includes: the small number of patients in most individual studies, as well as either a preponderance of males or lack of information about the gender mix. The latter may be of significance as measurements of LVEF by MPS show that a threshold value below which the risk for myocardial infarct (MI) or sudden cardiac death increases is different for women (51%) and men (43%). 17 By contrast, there was no evidence of sex-dependent differences if LVEF by echo was used as a prognostic indicator for severe cardiac events.18,19 This study tested the hypothesis, using a large data-set of patients, that interchangeability of LVEF as measured by Echo and MPS is different in men and women.
Methods
Patients, setting and study design
Patients were referred for assessment of cardiac symptoms, including chest pain and dyspnoea, and for those undergoing cardiovascular surgery. 4 A total of 1141 patients had LVEF measured both by resting MPS and by Echo. Of these, 743 patients (Group 1: 404 men and 339 women) had separate examinations within six months and their data were used for analysis. A subset of these patients (Group 1A: n = 327; 181 men and 246 women) had examinations within one month and were additionally analysed (Figure 1). All examinations were performed at a single centre between 30 November 2012 and 30 May 2017.

Numbers of patients who had MPS and Echo examinations within six months (n = 743) and within one month (n = 327) apart.
Anthropometric data and history of cardiopulmonary conditions
Data recorded at the time of LVEF measurements were collected including: weight and height for body mass index (BMI) calculation; history of cardiopulmonary conditions including MI; congestive heart failure (CHF); atrial fibrillation (AF); hypertension; cardiac interventions including coronary artery bypass graft (CABG) and percutaneous coronary intervention (PCI); chronic obstructive pulmonary disease (COPD); and cardiac medications including beta-blockers.
Myocardial perfusion scintigraphy
Data from rest MPS investigations, performed with the injection of 99mTc-tetrofosmin (600–1000 MBq), were used. Images were obtained using dual-head SPECT cameras (Siemens Symbia S, Erlangen, Germany) 4 and LVEF was determined from gated images as previously described. 20
Echocardiography
Rest Echo data were obtained with a high-end two-dimensional echocardiographic unit (Sonos 5500, Andover, MA, US or Vingmed System V, Horten, Norway). Images were acquired with standard parasternal, short-axis and apical views and LVEF was calculated by the modified Simpson’s biplane disks method. 21 Analysis of images was performed by a cardiologist independent from the radiologist who evaluated the MPS measurements.
Statistical methods
Linear regression was used to assess the correlation between LVEF, measured either by MPS or Echo, by generating a regression coefficient (r). Bland–Altman analysis was performed by plotting and regressing LVEF difference (MPS minus Echo) against average LVEF (
Results
For Group 1 patients (n = 743, 45.6% women), mean age (67.7 years) was the same in men and women (Table 1). Echo was performed before MPS in more patients (n = 508) than the alternative (n = 235), but conclusions were similar if the two subsets were analysed separately, therefore data for the entire patient set are presented. For Group 1A patients assessed within one month apart (rapid subset) by both methods, age was also similar between genders (n = 327, 44.6% women) and Echo was performed before MPS in 191 and after in 136 patients.
Subject characteristics of patients who underwent cardiac assessment by MPS and Echo within six months apart (n = 743) or within one month apart (n = 327).

Note: Bold characters indicate significant differences between groups.
Table 2 shows the distribution of co-morbidities among men and women with obesity, AF and hypertension, MI, CHF, cardiac intervention, COPD and treatment with beta-blockers. Table 3 shows that the LVEF difference between MPS and Echo measured within six months apart was lower in men with MI, CHF, AF, and treatment with beta-blockers compared to men without these conditions, and higher in women of older age and lower in women with CHF compared with younger women or women without CHF, respectively. A similar pattern was observed for LVEF difference measured by the two techniques one month apart.
Proportions of men and women with different underlying co-morbidities and treatment.

Comparison of LVEF difference (MPS minus Echo) between patients with a condition against those without using independent t-test.

Significant relationships (all p < 0.001) were found between LVEF measured by Echo and MPS in men and women (Figure 2): for men r = 0.627 and r = 0.644, Group 1 and Group 1A respectively; for women r = 0.530 and r = 0.527, Group 1 and Group 1A, respectively. However, the slopes of the relationship were less than unity in all cases, and the intercept was significantly different from zero (Figure 2(a) to (d)). Moreover, mean values of LVEF were significantly greater by MPS compared to Echo in both men (p = 0.028) and women (p < 0.001). For men, the mean difference (MPS-Echo) was 1.1% or 1.3% for Groups 1 and 1A data. However, for women, the mean difference was much higher; 10.9 and 11.3%, respectively.
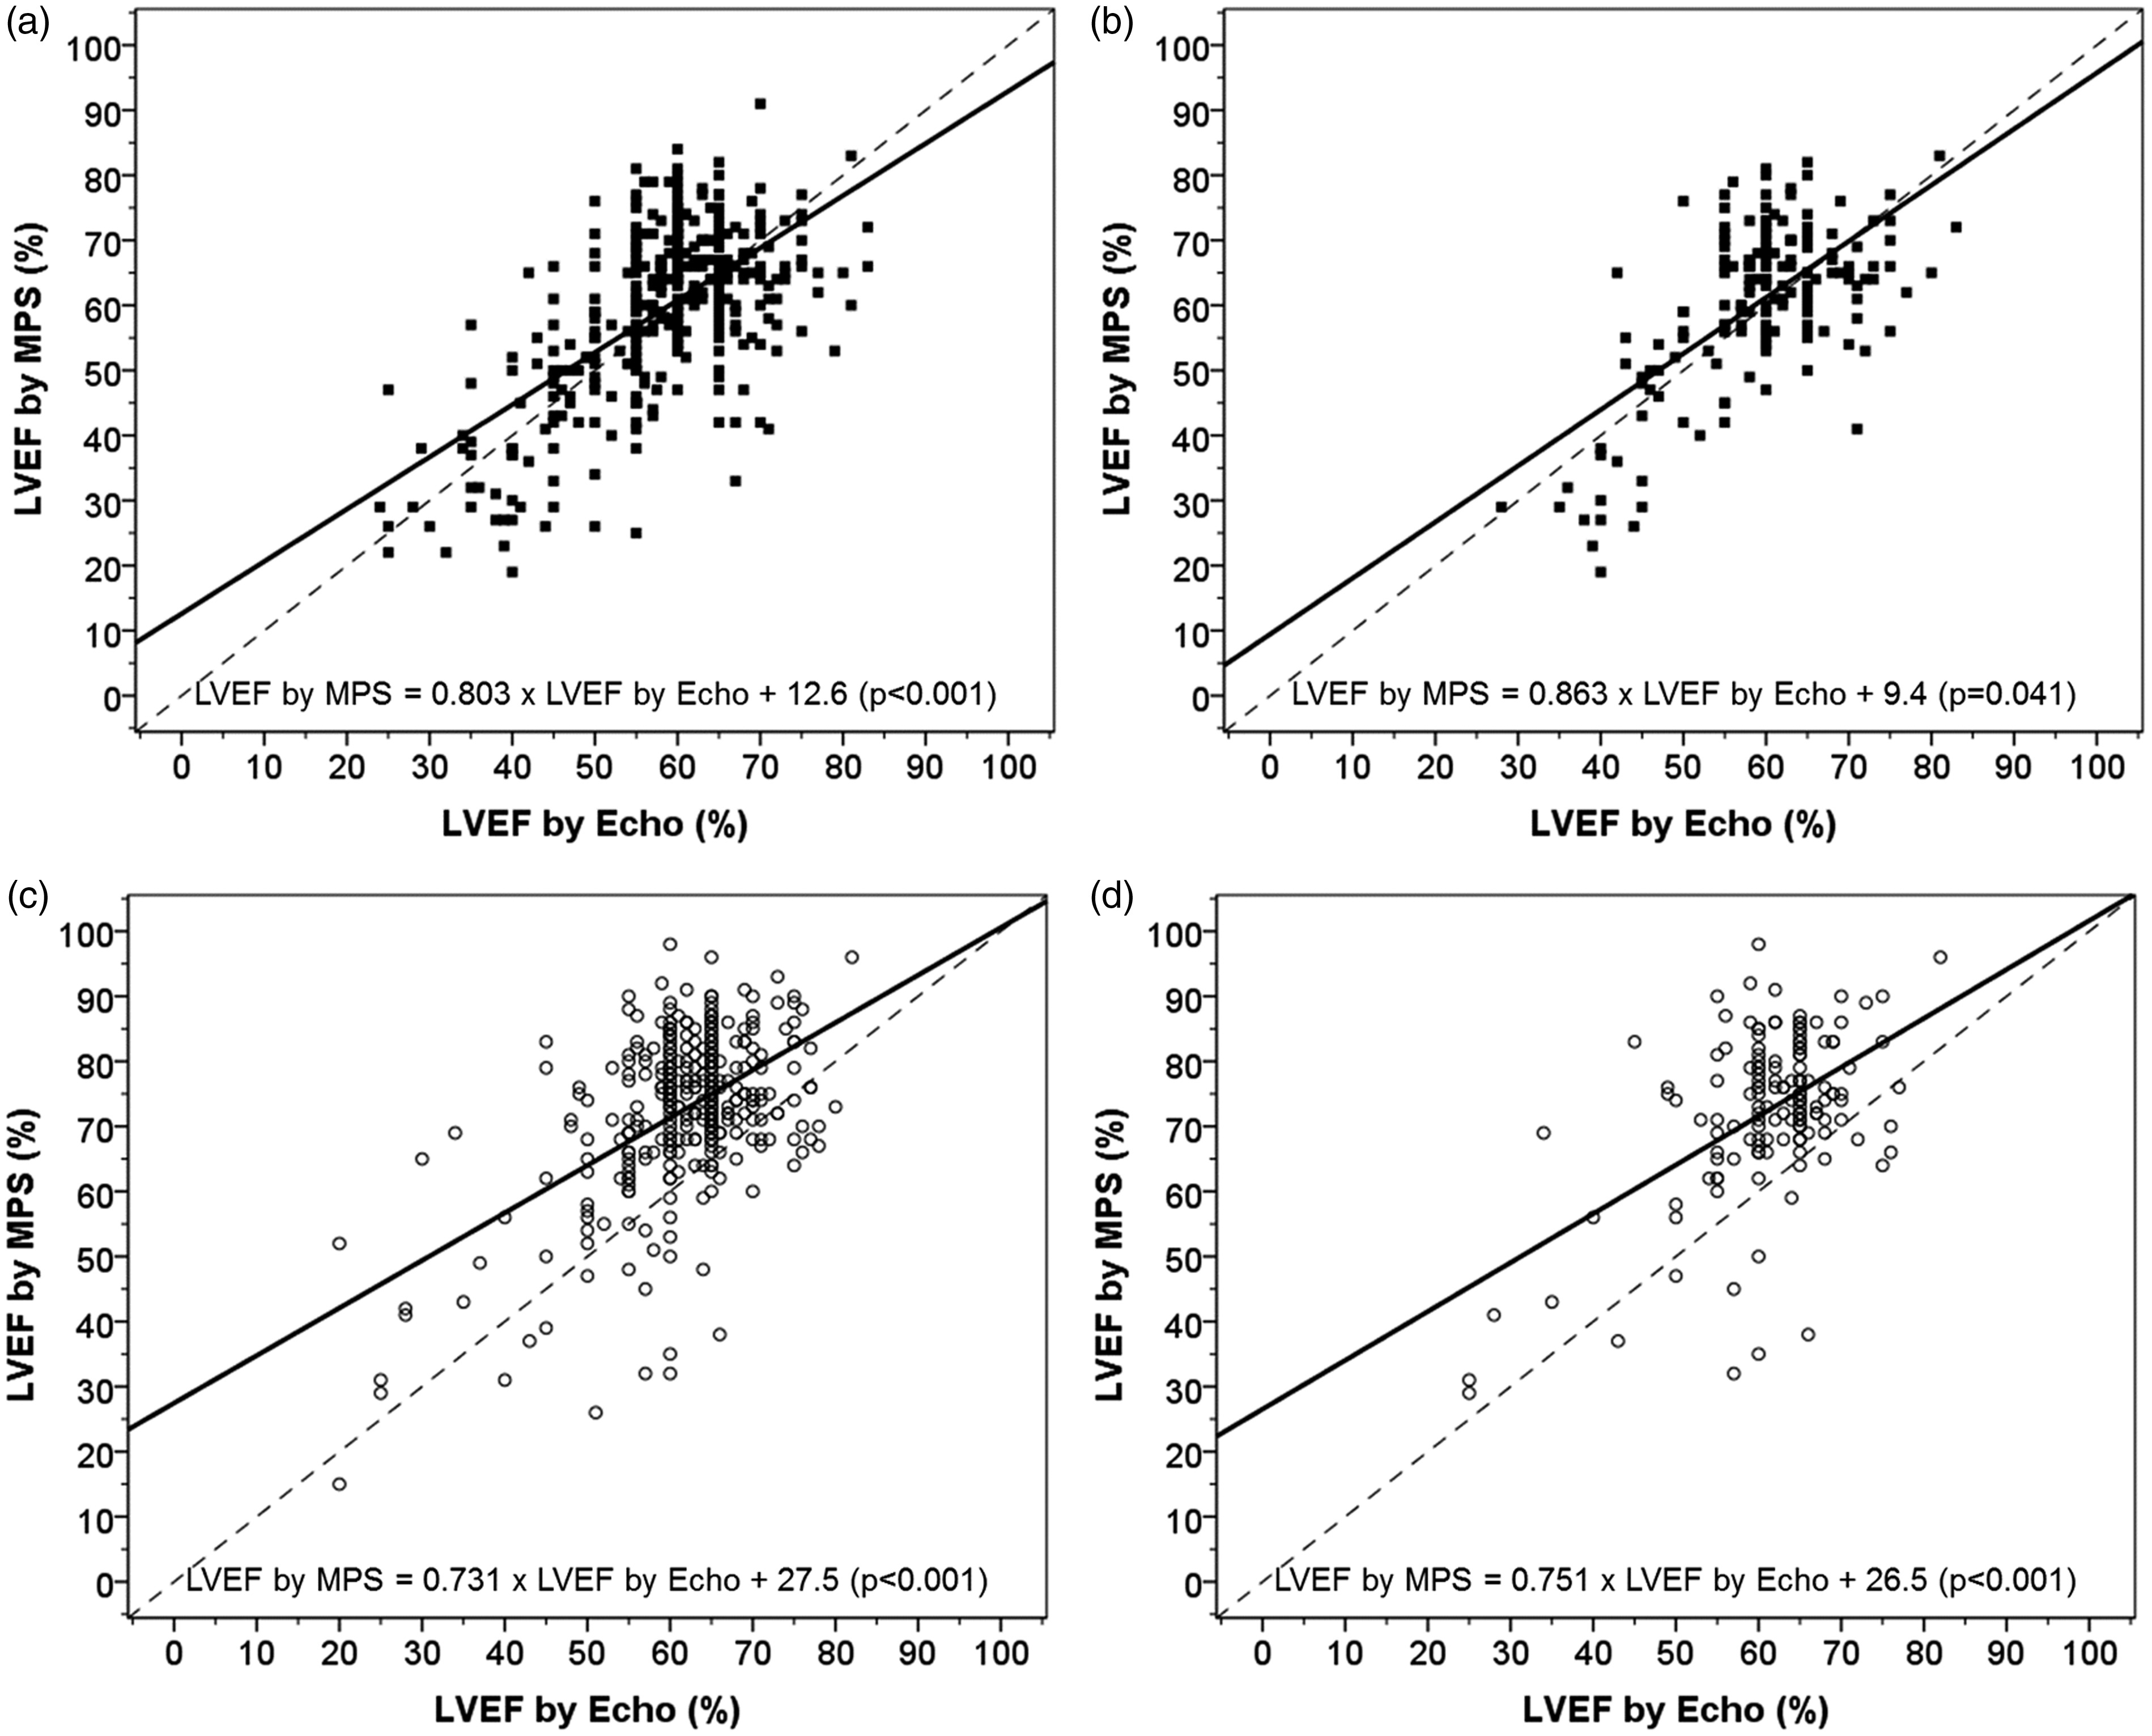
Scatter plot for the relationship between LVEF measured by MPS and by Echo measured within six months (a) and within one month apart (b) in men and within six months (c) and within one month apart (d) in women. Solid line indicates regression line of best fit and dashed line indicates line of unity. Intercepts were significantly different from origin (indicated in brackets).
Bland–Altman analysis was conducted showing that among those who had MPS and Echo performed up to six months apart, the overall bias was +1.1% (−19.3 to +21.6) in men (Figure 3(a)) and +10.9% (−10.7 to +32.5) in women (Figure 3(b)). Difference in LVEF correlated with average LVEF in men (r = 0.361, p < 0.001) and women (r = 0.392, p < 0.001) but not with age. A one-sample t-test showed LVEF difference diverged from zero only marginally in men (mean difference = +1.1, 95%CI = +0.1 to +2.1, p = 0.028) but more in women (+10.9, +9.8 to +12.1, p < 0.001).

Bland and Altman plot between LVEF difference against mean LVEF to assess bias and agreement between LVEF measured by MPS and Echo within six months apart (a: men and b: women) or within one month apart (c: men and d: women). Solid line indicates the mean of overall bias between methods (MPS minus Echo) dashed lines indicate 95% limits of agreement.
The overall bias (mean LVEF difference) was +1.3% (95% limits of agreement: −18.1 to +20.7) in men (Figure 3(c)) and +11.3% (−10.6 to +33.2) in women (Figure 3(d)). LVEF difference correlated with average LVEF in men (r = 0.305, p < 0.001) and women (r = 0.361, p < 0.001), and with age in women only (r = 0.117, p = 0.031). LVEF difference diverged from zero only marginally in men (mean difference = +1.0, 95%CI = +0.2 to +1.9, p = 0.015) but more markedly in women (mean difference = +11.1, 95%CI = +10.2 to +12.0, p < 0.001).
Linear stepwise multiple regression analysis was conducted to regress LVEF differences (dependent variable) on average LVEF, sex, age and co-morbidities (independent variables). All independent variables were entered simultaneously in the regression model using a forward selection method: only average LVEF, sex and age were retained as significant independent variables in the final model, while co-morbidities including obesity, AF, MI, CHF, cardiac intervention, COPD, hypertension and beta-blocker treatment were eliminated. For group 1: mean difference (MPS-Echo) = 0.398 × Average LVEF – 6.0 × sex (0 for women, 1 for men) + 0.122 × Age – 24.3 (coefficient of determination (r2) = 28%, p < 0.001); for group 1A: mean difference (MPS-Echo) = 0.449 × Average LVEF – 6.2 × sex (0 for women, 1 for men) + 0.135 × Age – 28.3 (r2 = 31%, p < 0.001).
Discussion
Summary
The present study found a marked systematic bias in LVEF measured by MPS and Echo in women compared to that in men, with wide limits of agreement between these two techniques. These results suggest that LVEF measured by different methods may not be used interchangeably in either clinical or research settings. In particular, our observations of sex differences in LVEF estimated by Echo and especially by MPS and have not been previously reported. These findings are highly valuable when interpreting results by different methods and would have profound implications on diagnosis, prognostication of cardiac outcomes and therapy. These sex differences may also explain the observation of sex differences in LVEF as prognostic indicators of myocardial infarction and cardiac death. 17
There are a number of published papers assessing relationships between LVEF measured by MPS and Echo using a linear regression technique to provide correlation coefficients,8,9,11,12,22 However, only a few of these studies assessed agreement between methods using Bland–Altman technique.8,12 Scatter plots of LVEF measured by MPS or by Echo in our study confirm the deficiency of a correlation approach; the linear regression line deviated from origin indicating the presence of a bias. Furthermore, most previous studies recruited small numbers of participants (between 30 and 80) with unknown sex balance or preponderantly men. Our analyses of 743 participants divided approximately equally between men and women are, to our knowledge, the largest of its kind, providing a greater level of confidence in our findings. Findings from our study suggest that while a good correlation exists between LVEF measured by MPS or Echo, there is a significant bias engendered by one method compared to the other, especially when measurements were made on women.
Both MPS and Echo are techniques used in clinical setting and neither is considered as a ‘reference method’. Therefore, it is not certain if one method overestimates or the other underestimates the ‘true’ LVEF value. The observation of correlations between LVEF differences and average LVEF suggests a relatively lower value by Echo in patients with lower LVEF and relatively higher value by MPS in patients with higher LVEF. Joffe et al. 14 examined LVEF measured by Echo and ventriculography in 741 men and women. Both sexes were analysed together and it was found that the 95% limits of agreement (+20% and −20%) of LVEF measured by Echo and ventriculography were in a similar range as those found in our study. We found that sex differences between MPS and Echo to be remarkably similar to differences in LVEF thresholds performed by MPS in the prediction of myocardial infarct and cardiac mortality. 17
Stepwise regression analysis revealed that LVEF values measured by MPS were increasingly higher than those by Echo in those with higher LVEF measurements or older age and these values were lower in men than in women, while obesity, MI, AF, CHF, COPD, hypertension and beta-blockers were not related to trends in bias. It would be of interest to examine the agreement of these two methods in patients with abnormal ejection fraction, but there were not enough numbers in the present study with such a group of patients.
Our data however cannot completely explain sex differences between method agreement on LVEF measurement but men with MI, CHF, AF and medications such as beta-blockers and women of older age and CHF had significant influences on LVEF difference between MPS and Echo. It is therefore important to recalibrate either or both MPS and Echo and take underlying co-morbidities into account to provide consistency between methods, but this would require the use of a standard method for cross-reference for these two techniques. A potential bias not examined in our study is that the acoustic window for Echo in women can be suboptimal. Women also generally have a relatively larger amount of subcutaneous adipose tissue for a given BMI than men 23 which may have some bearing on Echo measurement. Because of its low cost and operational ease, Echo is widely used for assessing LVEF. However, this method has a number of drawbacks because it is operator-dependent and relies on geometric assumptions such that the measurements can be erroneous in patients with ventricular defects including those with dilated, remodelled ventricles.24,25 MPS, which is increasingly used for cardiac stratification, also computes LVEF. MPS also suffers limitations, including high cost, involving radiation exposure (especially for patients undergoing repeat testing), 26 requirement of highly trained specialists and its unreliability in the presence of arrhythmias or tachycardia.9,24
Strengths and limitations of the study
The strengths of the present study lie in its large numbers of subjects. Together with the use of Bland–Altman analysis, we are confident that our findings are robust. The present study examined a wide range of measurements that may have some bearing on outcomes of the results such as BMI, drug therapy and co-morbidities. Ideally, the two methods should be done within a short time of each other because any differences could be due to changes of cardiac function. Joffe et al. 14 found that an interval of up to seven days, between LVEF measured by Echo and by left ventriculography made little contribution to variation in test results. This study analysed MPS and Echo data when measured within six months apart and found very similar data when measured only one month apart, suggesting no significant population deterioration over this time-frame.
Conclusions
Caution should be taken when interpreting LVEF measured by MPS and Echo, especially in women, due to their wide limits of agreement and systematic bias.
Footnotes
Acknowledgements
We would like to thank patients who underwent cardiac investigations and treatment in the present study and colleagues from Department of Cardiology, Ashford & St Peter’s NHS Foundation Trust.
Contributorship
TSH wrote the first draft and analysed the data. CHF and TSH edited the manuscript. SJ, AB, AB, KM, OT collected additional data. AJ, DF, VP, MMcG, DF and PS commented on the paper. All authors read and approved the final version of the manuscript.
Declaration of conflicting interests
The author(s) declared no potential conflicts of interest with respect to the research, authorship, and/or publication of this article.
Ethical approval
All procedures performed in studies involving human participants were in accordance with the ethical standards of the institutional and/or national research committee and with the 1964 Helsinki declaration and its later amendments or comparable ethical standards.
Funding
The author(s) received no financial support for the research, authorship, and/or publication of this article.
Guarantor
TSH.
Provenance
Invited contribution.