
Abstract
Background:
Fat distribution plays an important role in impaired glucose tolerance. Android adiposity (ANDROID) and gynoid adiposity (GYNOID) have been proven to be linked with insulin resistance. A higher risk of sarcopenia is associated with type 2 diabetes mellitus (T2DM). In this study, ANDROID, GYNOID, and ANDROID to GYNOID ratios (A/G ratios) were evaluated in T2DM patients to determine if they were associated with sarcopenia.
Methods:
We recruited 1086 T2DM patients, measured skeletal muscle index (SMI), ANDROID, GYNOID, and collected clinical data.
Results:
T2DM patients with 119 male subjects had sarcopenia (20.24%), and 72 female subjects had sarcopenia (16.51%). All patients with T2DM who had high ANDROID and A/G ratios were at a reduced risk of sarcopenia. The SMI showed a correlation with ANDROID and A/G ratios among subjects with T2DM.
Conclusion:
ANDROID and A/G ratios are inversely related to sarcopenia in T2DM patients.
Background
Sarcopenia is a multifactorial condition of high complexity, marked by a progressive decline in skeletal muscle mass and function, which occurs with advancing age. 1 Various diseases are linked to sarcopenia. It can affect a person’s quality of life, increase their dependence, or lead to hospitalizations.2,3 Primary sarcopenia is often attributed to aging without any apparent underlying cause, and secondary sarcopenia has a variety of causes. Sarcopenia and sarcopenic obesity are reportedly intertwined closely with chronic diseases. The concomitant risks of falls and bone fragility are synergistically heightened in individuals afflicted with sarcopenia. 4 Advancing age, male gender, malnutrition, and sedentary lifestyle are identified as factors that elevate the susceptibility to sarcopenia.5,6 Sarcopenia also exhibits a close association with obesity, osteoporosis, and type 2 diabetes mellitus (T2DM).7,8 In cases of early detection, intervention, and secondary prevention, the implementation of a strategy is crucial. Consequently, the identification of novel biomarkers is urgently needed.
Obesity is widely recognized to be one of the greatest health threats, contributing greatly to metabolic and cardiovascular complications. The trunk has two types of fat depots, namely, the android (upper body) and gynoid (lower body) adiposity, leading to a different concept of truncal fat depots. Android adiposity (ANDROID) deposition is more closely related to cardiometabolic risk than gynoid adiposity (GYNOID) deposition. Android and gynoid adiposities were first distinguished by Vague, who found that ANDROID has a worse metabolic profile than GYNOID. 9 To measure the regional fat mass, advanced technology is now being used with computed tomography and dual-energy X-ray absorption (DXA). The high precision, reliability, and repeatability of DXA make it a valuable tool for research studies that assess muscle mass. Numerous studies quantified by DXA have established a correlation between ANDROID and GYNOID with diabetes, cardiovascular disease, and metabolic syndrome. However, studies investigating the relevance of ANDROID and GYNOID to sarcopenia are few. The ratio of ANDROID to GYNOID (A/G ratio) is known to play a significant role in cardiovascular and metabolic diseases. It is also associated with insulin resistance. The first definition of sarcopenic obesity was given by Baumgartner as a condition of coexistence between sarcopenia and obesity. 10 It can be characterized by a high A/G ratio and low skeletal muscle index (SMI). The distribution of fat mass may influence fracture risk in sarcopenic obesity according to previous studies. 11 In the present study, we hypothesized that a connection existed between regional fat mass and sarcopenia in individuals with T2DM, which has not been previously explored. We aimed to investigate the impact of ANDROID, GYNOID, and A/G ratio on T2DM patients who experience sarcopenia.
Methods
Patients
The work was a cross-sectional study. A total of 1142 consecutively diagnosed inpatients with T2DM were gathered in the endocrinology department of the Qilu Hospital in Qingdao from period September 2017 to September 2019. We obtained the written informed consent of all participants. The included patients were aged 20 years or older. Pregnant patients, patients suffering from infections, cancer, severe hip or knee osteoarthritis, and patients with stroke histories were excluded. Finally, 1086 patients were included after excluding 56 patients. T2DM was defined according to the American Diabetic Association. This study was approved by the hospital ethics board and performed in compliance with the Declaration of Helsinki.
A cross-sectional survey was conducted on the distribution of sarcopenia. The initial survey found sarcopenia rates of 24% in men and 19% in women, leading to sample sizes of 323 men and 434 women for hypothesis testing with a 0.05 α and 20% δ. All eligible patients from the past 2 years were included, ultimately including 588 men and 508 women.
Definition of sarcopenia
We measured SMI using a DXA spectrometer (Hologic Discovery A, Waltham, Marlborough, MA, USA). An individual’s SMI was calculated by dividing their appendicular skeletal muscle mass by their height. For men, sarcopenia was defined as SMI < 7.0 kg/m2. For women, it was defined as one less than 5.4 kg/m2.
Measurements
Clinical, laboratory, and anthropometric (height, body weight, systolic blood pressure (SBP), and diastolic blood pressure (DBP)) analyses were conducted. Diabetes duration was collected. Body mass index (BMI) was calculated by body mass (kg)/height (m) 2 . Total cholesterol (TC), high-density lipoprotein (HDL), low-density lipoprotein (LDL), triglyceride (TG), and fasting plasma glucose (FPG) were determined with an automatic analyzer (Hitachi 7170, Hitachi; Tokyo, Japan) in all subjects after an overnight fast. ANDROID, GYNOID, A/G ratio, and body fat percentage (BFP%) were also determined using a DXA spectrometer.
Statistical analysis
SPSS (version 22, IBM; Chicago, IL, USA) was used in all statistical analyses. Data are presented as the mean ± SD. T2DM patients with and without sarcopenia were compared using unpaired t tests and Chi-square tests. Several risk factors for sarcopenia were identified through logistic-regression method. To identify whether ANDROID, GYNOID, A/G ratio, SMI, and other clinical characters were correlated, simple and multiple linear-regression analyses were performed. A p value of 0.05 served as a threshold for statistical significance.
PASS (version 15.0, NCSS; Utah, USA) was used to calculate the sample size based on the prevalence of sarcopenia in different genders.
Results
Differences between sarcopenic and nonsarcopenic subjects
The data presented in Table 1 revealed that 20.24% of male and 16.51% of female T2DM patients exhibited sarcopenia. Among males in the sarcopenia group, age, HDL, and HbA1c levels increased, whereas SMI, height, body weight, BMI, DBP, TG, ANDROID, and A/G ratio decreased compared with males in the nonsarcopenia group. Compared with those patients without sarcopenia, female T2DM patients with sarcopenia were older and had lower SMI, BFP%, height, body weight, BMI, TG, ANDROID, and A/G ratio.
The characteristic differences between T2DM patients with and without sarcopenia.

BFP%, body fat percentage; BMI, body mass index; DBP, diastolic blood pressure; FPG, fasting plasma glucose; HDL, high-density lipoprotein; LDL, low-density lipoprotein; SMI, skeletal muscle index; TC, total cholesterol; T2DM, type 2 diabetes mellitus; TG, triglyceride.
Association between sarcopenia and ANDROID, GYNOID, A/G ratio
ANDROID, GYNOID, and A/G ratio were correlated with sarcopenia, as shown in Tables 2–4. Type 2 diabetics with low ANDROID levels and low A/G ratios may have a higher risk of sarcopenia. Sarcopenia was inversely connected with ANDROID and A/G ratio in T2DM after adjustment by age. A further adjustment for the age, diabetes duration, BMI, SBP, DBP, FPG, TC, HDL, LDL, and TG showed that ANDROID and GYNOID were still negatively correlated with sarcopenia.
The association between ANDROID and sarcopenia.

Model 1 was not adjusted; Model 2 was adjusted for age; Model 3 was adjusted for age, duration of diabetes, BMI, SBP, DBP, TG, TC, LDL, HDL, and FPG.
ANDROID, android adiposity; BMI, body mass index; CI, confidence interval; DBP, diastolic blood pressure; FPG, fasting plasma glucose; HDL, high-density lipoprotein; LDL, low-density lipoprotein; OR, odds ratio; SBP, systolic blood pressure; TC, total cholesterol; TG, triglyceride.
The association between GYNOID and sarcopenia.

Model 1 was not adjusted; Model 2 was adjusted for age; Model 3 was adjusted for age, duration of diabetes, BMI, SBP, DBP, TG, TC, LDL, HDL, and FPG.
BMI, body mass index; CI, confidence interval; DBP, diastolic blood pressure; FPG, fasting plasma glucose; GYNOID, gynoid adiposity; HDL, high-density lipoprotein; LDL, low-density lipoprotein; OR, odds ratio; SBP, systolic blood pressure; TC, total cholesterol; TG, triglyceride.
The association between ANDROID/GYNOID ratio and sarcopenia.

Model 1 was not adjusted; Model 2 was adjusted for age; Model 3 was adjusted for age, duration of diabetes, BMI, SBP, DBP, TG, TC, LDL, HDL, and FPG.
ANDROID, android adiposity; BMI, body mass index; CI, confidence interval; DBP, diastolic blood pressure; FPG, fasting plasma glucose; GYNOID, gynoid adiposity; HDL, high-density lipoprotein; LDL, low-density lipoprotein; OR, odds ratio; SBP, systolic blood pressure; TC, total cholesterol; TG, triglyceride.
Various characteristics are associated with SMI
According to Table 5, simple linear regression indicated a correlation between SMI and age, diabetes duration, BFP%, height, body weight, BMI, DBP, HDL, and TG, ANDROID, and A/G ratio in males. Age, BMI, ANDROID, and A/G ratio remained correlated with SMI in multiple linear regressions.
The association between clinical characteristics and SMI in male subjects.

BFP, body fat percentage; BMI, body mass index; CI, confidence interval; DBP, diastolic blood pressure; FPG, fasting plasma glucose; HDL, high-density lipoprotein; LDL, low-density lipoprotein; SBP, systolic blood pressure; SMI, skeletal muscle index; TC, total cholesterol; TG, triglyceride.
As shown in Table 6, a regression analysis based on simple linear equations showed an association between SMI and age, BFP%, body weight, BMI, DBP, HDL, ANDROID, and A/G ratio among females. Multiple linear regressions found that age, BFP%, height, body weight, ANDROID, and A/G ratio were also correlated with SMI.
The association between clinical characteristics and SMI in female subjects.

BFP, body fat percentage; BMI, body mass index; CI, confidence interval; DBP, diastolic blood pressure; FPG, fasting plasma glucose; HDL, high-density lipoprotein; LDL, low-density lipoprotein; SBP, systolic blood pressure; SMI, skeletal muscle index; TC, total cholesterol; TG, triglyceride.
Relationship between ANDROID, GYNOID, A/G ratio, and other clinical characteristics
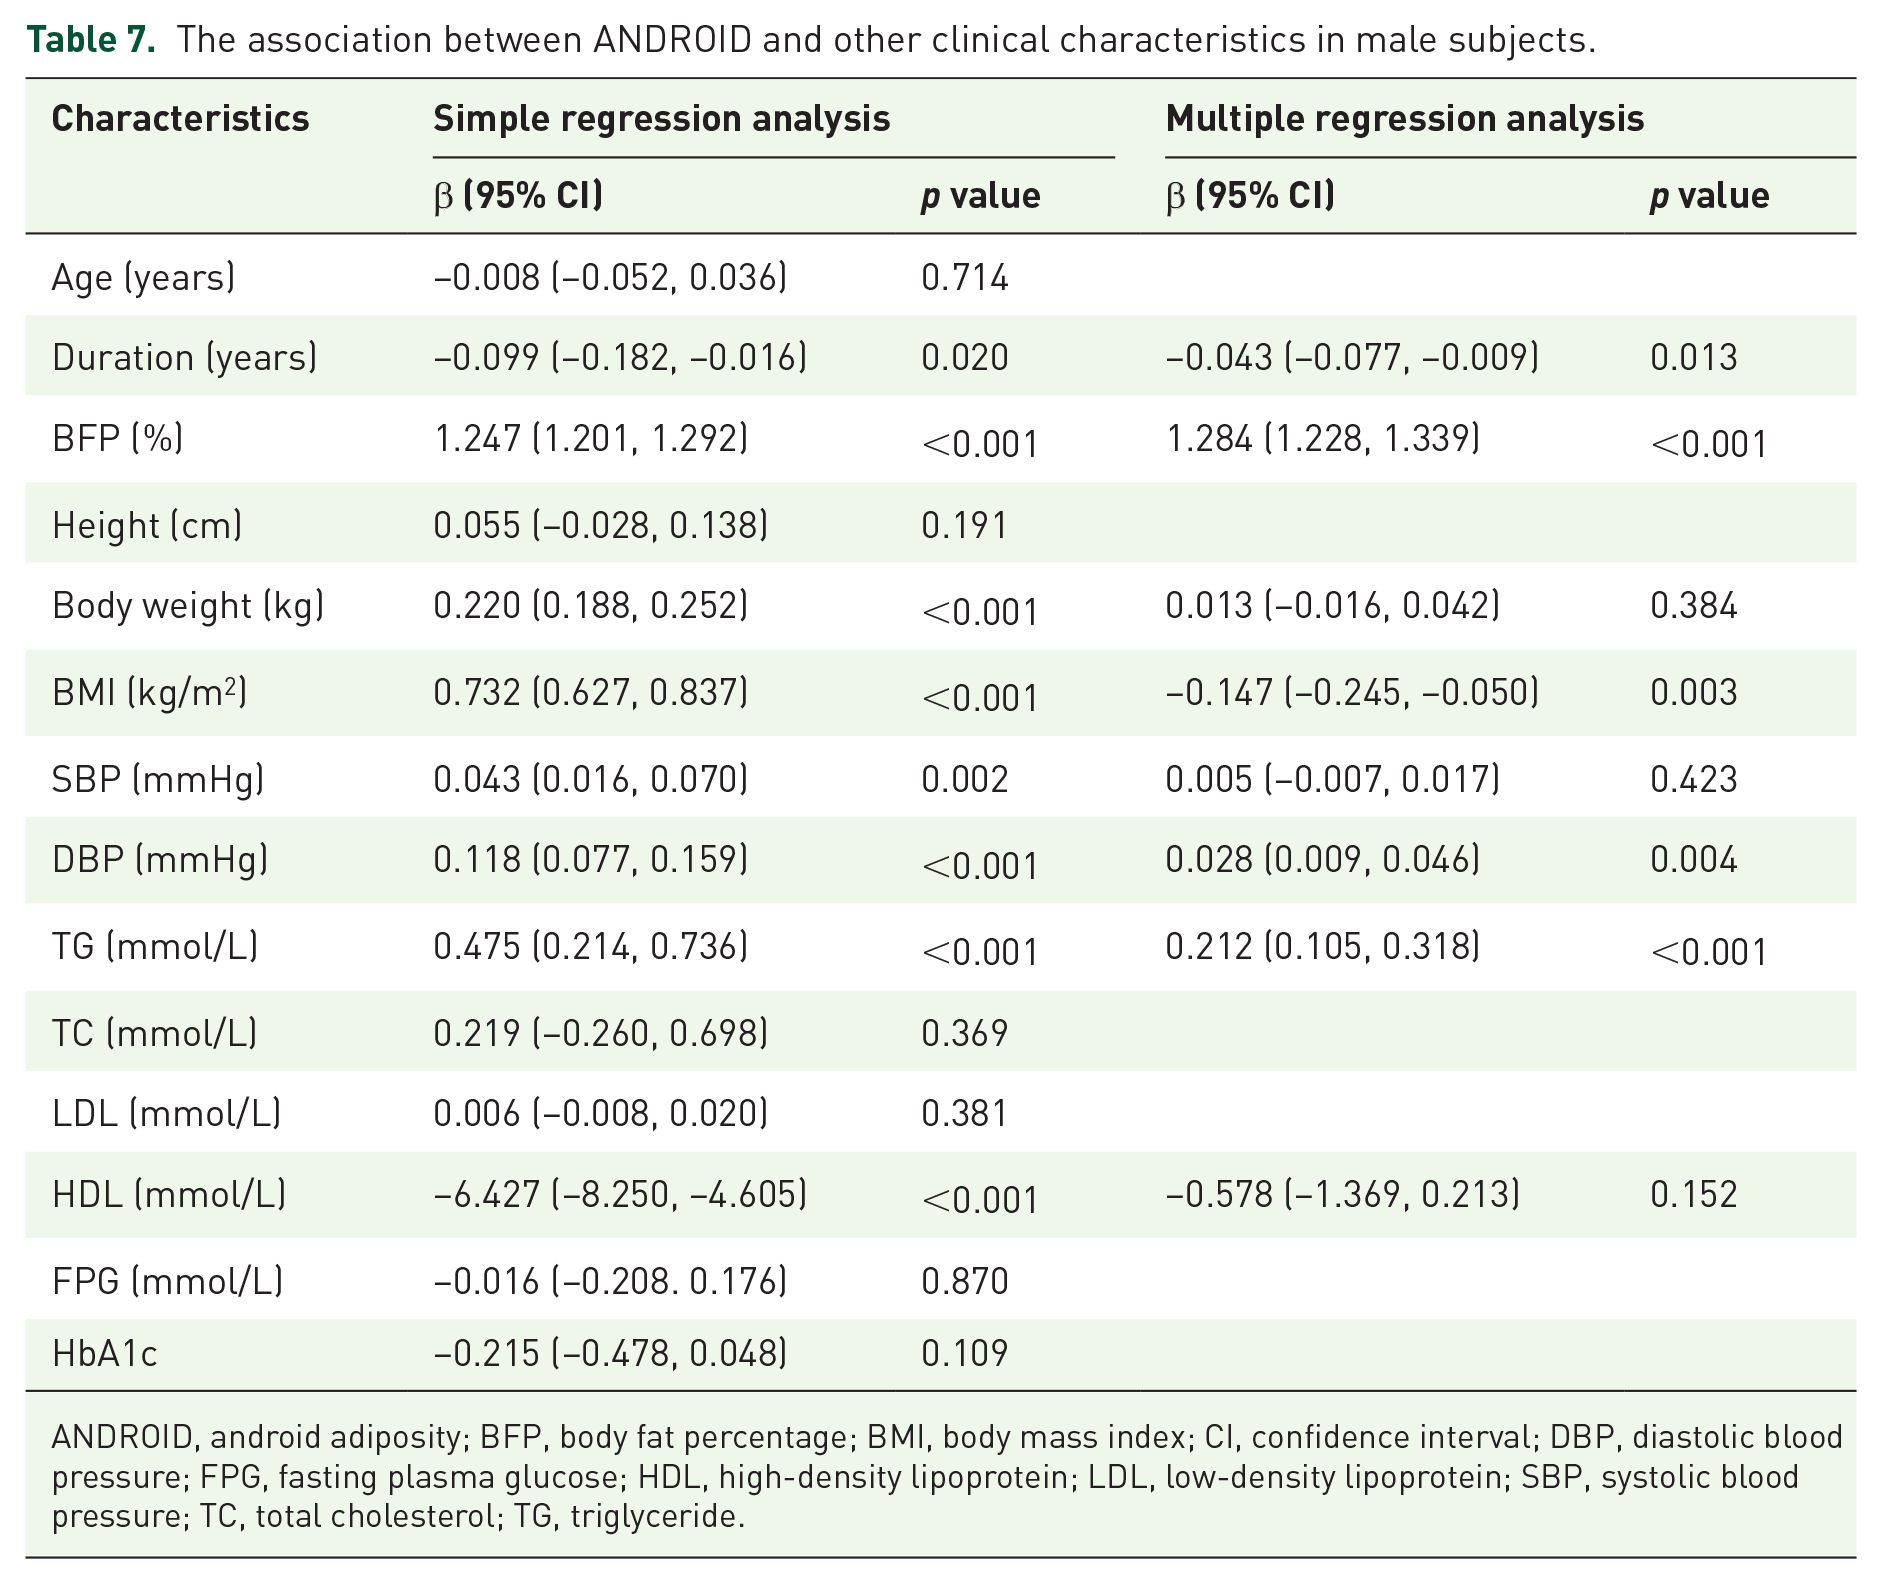
Based on simple linear regression, ANDROID was correlated with diabetes duration, BFP%, body weight, BMI, SBP, HDL, DBP, and TG in males. Multiple linear-regression analysis showed that diabetes duration, BFP%, BMI, DBP, and TG were associated with ANDROID (Table 7).
The association between ANDROID and other clinical characteristics in male subjects.
ANDROID, android adiposity; BFP, body fat percentage; BMI, body mass index; CI, confidence interval; DBP, diastolic blood pressure; FPG, fasting plasma glucose; HDL, high-density lipoprotein; LDL, low-density lipoprotein; SBP, systolic blood pressure; TC, total cholesterol; TG, triglyceride.
Using the same simple linear regression, a correlation was found between GYNOID and BFP%, body weight, BMI, SBP, DBP, LDL, and HDL in males. After multiple linear regressions, BFP%, DBP, and HDL still showed correlation with GYNOID (Table 8).
The association between GYNOID and other clinical characteristics in male subjects.

BFP, body fat percentage; BMI, body mass index; CI, confidence interval; DBP, diastolic blood pressure; FPG, fasting plasma glucose; GYNOID, gynoid adiposity; HDL, high-density lipoprotein; LDL, low-density lipoprotein; SBP, systolic blood pressure; TC, total cholesterol; TG, triglyceride.
A/G ratio showed correlation with duration of diabetes, BFP%, body weight, BMI, SBP, DBP, TC, HDL, and TG in male subjects. Based on the multiple linear regressions, BFP%, DBP, HDL, and TG were still significantly correlated with A/G ratio (Table 9).
The association between ANDROID/GYNOID ratio and other clinical characteristics in male subjects.

ANDROID, android adiposity; BFP, body fat percentage; BMI, body mass index; CI, confidence interval; DBP, diastolic blood pressure; FPG, fasting plasma glucose; GYNOID, gynoid adiposity; HDL, high-density lipoprotein; LDL, low-density lipoprotein; SBP, systolic blood pressure; TC, total cholesterol; TG, triglyceride.
As shown in Table 10, ANDROID was correlated with age, diabetes duration, BFP%, body weight, BMI, SBP, and DBP based on simple linear regressions for female subjects. The diabetes duration and BFP% showed similar correlation with ANDROID in multiple linear regressions.
The association between ANDROID and other clinical characteristics in female subjects.

ANDROID, android adiposity; BFP, body fat percentage; BMI, body mass index; CI, confidence interval; DBP, diastolic blood pressure; FPG, fasting plasma glucose; HDL, high-density lipoprotein; LDL, low-density lipoprotein; SBP, systolic blood pressure; TC, total cholesterol; TG, triglyceride.
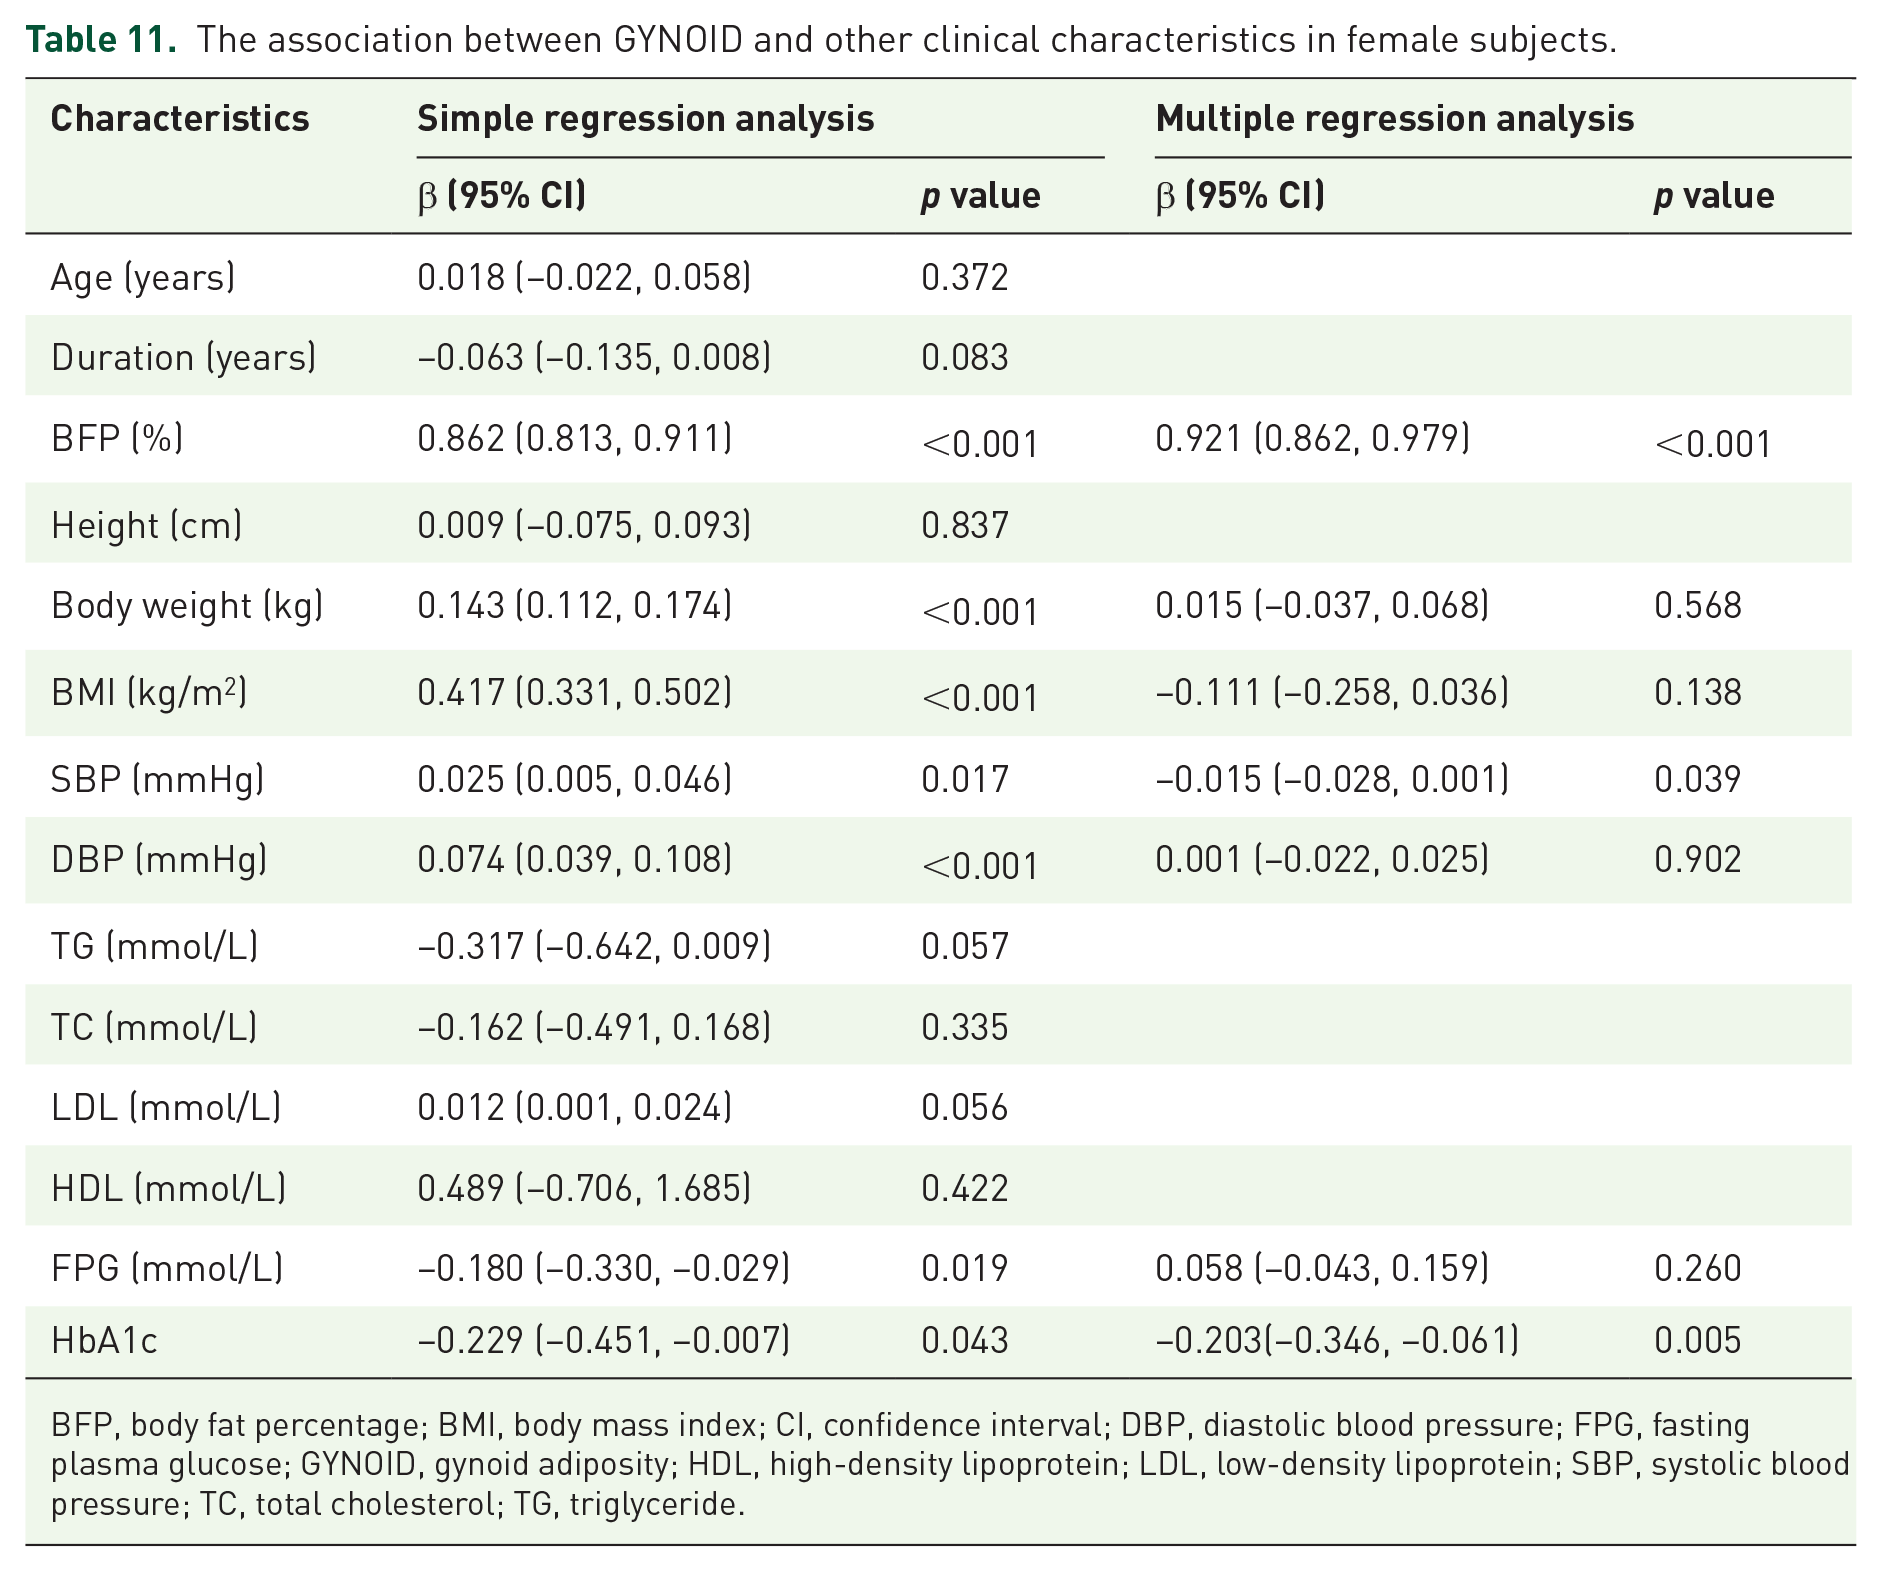
After multiple linear regressions, GYNOID was correlated with BFP%, SBP, DBP, FPG, and HbA1c, but not with body weight or BMI (Table 11).
The association between GYNOID and other clinical characteristics in female subjects.
BFP, body fat percentage; BMI, body mass index; CI, confidence interval; DBP, diastolic blood pressure; FPG, fasting plasma glucose; GYNOID, gynoid adiposity; HDL, high-density lipoprotein; LDL, low-density lipoprotein; SBP, systolic blood pressure; TC, total cholesterol; TG, triglyceride.
Table 12 shows that A/G ratio was correlated with age, BFP%, body weight, BMI, HbA1c, SBP, DBP, TC, HDL, and TG. It remained correlated with BFP%, TC, and HDL after multiple linear regressions.
The association between ANDROID/GYNOID and other clinical characteristics in female subjects.

ANDROID, android adiposity; BFP, body fat percentage; BMI, body mass index; CI, confidence interval; DBP, diastolic blood pressure; FPG, fasting plasma glucose; GYNOID, gynoid adiposity; HDL, high-density lipoprotein; LDL, low-density lipoprotein; SBP, systolic blood pressure; TC, total cholesterol; TG, triglyceride.
Discussion
Obesity is associated with cancer, cardiovascular diseases, and insulin resistance, as well as musculoskeletal disorders. Sarcopenia can also be caused by obesity. 12 The Kadoma Sarcopenia Study has revealed that age (⩾75 years), obesity, and hypertension are the independent risk factors for overall sarcopenia. 13 A low BMI is associated with sarcopenia, secondary to chronic inflammation. 14 Low gait speed is associated with a high BMI, but sarcopenia and skeletal muscle decline are prevented. Age and BMI reportedly have a clear association with sarcopenia. 15 Consistent with previous studies, we also found that patients with sarcopenia were older and had lower body weight and BMI (Table 1). Sarcopenia was also frequent in T2DM patients. Previous literature shows that BMI is correlated negatively with the prevalence of sarcopenia under T2DM.16–18 The same experimental results were demonstrated in our experiments. A lower BMI was shown in T2DM patients with sarcopenia.
Sarcopenic obesity also reportedly increases cardiovascular events, arterial stiffness, and carotid atherosclerosis risk. 19 However, we did not find sarcopenic obese patients as predicted in the clinical samples we collected. The A/G ratios and ANDROID levels decreased in almost all sarcopenia patients. Whether the patients with sarcopenia and nonsarcopenia were statistically analyzed separately or the SMI value was used for regression analysis, our results suggested that sarcopenia may be more prevalent in type-2 diabetics with low ANDROID levels and low A/G ratios (Table 2–6).
Android fat and A/G ratio are more often studied as disease-related risk factors. A higher ANDROID corresponds with a higher risk of insulin resistance or diabetes in older adults, and increased android level may be a predictor of metabolic syndrome.20–23 A higher android level may significantly affect cardiovascular disease risk factors in boys or young men who are overweight.24,25 Through altered endothelial function, fat accumulation in the android compartment is associated with increased cardiovascular and metabolic risk. 25 Meanwhile, gynoid fat protects against cardiovascular disease, and higher gynoid fat may also be linked to metabolic diseases. 26 A direct relationship exists among A/G ratio, cardiovascular, and metabolic disease. In addition, it is closely related to insulin resistance or functional capacity in men with heart failure.27,28 A study has demonstrated that patients with T2DM are more likely to develop nonalcoholic fatty liver disease and atherosclerosis when their A/G ratio is higher, and a higher A/G may reflect insulin resistance. 19 Sex differences should be considered because the relationships among android fat, insulin resistance, and metabolic syndrome are sex dependent. 21
However, our study concluded that individuals with T2DM, both men and women, were more prone to developing sarcopenia in the presence of low ANDROID and A/G ratio. This finding indicated that a specific distribution of adipose tissue throughout the body was necessary for optimal health because deviations from this balance can predispose individuals to various pathological conditions.
This work had several limitations. Given the small sample size and cross-sectional nature, the conclusions cannot be strong. More longitudinal studies are necessary to confirm the causative relationship.
Conclusion
Patients with T2DM had a higher risk of sarcopenia when ANDROID and A/G ratios were lower. SMI was positively correlated with ANDROID and A/G ratio. As a result, ANDROID and A/G were inversely correlated with sarcopenia in T2DM patients.