
Abstract
Background:
Thyroid hormones are controlled by the hypothalamic–pituitary–thyroid (HPT) axis through a complex network of regulatory loops, involving the hormones TRH, TSH, FT4, and FT3. The relationship between TSH and FT4 is widely used for diagnosing thyroid diseases. However, mechanisms of FT3 homeostasis are not well understood.
Objective:
We used mathematical modelling to further examine mechanisms that exist in the HPT axis regulation for protecting circulating FT3 levels.
Methods:
A mathematical model consisting of a system of four coupled first-order parameterized non-linear ordinary differential equations (ODEs) was developed, accounting for the interdependencies between the hormones in the HPT axis regulation. While TRH and TSH feed forward to the pituitary and thyroid, respectively, FT4 and FT3 feed backward to both the pituitary and hypothalamus. Stable equilibrium solutions of the ODE system express homeostasis for a particular variable, such as FT3, if this variable stays in a narrow range while certain other parameter(s) and system variable(s) may vary substantially.
Results:
The model predicts that (1) TSH-feedforward protects FT3 levels if the FT4 production rate declines and (2) combined negative feedback by FT4 and FT3 on both TSH and TRH production rates keeps FT3 levels insensitive to moderate changes in FT4 production rates and FT4 levels. The optimum FT4 and FT3 feedback and TRH and TSH-feedforward ranges that preserve FT3 homeostasis were found by numerical continuation analysis. Model predictions were in close agreement with clinical studies and individual patient examples of hypothyroidism and hyperthyroidism.
Conclusions:
These findings further extend the concept of HPT axis regulation beyond TSH and FT4 to integrate the more active sister hormone FT3 and mechanisms of FT3 homeostasis. Disruption of homeostatic mechanisms leads to disease. This provides a perspective for novel testable concepts in clinical studies to therapeutically target the disruptive mechanisms.
Keywords
Introduction
The adaptive response of the hypothalamic–pituitary–thyroid (HPT) axis to both internal (thyroid or pituitary) dysfunction and external challenges (variations in the supply of iodine and other essential substrates, stress, variations in plasma volume, etc.) is critical for protecting life-sustaining energetic and metabolic processes in the body.1,2 It is mediated by a network of regulatory loops, which include thyrotropin-releasing hormone (TRH), thyroid-stimulating hormone (TSH), free thyroxine (FT4) and free tri-iodothyronine (FT3) (Figure 1). For FT4, a negative feedback on TSH in the HPT axis regulation has been discovered decades ago. 3 This relationship has subsequently been successfully used for the diagnosis and classification of thyroid diseases.4,5 Indeed, TSH has been given a defining role in the diagnosis of hypothyroidism and hyperthyroidism by current guidelines. 5 However, recent evidence suggests that the TSH level may be less health-defining than previously thought.6,7
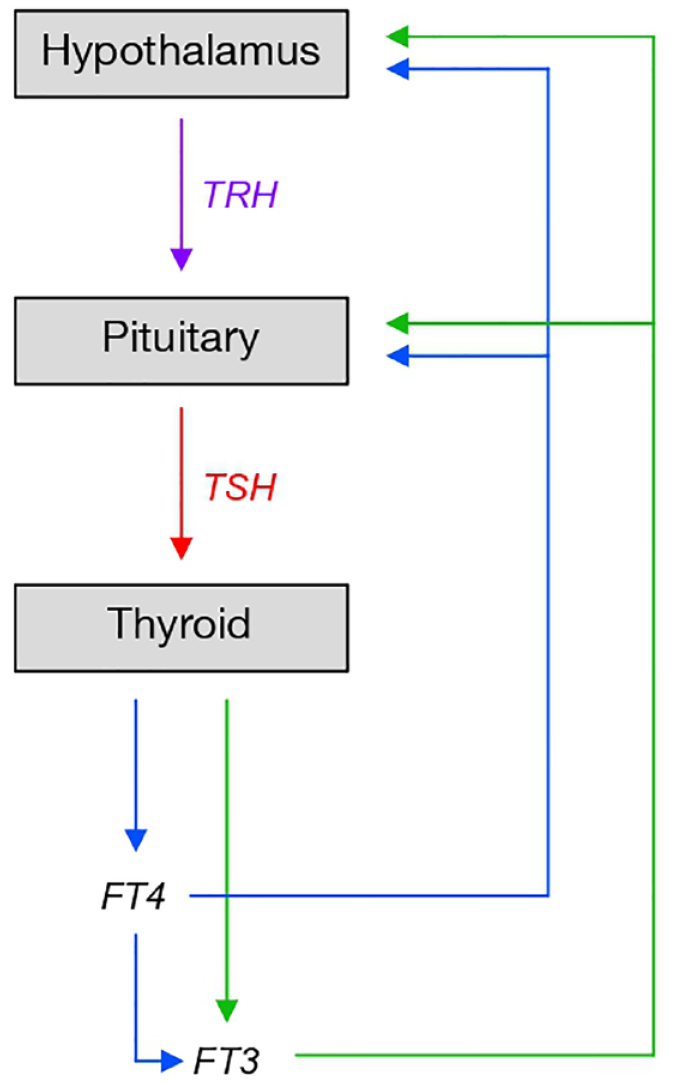
The hypothalamic–pituitary–thyroid (HPT) axis.
The energetic needs of the body cannot be met when the HPT axis does not function properly. In particular, the basal metabolic rate and resting energy expenditure remain low.8,9 The functioning HPT axis is also required to adapt to various endogenous and exogenous influences, such as changes in body weight or body composition, ageing, thyroidal and non-thyroidal illness and psycho-social stress, the administration of exogenous thyroid hormones and/or epigenetic influences.2,10 The adaptation of the HPT axis occurs on a much slower time scale, compared with the more dynamic HPA axis.11,12
Relayed by brain signals and neuroendocrine mechanisms, filtered by specialized cells (tanycytes) at the blood–brain barrier and transmitted downstream to the hypothalamus, numerous influences impact on the HPT axis, particularly affecting TRH signalling.13,14 TRH increases the synthesis and secretion of the pituitary hormone TSH in a dose-dependent manner. TSH, in turn, enhances the synthesis and release of mainly two thyroid hormones, FT4 and FT3, by the thyroid gland. 1 A deficiency in the production of FT4 in the thyroid leads to the clinical disease of primary hypothyroidism, that of TSH to secondary hypothyroidism.5,15 TSH has also a partial, but important, role in converting FT4 through enzymatic reactions into its biologically more active sister hormone FT3.16–22 The FT4 and FT3 released into the blood stream are largely and reversibly bound to transport proteins. Only small fractions, termed FT4 and FT3, are free and responsible for biological actions. 1
Understanding the disruption of homeostatic mechanisms that lead to disease is regarded as essential for effective therapy, aiming to re-establish the homeostatic conditions. 23 The mechanisms underlying FT3 homeostasis have recently been theoretically detailed using mathematical modelling. 24 This allows for the testing of disrupted homeostatic mechanisms as they may relate to thyroid disease. The present study further investigates the mechanisms that support the homeostasis of FT3 levels over the preservation of FT4 and TSH levels in the HPT axis regulation and the disease-related consequences of their disruption. Of particular interest is the weakening of TSH-feedforward onto FT3 in patients with low residual thyroid function and its potential implications for treatment. 24 This study questions the rationale for making TSH the predominant thyroid function test while measurement of FT3 is deemed diagnostically redundant. 5
Materials and methods
Derivation of the mathematical model
The present model is based on our minimal mathematical model, 24 which was developed from the understanding of the interrelationships between the hormones in HPT axis regulation 1 and theoretical principles of endocrine regulation. 24 In addition, it constructs the essential mechanisms described by the earlier study, 24 using physiologically realistic production rate constants and binding affinities of the hormones to the relevant receptor, including saturation effects (Supplementary Material, doi: 10.5281/zenodo.7344861). We followed a systems biology approach, as described in general by Alon. 25 We did not seek to develop the full molecular details for the complex feedback and feedforward mechanisms which are only partly known. The rationale for our approach is based on the concept of relational stability where the activities of the feedback loops respond to each other. 26 System stability is expressed as a state of conditional balance between the strengths of the influences of the appropriate loops. This allows us to compare the predictions of the present model constructed with physiological parameters and those of the minimal model. With appropriate scaling based on fractions of the normal levels of the hormones, the two models showed high congruence (Supplementary Figure 1, doi: 10.5281/zenodo.7344861).
The new mechanistic model consists of a system of four coupled first-order parameterized non-linear ordinary differential equations (ODEs), accounting for the processes and their dependencies on the relevant parameters that govern production rates of FT4 and FT3 which, in turn, determine the thyroid functional state. We studied the dependencies on and sensitivities of key system variables to the relevant parameters. Homeostasis of a particular variable, in our case FT3, is defined as a stable equilibrium solution of the ODE system, where the interdependencies are balanced. Consequently, this variable stays in a narrow range, as other parameters and system variables may vary substantially. The transition from a euthyroid state to a hypothyroid state was modelled by decreasing the FT4 production rate, as a fraction of the original rate. In the case of a progressive loss of thyroid tissue, at some point, enzyme capacities of thyroid peroxidase and deiodinases are reduced, and therefore, production rates of FT4 and FT3 become limiting in turn. Conversely, hyperthyroidism was modelled by an increase in the fraction of the FT4 production. To model hyperthyroidism, more specifically the aetiology of Graves’ disease, TSH-receptor antibodies (TSHR Abs), which increase the FT4 production rate, were introduced into the model. 1 To model thyroid hormone replacement with either levothyroxine (LT4 drug), liothyronine (LT3 drug) or a combination of the two (LT4–LT3 drug), the drugs were introduced to the model as constant external production rates of FT4 and FT3, so as to match the normal endogenous production rates of the hormones.
The regulatory network of the HPT axis
The biological system that regulates the production of FT4 and FT3 is composed of three glands, hypothalamus, pituitary and thyroid, termed the HPT axis 1 (Figure 1). The three glands communicate with each other in time and space through the release of specific hormones into the circulation, namely, TRH, TSH, FT4 and FT3 (Figure 1). The paraventricular nucleus of the hypothalamus is activated by the input of central brain signals. Origins of afferences include the limbic system and hypothalamic centres of energy metabolism. Additional modulating inputs comprise, among others, cytokines, endocannabinoids and glucocorticoids. Hypothalamic output is hormonally expressed via the increase in the rate of secretion of TRH into the local portal vein, a vessel that flows from the median eminence into the pituitary gland. 27 At the pituitary, TRH activates pituitary cells (thyrotrophs), which secrete the hormone TSH into the blood stream. Pituitary stimulation via TSH is required to raise the FT4 production rate by the thyroid gland from a low basal secretion to a level that is sufficient to maintain metabolic requirements in an individual. Activated by TSH, thyroid follicular cells secrete mainly two hormones into the circulation, a large amount of FT4, and, in a lesser amount, a second biologically more active thyroid hormone, FT3. 20 However, glandular production is not the only FT3 source. FT3 is additionally derived by FT4–FT3 conversion through a process involving deiodinizing enzymes. 28 Several types of deiodinases are expressed by the thyroid and many other tissues. 28 Importantly, the reactions of the intra-thyroidal enzymes and those in several other tissue are TSH-dependent.16,20,21 In the blood stream, T4 and T3 reversibly bind to and equilibrate with thyroid hormone-binding proteins (TBGs, transthyretin and albumin); only a minute fraction of each is freely available as FT4 and FT3. 1 FT4 is converted to FT3 when taken up by cells and transported to the nucleus where, after binding in a receptor complex to specific DNA sites, it exerts multiple actions at the gene (28, type 1 and type 2 signalling). Direct non-genomic actions of FT4 (type 3 and type 4 signalling) are also known.29,30 For optimal functioning of cells and organs, FT4 and FT3 are maintained in tight ranges. Insufficient concentrations of FT4 and FT3 cause an ‘energy deficiency’ syndrome, termed hypothyroidism, and their excessive concentrations over time cause symptoms of ‘energy excess’ and the disease of thyrotoxicosis. FT4 and FT3 close negative feedback loops at the pituitary and hypothalamus by inhibiting the rate of production and secretion of the two upstream hormones, TSH and TRH1,24 (Figure 1).
Derivation of the equations
TRH production and combined feedback of FT4 and FT3 on TRH

(a) Where
(b) The denominator accounts for the combined non-competitive negative feedback of FT4 and FT3 on TRH. FT4 contributes its fraction v12 and FT3 contributes its fraction 1–v12; K is the dissociation constant of the binding of FT3 to the thyroid hormone receptor, 31 and cf is a concentration factor, which accounts for the proportionally higher intracellular level of FT3, compared with the FT3 level in the blood. 22
(c)
Remark
The binding of FT3 to the thyroid hormone receptor is described by the Michaelis–Menten term K/(K + FT3) 31 Intracellular FT3 (approximately 1e−8 M) exceeds K (range of 1e−11–1e−10 M) by a factor of 100–1,000. 22 The kinetics of the transmembrane transport and plasma transport of FT4 and FT3 32 were not detailed, assumed to be non-limiting and proportional (linear, in the absence of certain diseases, such as the Allan–Herndon–Dudley syndrome) 33 and approximated by a proportionality constant cf. The concentrations of protein-bound total hormones T4 (T3) and FT4 (FT3), used here, are interconvertible. 22
TSH production and combined feedback of FT4 and FT3 on TSH

(a) Where

(c) The denominator accounts for the combined negative feedback of FT4 and FT3 on TSH. FT4 contributes its fraction v22 and FT3 contributes its fraction 1–v22; K is the dissociation constant of the binding of FT3 to the thyroid hormone receptor 31 and cf is a concentration factor.
(d)
FT4 production and feedforward of TSH on FT4

(a) Where k31 accounts for the FT4 production rate, which is stimulated by TSH.
(b)
FT3 production and feedforward of TSH on FT3

(a) Where k41 is the coefficient for the step-up extrathyroidal FT4–FT3 conversion rate, k42 the coefficient for the mainly intra-thyroidal FT4–FT3 conversion rate stimulated by TSH-feedforward and k43 is the coefficient for the intra-thyroidal FT3 secretion rate stimulated by TSH-feedforward. 1
(b)
Parameterization of the model
Suitable values for the parameters were adopted from the literature and previous modelling,21,22,35–37 as detailed in Supplementary Materials (doi: 10.5281/zenodo.7344861). Numerical equilibrium solutions to the ODE system are provided in Supplementary Materials.
Comparison with clinical data
Model predictions were compared with observed results in clinical samples and examples of patients with hypothyroidism and hyperthyroidism. No primary data were collected for this study. Deidentified data were available from a previous prospective study where full demographic details have been reported. 38 Their use was approved by the local authorities in data protection.
Results
To model the transition from a normal thyroid state to hypothyroidism or hyperthyroidism, we investigated the sensitivities of FT3, FT4 and TSH with respect to changes in the fraction (v0) of the thyroid FT4 production rate. While FT4 and TSH levels responded sensitively to a change in the FT4 production rate (Figure 2), the FT3 level remained insensitive to a moderate decrease (Figure 2(a)) or moderate increase (Figure 2(b)) in the FT4 production rate. As FT4 and TSH levels changed substantially in opposite directions with a declining or increasing FT4 production rate, FT3 levels stayed in a narrow range, being protected by mechanisms within the HPT axis network that support FT3 homeostasis. As a result, the original homeostatic FT3 level was closely preserved, while, at the same time, there were more substantial changes in the levels of both FT4 and TSH (Figure 2(c) and (d)).

Sensitivities of FT3, FT4 and TSH to changes in the FT4 production rate. The fraction of the production rate of FT4 is denoted by v0. (a) If v0 decreases from 1 to 0, FT4 falls, while TSH rises simultaneously (due to reduced feedback by FT4 on TSH). FT3 does not decrease proportionally to FT4 (due to increased feedforward by TSH on FT3). (b) Conversely, if v0 increases from 1 to 15, FT4 increases, TSH decreases. Again, FT3 increases to a relatively lesser extent than FT4. (c) As v0 decreases (a), TSH increases from the normal to the hypothyroid range, but FT3 stays nearly unchanged despite a substantial change in its precursor FT4. (d) With increasing v0, TSH decreases, approaching its lower reference limit and FT4 levels rise substantially more, compared with FT3 levels.
FT3-protective mechanisms at the thyroid and pituitary
As the FT4 production rate decreased, the level of FT3 was protected by an increase in the TSH-feedforward mechanism (Figure 3(a)). Conversely, the FT3-protective effect was lost, if the TSH-feedforward was deficient or absent (Figure 3(a)). Weakening of the TSH-feedforward on FT3 resulted in a substantial shift in the balance between TSH and FT3 (Figure 3(a)) and that of FT4 and TSH (Figure 3(b)). At the same TSH level, the level of FT3 was lower and that of FT4 higher, compared with the intact mechanism. The shifts represent new adapted equilibria, which are important to recognize, as the original balance between the hormones in the normal thyroid state is no longer relevant and applicable as a point of reference.

FT3-protective mechanisms in the HPT axis regulation. (a) As the FT4 production rate decreases (as in Figure 2), FT3 levels are protected with increasing TSH levels due to increased TSH-feedforward on FT3 (FF intact). If the TSH-feedforward mechanism is weakened (FF 50%) or lost (FF absent) FT3 levels decline more strongly. (b) The strength of the feedforward mechanism shifts the balance between FT4 and TSH. (c) The pituitary feedback strength of FT4 and/or FT3 on TSH influences the FT3 levels. Combined negative feedback (FB) by FT4 and FT3 (fractions of 0.66 and 0.34) renders FT3 levels less sensitive to a moderate change in v0, compared with FT4-only or FT3-only feedback. (d) The strengths of the feedbacks shift the balance between FT4 and TSH. (e) A redundancy in the FT3-protective mechanisms can further protect FT3 levels. A weakness in FT4–FT3 conversion (FF absent), for instance, can be compensated by increasing FT3 secretion (FS strong). (f) The treatment of an athyreotic patient on thyroid hormone replacement is modelled. FT4 supplied by the T4 drug is expressed as a fraction of the normal FT4 production rate (v0). Unlike in the normal case, 1 in the treatment case, 2 FT3 levels are not protected and FT3 escapes from homeostasis. FT3 levels can only be brought back to the normal level by an over-supply with FT4 (v0 > 1), with higher FT4 and lower TSH levels, compared the original normal levels. (g) Compared with the T4 drug, 1 a T4–T3 combination drug 2 can better protect the original FT3 levels. (h) FT3 levels can be raised with dose titration of a T3 drug alone, but this produces a steeper FT3 gradient and a major shift in the balance between the hormones.
FT3 homeostasis was also found to be influenced by the strengths of hypothalamic and pituitary feedback by FT4 and/or FT3. In this respect, combined negative feedback by FT4 and FT3 was found to be more effective in protecting the FT3 level, compared with FT4-only and FT3-only feedbacks (Figure 3(c)). Maximum insensitivity of FT3 levels to a decrease in the FT4 production rate was found by numerical continuation analysis with the following fractions of FT4 and FT3 in the combined feedback, 66% and 34% on TSH at the pituitary, and 49% and 51% on TRH at the hypothalamus, respectively. For the different modes of pituitary feedback, the relationships are shown between TSH and FT3 (Figure 3(c)) and FT4 and TSH (Figure 3(d)).
Several processes contribute to the production of FT3, namely, extrathyroidal FT4–FT3 conversion, intra-thyroidal FT4–FT3 conversion and FT3 secretion per se. The underlying processes of the different contributions showed a remarkable redundancy in their ability to protect FT3 levels (Figure 3(e)). Lower FT4–FT3 conversion rates can be compensated by increasing FT3 secretion (Figure 3(e)).
To model the situation of an athyreotic patient on thyroid hormone replacement with LT4, we assumed a constant production rate of FT4 delivered by the T4 drug, which was within the range of the normal endogenous FT4 production rate (Figure 3(f)). The use of the drug in this condition shows an escape from the original FT3 homeostasis with a considerable shift in the original balance between the three hormones FT3, FT4 and TSH. At the same internal and external FT4 production rates, comparable levels of FT3 cannot be achieved. FT3 can only be raised to its original normal level with the delivery of an over-supply of FT4 by the drug, associated with a relatively higher level of FT4 and lower level of TSH (Figure 3(f)). The use of a combination drug of T4 and T3 keeps the equilibria values of the hormones closer to their normal equilibrium levels, compared with the T4 drug alone (Figure 3(g)). FT3 levels can be raised with dose titration of a T3 drug alone. This is associated with a steeper gradient of FT3 levels and a major shift in the equilibrium solutions for the hormones (Figure 3(g)).
Comparison of model predictions with clinical results
The mechanisms above demonstrated a wide-ranging adaptivity of the system to protect FT3 levels including varying balances between the hormones. This precludes the use of fixed target values, particularly in conditions where specific mechanisms are compromised, as, for instance, in patients with autoimmune thyroiditis or patients with little residual thyroid tissue post-surgery. At the onset of thyroid autoimmune disease, the TSH-feedforward mechanism and the increase in the level of TSH with a decreasing FT4 level is predicted by the model, to protect the level of FT3 against a shortage in the availability of FT4. This means that the attainment of FT3 homeostasis depends on the balance between the opposing influences of FT4 and TSH. The model prediction is confirmed by the observation of FT3 homeostasis in a previous clinical study in patients with untreated autoimmune thyroiditis, plotting the FT4/TSH ratio against FT3 (Figure 4(a)). In athyreotic patients on LT4 replacement, on the other hand, where the FT3-protectve mechanisms are broken, a loss of FT3-homeostasis was predicted (Figure 3) and observed in the clinical sample of athyreotic patients on LT4 replacement therapy (Figure 4(a)). Predictions of the model in the hypothyroid range were further compared with individual examples of clinically observed outcomes in patients with hypothyroidism post thyroidectomy prior to radioiodine treatment before commencing LT4 treatment (Figure 4(b) and (c)). To model the development of hyperthyroidism in Graves’ disease, TSHR Ab was assumed to increase both thyroid size and FT4 production rate, and to decrease TSH production at the pituitary (Figure 4(d) and (e)). Model predictions were compared with a clinical sample of 31 patients with TSHR Ab-positive Graves’ disease (Figure 4(d) and (e)). The model predictions were found to be in close agreement with actual results (Figure 4).

Comparison of model predictions with clinical results. (a) In untreated patients (n = 357) with autoimmune thyroiditis (AIT) and subclinical hypothyroidism FT3 homeostasis was preserved, as the FT4–TSH ratio varied widely. In contrast, FT3 escaped from homeostasis in athyreotic patients (n = 77) with thyroid carcinoma on levothyroxine (LT4) replacement (Ca). The slopes in the two groups were statistically significantly different (non-linear general additive model, p = 0.02), as predicted by modelling (Figure 3). (b) The transition from thyroid health to severe hypothyroidism is modelled in a hypothetical case and clinically observed in individual patients. As the production rate of FT4 decreases (v0 = 0.0004–1), FT4 decreases while TSH increases, with the curve displaying a non-linear relationship between the two hormones. The points were measured in hypothyroid patients (different colour by patient id) post thyroidectomy prior to radioiodine treatment before commencing LT4 treatment. (c) Predicted and observed FT3–TSH relationship under the conditions in (b). (d) The transition from thyroid health to hyperthyroidism in Graves’ disease is modelled, with increasing TSHR Ab activity (2–50 IU/l) increasing both glandular size and FT4 production rate, and decreasing TSH production. The curve displays the predicted outcomes for FT4 versus TSH and (e) FT3 versus TSH in a hypothetical single case. For comparison, points from different patients (n = 31) with TSHR Ab-positive Graves’ disease are overlaid.
Discussion
The contemporary diagnosis of thyroid disease 5 is based on the conventional view of HPT axis regulation, which is confined to FT4 regulation and FT4 feedback on TSH. 3 This does not incorporate the regulation and effects of FT3, the biologically more active sister hormone of FT4. 1 The needs for the protection of homeostasis of FT3 go beyond the regulation of FT4 production. 24 Given the essential role of energy control by thyroid hormones in humans, the performance of the complex, multifaceted regulation of the HPT axis is of wider interest beyond the diseases of the thyroid gland.2,24 The HPT axis regulation has to be sufficiently flexible to allow suitable adjustments of the system parameters in response to variations of the system requirements in different physiological situations, including thyroid and non-thyroid diseases.1,2 A recent study on the mechanisms of FT3 homeostasis, using a minimal mathematical model uncovered essential mechanisms to be considered in the design of diagnostic and therapeutic protocols of the HPT axis regulation. 24 In the present study, we construct a mathematical model of the essential mechanisms described by the earlier study, 24 using physiologically realistic parameters and units of hormones. The new model and the minimal models show high congruence when compared on the relative strengths of the constitutive loops (Supplementary Figure 1, doi: 10.5281/zenodo.7344861). The physiologically more realistic mechanistic model is used to predict the consequences of disruptions of relevant mechanisms and their implication for thyroid disease and thyroid hormone replacement therapy.
Mathematical modelling is regarded as an indispensable tool in the study of homeostatic regulation in physiology. 23 This process is particularly useful when different underlying mechanisms must be recognized and accounted for, to permit specific treatment of each condition. 39 Different mechanisms may be statistically conflated at the population level, resulting in seemingly similar phenomenological outcomes in clinical studies, but actually due to vastly different mechanisms. 39 For instance, high-normal or slightly increased TSH concentrations may be caused by two very different aetiologies, namely, a stress-related change in the so-called set point of the normal functioning HPT axis, or in response to early thyroid failure in patients with subclinical hypothyroidism. 39
By modelling the transition from a normal thyroid state to hypothyroidism or hyperthyroidism, we investigated the sensitivities of FT3, FT4 and TSH with respect to changes in the thyroid FT4 production rate. We were particularly interested in the outcome of FT3 homeostasis, where the stable FT3 equilibrium solution of the ODE system remains maximally insensitive and nearly constant, while other variables and/or problem parameters undergo significant changes. As previously predicted, 24 a combination of feedback and feedforward loops in the system of HPT axis regulation was found to render FT3 insensitive to moderate changes in FT4 production rates and circulating FT4 concentrations. As for the mechanisms involved, the most favourable for the homeostasis of FT3 was feedback by both hormones FT4 and FT3 at both hypothalamic and pituitary sites. Optimized feedback fractions for FT4 and FT3 of 0.66 and 0.34 at the pituitary and 0.49 and 0.51 at the hypothalamus were found by numerical continuation analysis. Statistical analysis in a clinical study yielded comparable estimates for FT4 and FT3 of approximately 0.52 and 0.38 at the pituitary, with the remainder being accounted for by an FT4–FT3 interaction term. 40 We note that these fractions may, however, vary between individuals and their circumstances. 41 For instance, in athyreotic patients treated with LT4, the sensitivity of TSH to feedback by FT4 has been shown to vary genetically. 42 If the thyroid function and FT4 production rate decline, as is the case in a patient with subclinical hypothyroidism, TSH-feedforward on FT3 was found to be required for FT3 protection. The latter involves two distinct mechanisms because TSH regulates more than one enzymatic reaction, namely, the intra-thyroidal conversion of FT4–FT3 and secretion of FT3. 22 The individual contributions of each process may vary by species and condition. 22 This is shown here to add a redundant capability to the system; if either one of the two processes were to fail, the other can be increased to successfully compensate for the failure. However, if the TSH-feedforward is lost, the original homeostasis of FT3 can no longer be preserved, as in the condition of an athyreotic patient on LT4 replacement. 26 The loss of FT3 homeostasis results in predictable shifts in the original balance between FT3, FT4 and TSH. This includes drug use as a replacement in such patients. Treatment with a combination of a T4 and T3 drug is predicted to achieve comparable levels of FT3 at new equilibria closest to the original ones, whereas the use of a T4 drug alone is associated with substantially altered equilibria, and a T3 drug alone raises FT3 levels on a steep gradient to require careful drug titration and monitoring of FT3 levels. Earlier studies in rodents suggest that the disbalance between the hormones, as predicted by the model and observed in clinical studies, 26 extends to the tissue levels. 43 This may explain the findings of recent clinical studies that FT4 and FT3 correlated with patient symptoms, but TSH did not.44,45 The important influence of functional thyroid gland size (residual tissue) and the system-stabilizing role of glandular co-secretion of FT3, compared with FT4, though even in relatively small amounts, has been recently ascertained in several studies.41,46,47 Our model offers suitable predictions which allow to formulate treatment hypotheses for clinical testing. A comparison of model predictions with clinical samples and individual examples of patients with hypothyroidism and hyperthyroidism showed that the predictions of the model were in close agreement with the clinical observations and previous reports.22,48
Physiologically, FT3 is the more active thyroid hormone apart from some instances of direct (type 4) signalling of T4.1,29,30 The bulk of T3 is found within the cells, as opposed to T4, which is predominantly an extracellular hormone. 28 This allows for differentiated local adaption of the T3 levels at the cellular level in various tissues. 28 Nevertheless, the extracellular and intracellular compartments are in equilibrium. 49 The sum effect of circulating FT3 is reported back to the hypothalamus and pituitary to adjust FT4 production and systemic FT3 production via TSH-feedforward.1,16–22 This protects FT3 homeostasis, even in the presence of mild thyroid failure, unless the mechanism is disrupted, as in patients with insufficient remaining functional thyroid tissue or pituitary/hypothalamic insufficiency.26,38,48 The interindividual variation in the distribution of the TSH, FT4 and FT3 response curves and their combination determine the balance point expressed between the hormones in a person and shift it in different conditions.6,50 In the population, disaggregation of individual correlations produces the statistical phenomenon of stratification collider bias (Simpson’s paradox), to an extent which precludes the use of averaging statistics. 51 As a result, strong correlations between TSH and both FT4 and clinical symptoms in overt primary hypothyroidism weaken towards the euthyroid range. This may, at least partly, explain why a recent meta-analysis found clinical outcomes to be more strongly associated with thyroid hormones than TSH levels. 45 In subclinical hypothyroidism, the levels of FT3 and FT4 dissociate progressively, as TSH and the FT3/FT4 ratio increase, and are no longer proportional. 48 Depending on the success or failure of the compensatory mechanisms, this laboratory constellation may or may not be associated with symptomatic disease.
It follows that, while TSH and FT4 concentrations are sensitive markers of thyroid gland failure in primary hypothyroidism, FT3 levels are more informative about the functional state of the rest of the body. Guidelines have partly addressed this conundrum by separating therapeutic targets from diagnostic criteria. 5 Advances in the understanding of HPT regulation should encourage both a more accurate diagnostic paradigm and inclusive re-definition of contentious entities, such as ‘subclinical hypothyroidism’. 5
We show that the rescue mechanisms of FT3 homeostasis, built into the intact HPT axis regulation, are strongly operative. Conversely, if disrupted, athyreotic patients on LT4 monotherapy solely depend on efficient T4–T3 conversion. 26 However, when compromised in the absence of facilitating TSH-feedforward, this mechanism may fail, as modelled here. In a portion of patients, escalating the LT4 dose may therefore prove unsuccessful to restore the FT3 levels to their pre-surgical homeostatic level and resolve persistent symptoms.44,46,47 In such situations, targeted LT3 supplementation, similar to the natural homeostasis, may correct FT3 disequilibrium and also avoid potentially unfavourable effects of FT4 excess. The latter has been linked, even within the euthyroid range, to adverse cardiovascular outcomes and direct T4 effects (type 4 signalling), unrelated to T3 signalling, including malignant growth.29,30,51,52 In secondary hypothyroidism, pituitary TSH is deficient, which, in turn, affects TSH-feedforward, TSH–FT4 balance and FT3 homeostasis.15,51 Again, replacement guided by FT4 measurement alone may miss the optimum FT3 target. In the non-thyroidal illness syndrome, the low-FT3 is mainly due to a disturbed balance in the HPT regulation between peripheral type 1 and central type 2 deiodinase activities and intracellular T3 levels, whose net effect strengthens FT3 feedback inhibition on TSH, and weakens TSH-feedforward on FT3. 2 This is mostly regarded as a beneficial energy-conserving mechanism, and treatment with thyroid hormones is contentious.2,53
Of note, the thyroid is not the only target of pituitary TSH, as other tissues express a functional TSHR, such as fat tissue, bone and myocardium. 54 In obesity, this allows bidirectional communication, namely allostatic type 2 adaption of the HPT axis setting via leptin, to inform the central control system on the fat and energy reserves of the body and TSH-feedforward correction to energy storage and expenditure. 2 In bone, TSH binding to the local receptor inhibits the RANKL pathway and thereby osteoclast maturation and activation. 54 In the heart, TSH binding inhibits ion currents, thereby decelerating the physiological rhythm generator and antagonizing beta-adrenergic stimulation. 52 Probably due to heterogeneous study populations and conflated statistics, 39 the association between thyroid state and the hazard of cardiovascular events was reported to be u-shaped for TSH, yet monotonic for FT4. 52 While most studies on cardiovascular outcomes did not include any FT3 measurements, some found u-shaped associations of FT3 concentrations with the risk of atrial fibrillation. 55 TSH is more than a ‘thyroid stimulating-hormone’, as variants produced in the pars tibialis of the pituitary have been recognized to activate receptors other than the TSHR – a mechanism which has been implicated and modelled in adjusting the seasonal setting of the HPT axis. 24
Interconnected complex networks such as the HPT axis can jointly express mechanisms of homeostasis and allostasis. 2 This unifies global and local adaptions towards a common goal, making the system as a whole robust and adaptive.2,24 However, trade-offs may arise under certain conditions, particularly if homeostatic mechanisms are disrupted, for instance demanding ‘under-replacement’ in individuals susceptible to atrial fibrillation.48,51 Accordingly, asymmetric movements and the interdependent nature of thyroid parameters, act as controlling and controlled variables. 24 This is incompatible with basic assumptions underlying conventional statistical tests, and thus requires a modelling approach.
The strength of the study is an analysis of the integrated defence mechanisms of FT3 levels. This has important implications for our understanding of allostatic responses of the control system. It shows that the trajectories to both reduced FT3 levels, as in type 1 allostatic load leading to non-thyroidal illness or TACITUS syndrome and elevated FT3 levels, as in type 2 allostatic response, cannot be reached by modulation of deiodinase activity alone. Therefore, it is necessary that both central and peripheral mechanisms are synchronized, 24 as demonstrated for both NTIS 2 and type 2 thyroid allostatic load.39,53 This study is limited, in that we focused in our modelling on investigating physiological mechanisms and their disease-related disruptions rather than striving for molecular details. For models addressing these details, the interested reader is referred to previous models by our group and others.21,22,35,47,56 We relied on highly accurate numerical continuation software57,58 but a standard initial value solver is sufficiently accurate to find asymptotically stable equilibrium solutions for our ODE system. A further limitation of our approach was to approximate drug therapy with a steady-state drug supply rather than a pharmacokinetic model. However, as this investigation’s aim is solely to provide information on the evolution of steady-state values, that information can be dispensed with.
As an implication of our findings, we demonstrated that in the HPT axis regulation homeostatic mechanisms exist that support thyroid health by coordinating hormone supply and utilization, and their disruption is associated with thyroid disease. Consequently, therapy should be directed towards re-establishing the homeostatic conditions as rapidly and optimal as possible to be effective. 23 In this respect, our findings identified FT3 homeostasis as an essential target of the HPT axis regulation. 24 Key differences between the FT4–TSH-centred view of the HPT axis currently used in thyroid diagnostics and the newly proposed FT3-inclusive perspective of HPT axis regulation are contrasted in Table 1.
An FT3-inclusive perspective of HPT axis regulation.

FT3, free tri-iodothyronine; FT4, free thyroxine; HPT, hypothalamic–pituitary–thyroid; TSH, thyroid-stimulating hormone.
Our model aids in the evaluation of disease-defining mechanisms, frequently conflated in population statistics, 39 structural parameters and individualized homeostatic targets. 51 This is particularly important, given the adaptive and conditional expression of balance points in the complex regulatory network, as shown here, which move in a non-linear way and are otherwise difficult to predict.
The extended perspective on HPT regulation together with an individualized modelling approach encourages testing novel emerging concepts targeting the disrupted mechanisms and aiming at the restoration of FT3 homeostasis. This may be particularly useful in the development of early thyroid failure, recognition of mild disruption of FT3 homeostasis and treatment with thyroid hormones. The treatment targets may be approached by a suitable determination of relevant mechanisms and specific parameters in individual patients, based on repeated measurements of TSH, FT4 and FT3 over an appropriate period of time. This has been exemplified here, but the approach is to be further tested in larger prospective clinical studies where all three variables TSH, FT4 and FT3 are closely followed to be correlated with the onset of clinical symptoms of thyroid disease. A meta-analysis by Fitzgerald et al. provides an example of such an attempt. 45 In agreement with our model predictions, these authors showed strong associations of patient symptoms with thyroid hormones, but not with TSH. 45 Future dedicated studies on FT3 homeostasis, in addition to conventional FT4 and TSH measurements, may assist clinicians in improved decision-making in individualized medicine. A distinction between different supportive or disruptive physiological mechanisms responsible for various clinical scenarios and diseases supports the use of specific targeted treatment of the individual.
Supplemental Material
sj-docx-1-tae-10.1177_20420188231158163 – Supplemental material for The role of supporting and disruptive mechanisms of FT3 homeostasis in regulating the hypothalamic–pituitary–thyroid axis
Supplemental material, sj-docx-1-tae-10.1177_20420188231158163 for The role of supporting and disruptive mechanisms of FT3 homeostasis in regulating the hypothalamic–pituitary–thyroid axis by Rudolf Hoermann, Mark J. Pekker, John E. M. Midgley and Johannes W. Dietrich in Therapeutic Advances in Endocrinology and Metabolism
Footnotes
Acknowledgements
The authors appreciate the recent contributions of Carel Jonkhout into upgrading CL_MATCONTL toolbox. 58 The authors wish to thank Rolf Larisch, Klinikum Lüdenscheid for continued support and valuable discussions.
Declarations
Supplemental material
Supplemental material for this article is available online.
References
Supplementary Material
Please find the following supplemental material available below.
For Open Access articles published under a Creative Commons License, all supplemental material carries the same license as the article it is associated with.
For non-Open Access articles published, all supplemental material carries a non-exclusive license, and permission requests for re-use of supplemental material or any part of supplemental material shall be sent directly to the copyright owner as specified in the copyright notice associated with the article.